The spatial clustering of X-ray selected AGN and galaxies in the Chandra Deep Field South and North
We investigate the spatial clustering of X-ray selected sources in the two deepest X-ray fields to date, namely the 2Msec Chandra Deep Field North (CDFN) and the 1Msec Chandra Deep Field South (CDFS). The projected correlation function , measured on scales Mpc for a sample of 240 sources with spectroscopic redshift in the CDFN and 124 sources in the CDFS at a median redshift of , is used to constrain the amplitude and slope of the real space correlation function . The clustering signal is detected at high confidence () in both fields. The amplitude of the correlation is found to be significantly different in the two fields, the correlation length being Mpc in the CDFS and Mpc in the CDFN, while the correlation slope is found to be flat in both fields: in the CDFS and in the CDFN (a flat Universe with and is assumed; Poisson error estimates are considered). The correlation function has been also measured separately for sources classified as AGN or galaxies. In both fields AGN have a median redshift of and a median 0.5-10 keV luminosity of erg s-1, i.e. they are generally in the Seyfert luminosity regime. As in the case of the total samples, we found a significant difference in the AGN clustering amplitude between the two fields, the best fit correlation parameters being Mpc, in the CDFS, and Mpc, in the CDFN. In the CDFN, where the statistics is sufficiently high, we were also able to measure the clustering of X-ray selected galaxies, finding Mpc and . Within each field no statistically significant difference is found between soft and hard X-ray selected sources or between type 1 and type 2 AGN. After having discussed and ruled out the possibility that the observed variance in the clustering amplitude be due to observational biases, we verified that the extra correlation signal in the CDFS is primarily due to the two prominent redshift spikes at reported by Gilli et al. (gilli03 (2003)). The high ( Mpc) correlation length measured for the X-ray selected AGN at in the two Chandra Msec fields is comparable to that of early type galaxies at the same redshift. This is consistent with the idea that, at , AGN with Seyfert-like luminosities might be generally hosted by massive galaxies.
Key Words.:
Surveys – Galaxies: active – X-rays: general – Cosmology: large-scale structure of Universeemail:gilli@arcetri.astro.it
1 Introduction
Active Galactic Nuclei (AGN) represent one of the best tools to study the large scale structure of the Universe at intermediate-high redshifts, , i.e. at an epoch of intense structure formation where matter was undergoing the transition from the initially smooth state observed at the recombination () to the clumpy distribution observed at present time (see e.g. Hartwick & Schade 1990).
One of the most commonly used statistics to measure the clustering of a population of sources is the two-point correlation function , which measures the excess probability of finding a pair of objects at a separation with respect to a random distribution and is usually approximated by a power law . Under simple assumptions, the amplitude of the AGN correlation function can be used to estimate the typical mass of the dark matter halos in which AGN reside (Grazian et al. grazi04 (2004), Magliocchetti et al. maglio04 (2004)) and the typical AGN lifetimes (Martini & Weinberg marti01 (2001)).
The first attempts to measure AGN clustering date more than 20 years ago (Osmer osmer81 (1981)). Since then AGN clustering has been extensively studied and detected by means of optical surveys encompassing an increasing number of QSOs (Shanks et al. shank87 (1987), La Franca et al. lafra98 (1998), Croom et al. croom01 (2001), Grazian et al. grazi04 (2004)). Recently, the 2dF QSO Redshift Survey (2QZ, Croom et al. croom01 (2001)) has provided the tightest constraints to QSO clustering, based on a sample of more than objects: the QSO correlation length and slope were found to be Mpc and at a median redshift of and on comoving scales of Mpc. This result confirmed previous measurements and showed that QSO clustering at is comparable to that of local () optically selected galaxies (Tucker et al. tuck97 (1997), Ratcliffe et al. rat98 (1998)). In addition, thanks to the large number of QSOs in their sample, Croom et al. (croom01 (2001)) were also able to investigate the evolution of QSO clustering with redshift, finding a marginal increase by a factor of 1.4 in the value from to for a flat cosmology with and .
Although optical surveys provide the largest AGN samples so far, they include almost exclusively unobscured-type 1 objects, since AGN candidates are mainly selected by means of UV excess techniques. Obscured-type 2 AGN might instead be efficiently selected by means of mid- and far-infrared surveys, since the nuclear UV radiation absorbed by the obscuring medium is expected to be re-emitted at longer wavelengths. Georgantopoulos & Shanks (geo94 (1994)) analyzed the clustering properties of a sample of local Seyfert galaxies () observed with IRAS and selected through their warm infrared colors. By comparing the observed number of independent pairs with that expected from a random sample distributed over the same scales, they measured a clustering signal for the total sample, finding marginal evidence that Seyfert 2 galaxies are more clustered than Seyfert 1s.
Perhaps the most efficient way to sample the obscured AGN population is through X-ray observations, especially in the hard band, where the nuclear radiation is less affected by absorption. Based on population synthesis models for the X-ray background (e.g. Comastri et al. comas95 (1995), Gilli et al. gilli01 (2001), Ueda et al. ueda03 (2003)), obscured AGN are believed to be a factor of more abundant than unobscured ones and should therefore dominate the whole AGN population. Spatial clustering of X-ray selected AGN has been limited so far by the lack of sizable samples of optically identified X-ray sources. Boyle & Mo (boyle93 (1993)) studied the AGN at in the Einstein Medium Sensitivity Survey (EMSS, Stocke et al. 1991), without finding any positive clustering signal. Carrera et al. (carrera98 (1998)) considered the AGN in the ROSAT International X-ray Optical Survey (RIXOS, Mason et al. 2000) and in the Deep ROSAT Survey (DRS, Boyle et al. boyle94 (1994)), detecting only a weak () clustering signal on scales Mpc for the RIXOS AGN subsample in the redshift range . Significant clustering signal was instead detected from angular correlations by several Authors: Akylas et al. (2000), based on the ROSAT All Sky Survey (RASS, Voges et al. 1999); Vikhlinin & Forman (vikh95 (1995)) from a compilation of ROSAT PSPC deep pointings, and finally Giacconi et al. (2001) from the first 130 ksec observation of the Chandra Deep Field South (Rosati et al. 2002). Very recently Yang et al. (yang03 (2003)) have claimed that hard X-ray selected sources have an angular clustering amplitude ten times higher than that of soft X-ray selected sources. A high angular clustering amplitude for hard X-ray selected sources, consistent with that measured by Yang et al. (yang03 (2003)), has been also measured by Basilakos et al. (basil04 (2004)). In some cases (e.g. Vikhlinin & Forman 1995; Akylas et al. 2000; Basilakos et al. 2004) the angular clustering was converted to spatial clustering by means of the Limber’s equation, where an a priori redshift distribution has to be assumed. Unfortunately, because of the several uncertainties in its assumptions, this method has not provided stringent results: Akylas et al. (akylas00 (2000)) found Mpc, Vikhlinin & Forman (vikh95 (1995)) Mpc and Basilakos et al. (basil04 (2004)) Mpc.
To date, the only direct measurement of spatial clustering of X-ray selected AGN has been obtained from the ROSAT North Ecliptic Pole survey data (NEP, Gioia et al. gioia03 (2003)). From a sample of 219 soft X-ray selected AGN, Mullis et al. (mullis04 (2004)) measured a correlation length of Mpc with fixed to 1.8. The median redshift of the NEP AGN contributing to the clustering signal is (see also Mullis mullis01 (2001) for a preliminary version of that work). Because of the relatively short exposures in the NEP survey and the limited ROSAT sensitivity, only bright sources, with a surface density of the order of 3 deg-2, were detected in this sample. In deeper samples, where the source surface density is higher, the clustering signal should be detected more easily since the spatial correlation function is a power law increasing at lower pair separations. In particular, deep pencil beam surveys are expected to provide the highest signal significance with the minimum number of identified objects.
The Chandra Msec surveys in the Deep Field South (CDFS, Rosati et al. 2002) and North (CDFN, Alexander et al. 2003) are in this respect the ideal fields to look at, with an X-ray source surface density of the order of deg-2. The drawbacks are that these strong signals expected on small areas may be subject to substantial variance, well beyond the one implied by Poisson statistics (see Daddi et al. 2001 for a discussion of this effect in the case of angular clustering), so that the “real” amplitude of the correlation function would need a large set of measurements in independent fields to be reliably estimated. In addition, optical spectroscopy is challenging for a significant fraction of these X-ray sources with faint optical magnitude counterparts. We will address these points in the rest of the paper. A large spectroscopic identification program down to faint magnitudes () is underway in the CDFS (Szokoly et al. szoko04 (2004)) and in the CDFN (Barger et al. barger03 (2003)). To date, about 40-50% of the X-ray samples have been spectroscopically identified, revealing that, even at very low fluxes, AGN are still the most numerous sources populating the X-ray sky. Here we will take advantage of the spectroscopically identified sources in the CDFS and CDFN to measure and compare the spatial clustering of X-ray selected AGN in the two fields.
The paper is organized as follows. In Section 2 we summarize the X-ray and optical observations of the CDFS and CDFN and present the source catalogs used in our analysis. In Section 3 we describe the classification scheme adopted to divide sources into AGN or galaxies. In Section 4 we describe the methods used to estimate the projected correlation function of X-ray selected sources as well as the obtained results, which are then discussed in Section 5. Conclusions and prospects for future work are finally presented in Section 6.
Throughout this paper we will use a flat cosmology with and . Unless otherwise stated, we will always refer to comoving distances in units of Mpc, where km s-1 Mpc-1. Luminosities are calculated using .
2 X-ray and optical data
2.1 CDFS
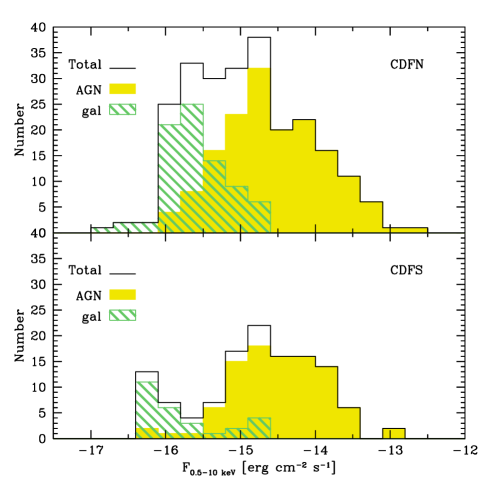
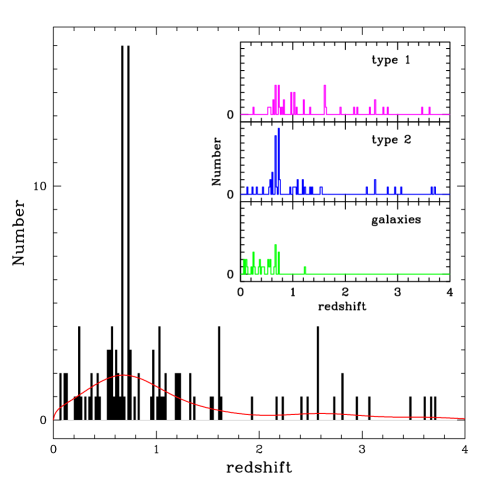
The CDFS has been observed with 11 ACIS-I pointings for a total 1 Msec exposure (Rosati et al. rosati02 (2002)). X-ray sources have been detected down to limiting fluxes of erg cm-2 s-1 (hereafter cgs) and cgs in the soft (0.5-2 keV) and hard (2-10 keV) band, respectively. Overall, 307 sources have been detected in the soft band and 251 sources in the hard band for a total sample of 346 sources distributed over the whole 0.1 deg2 field. The full X-ray catalog and the details of the detection process have been presented by Giacconi et al. (giac02 (2002)). The optical follow-up photometry was primarily performed using the FORS1 camera at the VLT (Szokoly et al. szoko04 (2004)). The combined R band data cover a arcmin field to limiting magnitudes between 26 and 26.7. In the area not covered by FORS mosaics, we used shallower data from the ESO Imaging Survey (EIS, Arnouts et al. 2001). The optical identification process is described in Tozzi et al. (tozzi01 (2001)) and Giacconi et al. (giac02 (2002)). Optical spectroscopy for most of the X-ray counterparts with R has been obtained with FORS1 during several observational runs at the VLT. About spectra of optically faint sources with were also collected. The details of the spectroscopic data reduction and analysis are presented in Szokoly et al. (szoko04 (2004)). So far 169 redshifts have been obtained. Quality flags have been assigned to the spectra, according to their reliability. Here we consider only the 127 X-ray point-like sources (excluding stars) with spectral quality flag , where two or more lines have been observed in the spectrum of the optical counterpart and the redshift determination is unambiguous. The X-ray flux and R band magnitude distribution for these sources are shown in the lower panels of Fig. 1 and Fig. 2, respectively. We estimated the redshift accuracy by considering the sources with at least two independent redshift measurements, both with , obtained in different observing runs (see Table 5 of Szokoly et al. 2004). The distribution of the redshift differences has a relatively large dispersion of . When removing two outliers with a clipping technique (both outliers are Broad Lines AGN for which a precise redshift determination is more difficult), the observed dispersion decreases to , corresponding to an average uncertainty in a single redshift measurement of .111We note that the value of 0.005 quoted by Szokoly et al. (szoko04 (2004)) as the typical uncertainty in the redshift determination is a conservative boundary. As shown in Fig. 3 the redshift distribution is dominated by two large concentrations of sources at z=0.67 and z=0.73, while other smaller peaks are also visible (see also Gilli et al. 2003), already demonstrating that X-ray sources in the CDFS are highly clustered. The final spectroscopic completeness is . This fraction increases to 78% for the subsample of X-ray sources with optical counterparts brighter than R=24. We stress that in our measurements it is essential to consider only sources with small redshift errors, otherwise the clustering signal in redshift space would be removed. The typical measurement errors in the photometric redshifts of CDFS sources (Zheng et al. zheng04 (2004)) are of the order of , corresponding to Mpc comoving at the median CDFS redshift of 0.7. The above redshift uncertainty would significantly dilute the clustering signal in the considered field (which is dominated by redshift clustering) and therefore photometric redshifts cannot be used for our purposes.
2.2 CDFN
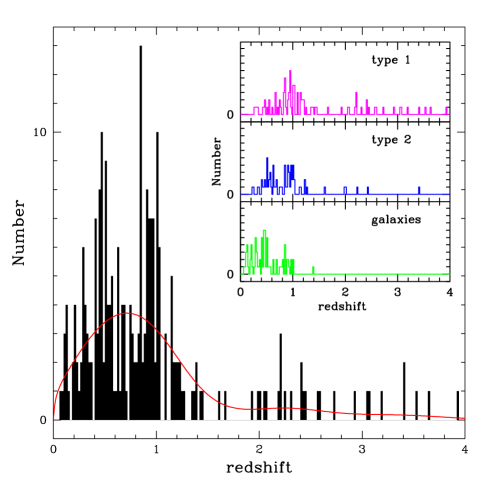
The Chandra Deep Field North (CDFN, Alexander et al. alex03 (2003), Barger et al. barger03 (2003)), which is centered on the Hubble Deep Field North (Williams et al. will96 (1996)), is the analog of the CDFS in the Northern hemisphere. The CDFN has been observed with 20 ACIS-I pointings for a total 2 Msec exposure. Limiting fluxes of cgs and cgs have been reached in the soft and hard band, respectively. A total sample of 503 X-ray sources (451 of which are detected in the soft band and 332 in the hard band) has been collected over an area of 0.13 deg2. The full X-ray catalog is found in Alexander et al. (alex03 (2003)) and the details of the optical identification program have been published by Barger et al. (barger03 (2003)). The LRIS and DEIMOS instruments at the Keck telescope were primarily used for the optical follow-up of the X-ray sources. A few additional identifications were added by cross correlating the X-ray with the optical catalog of the Caltech Faint Galaxy Redshift Survey (Cohen et al. cohen00 (2000)) which covers the inner 50 arcmin2 of the CDFN and has a spectroscopic completeness of about 90% down to R=24 in the Hubble Deep Field and to R=23 in the surrounding flanking fields. Most of the redshifts in the Barger et al. (barger03 (2003)) catalog have been obtained from spectra with multiple lines, and should be therefore comparable to the redshifts of the CDFS catalog. We ignored the 13 CDFN sources for which the redshift estimate is not based on two or more emission/absorption lines (see Barger et al. 2003). No additional high quality redshifts were obtained by cross-correlating the X-ray catalog of Alexander et al. (alex03 (2003)) with the two recently published spectroscopic catalogs of the ACS-GOODS survey in the CDFN (Cowie et al. cowie04 (2004), Wirth et al. wirth04 (2004)). The final considered catalog includes 252 sources, corresponding to a spectroscopic completeness of %. We estimated the typical redshift errors (not quoted in Barger et al. 2003) by comparing the common redshifts with high quality in the catalogs of Barger et al. (barger03 (2003)) and Cohen et al. (cohen00 (2000)). We found that the measurements in the two catalogs are in very good agreement, with essentially zero offset and a dispersion of , indicating that the redshift accuracy in each catalog is better than this value. The redshift distribution for the considered spectroscopic sample is shown in Fig. 4. As in the case of the CDFS redshift distribution, several redshift spikes can be immediately identified, the most prominent of which at and (see Barger et al. 2003).
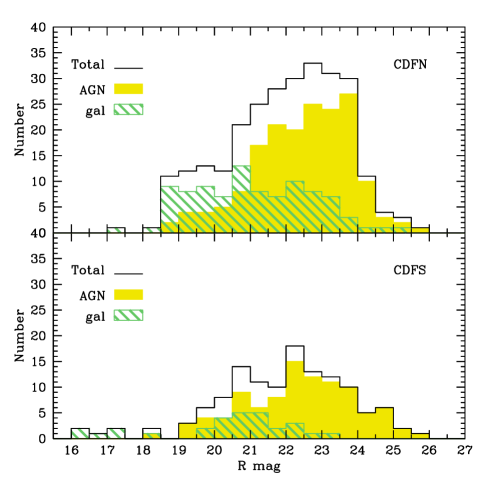
Although the general shape of the CDFN redshift distribution peaks at , similarly to that observed in the CDFS (see e.g. the smoothed curves in Fig. 3 and 4), a few differences can be noticed between the two. One obvious effect is produced by the several spikes which trace structures at different redshifts. More interestingly, the fraction of low redshift sources is higher in the CDFN than in the CDFS. As an example, 28% of CDFN sources lay at , while the corresponding fraction in the CDFS is 17%. This difference can be readily explained by the deeper CDFN exposure, which is able to pick up the faint X-ray emission of nearby normal and starburst galaxies (see the next Section and the insets of Fig. 3 and 4). The X-ray flux and R band magnitude distributions for the CDFN sources with good redshift estimate considered in this paper are shown in the upper panel of Fig. 1 and Fig. 2, respectively. Due to the higher exposure time, in the CDFN the source flux distribution has a larger fraction of objects at faint fluxes ( cgs) with respect to that observed in the CDFS 222It is worth noting that the 0.5-10 keV flux of the faintest CDFS sources ( cgs) is likely to be underestimated in Fig. 1. Indeed, since in the CDFS no X-ray photometry was performed in the total X-ray band, the 0.5-10 keV flux is obtained by simply summing the flux in the soft and in the hard band. Therefore, for sources detected in the soft band only (most of which are at the faintest fluxes), the 0.5-10 keV flux simply corresponds to the 0.5-2 keV flux, and some residual flux above 2 keV is lost. On the contrary, in the CDFN the X-ray photometry has been performed also in the total 0.5-10 keV band even for sources not detected in the 2-10 keV band, whose total flux is then always higher than the soft flux.. As mentioned above, most of these faint sources are classified as galaxies. The R-band magnitude distributions are instead more similar, with most of the spectroscopically confirmed sources in the range in both samples, confirming that the spectroscopic observations have been equally deep in both fields.
3 Source classification
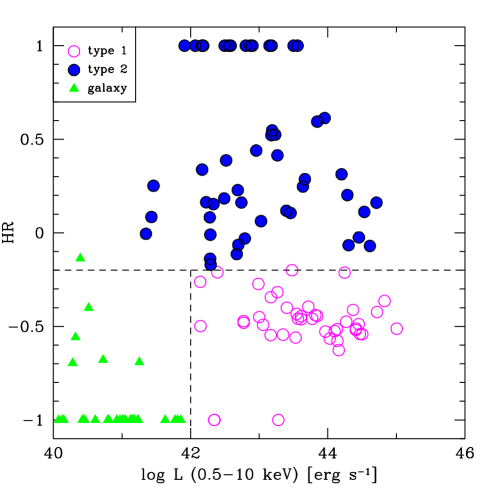
In order to measure the clustering properties of different populations, we classified our sources following the scheme presented by Szokoly et al. (szoko04 (2004)) for CDFS sources, where X-rays are the main tool to infer informations on the physical nature of each object. We somewhat simplified that scheme by avoiding the luminosity distinction between type-2 AGN/QSOs and between type-1 AGN/QSOs. Our adopted classification scheme can be then summarized as follows:
| type-1 AGN | : | log |
| type-2 AGN | : | |
| galaxy | : | log, |
where is the X-ray hardness ratio, i.e. the difference between the hard () and soft () band counts normalized to the total counts, and is the observed 0.5-10 keV luminosity in units of erg s-1.
The cut at between type-1 and type-2 AGN is motivated by the fact that most of the AGN with broad optical lines (31/32) lay below this limit, while the majority of narrow line AGN (16/21) are found above it. The adopted classification scheme is admittedly crude, but it can be considered a reasonable approach when dealing with sources with faint optical spectra, for which detailed line diagnostics is difficult.
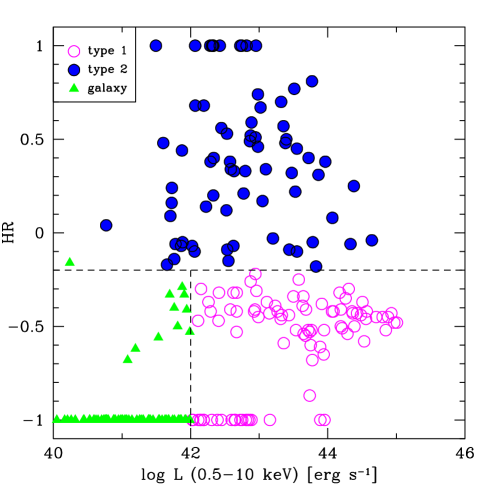
To keep a uniform classification criterion in the two field, we applied the above scheme also to CDFN sources (see also Hasinger 2003). As a consistency check, we computed the X-ray hardness ratio for CDFN sources based on the soft and hard counts presented in the Alexander et al. (alex03 (2003)) catalog, and verified that also for this sample objects with broad optical lines have as in the CDFS.
The adopted “classification diagram”, i.e. the hardness ratio vs. X-ray luminosity plot, is shown in Fig. 5 and 6 for the CDFS and CDFN sources, respectively, and the classification breakdown is shown in Table 1 (only sources with erg s-1 are considered, see Section 4.2). We point out that the significantly higher fraction of galaxies found in the 2Msec CDFN with respect to the 1Msec CDFS is due to the twice longer exposure of the CDFN. As shown in Fig. 6, the line at log appears to sharply divide a smooth source distribution into two distinct classes (galaxies and type-1 AGN). It is therefore likely that each class contain some misclassified objects. Indeed, part of the soft sources with log might harbour a low luminosity AGN and, on the other hand, galaxies with intense star formation might have X-ray luminosities exceeding log. Nonetheless, the fraction of misclassified objects should be of the order of a few percent in each class and therefore we do not expect any significant impact on our clustering measurements.
| Sample | Type 1 | Type 2 | Gal |
|---|---|---|---|
| CDFS | 45 | 52 | 27 |
| 2Msec CDFN | 89 | 71 | 80 |
| 1Msec CDFN | 79 | 60 | 37 |
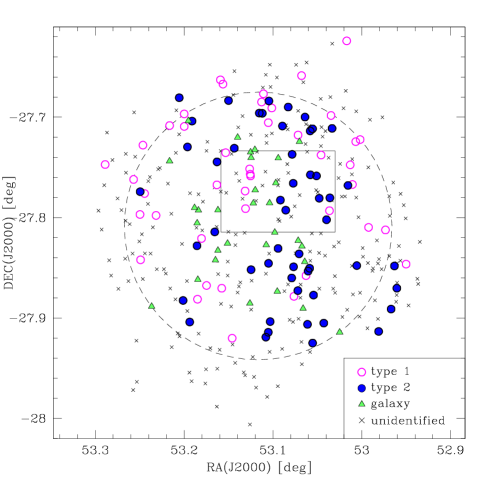
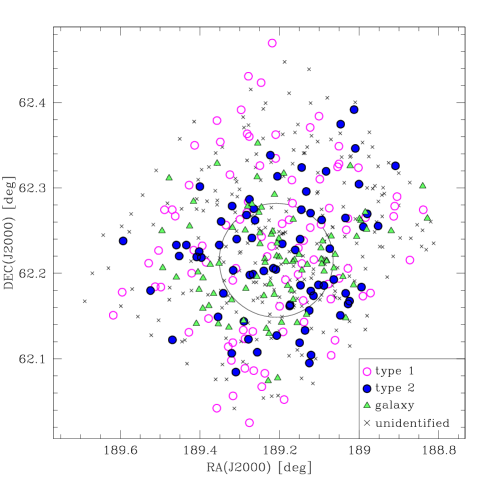
The spatial distributions of the X-ray sources in the CDFS and CDFN as a function of their spectroscopic classification are shown in Fig 7 and 8, respectively. As it is evident in Fig 8, most of the CDFN galaxies are found in the center of the field, where the X-ray sensitivity is highest. When applying the above classification scheme to the 189 CDFN sources with robust redshift measurement detected in the first 1Msec exposure (Brandt et al. brandt01 (2001), Barger et al. barger02 (2002)), we found that, while the number of AGN drops by , the number of galaxies drops by more than a factor of , i.e. from 80 to 37. Then, when accounting for the different spectroscopic completeness, the number of galaxies found in the 1Msec CDFN is in agreement with that found in the CDFS. We also caution the reader that the ratio between type-2 and type-1 AGN one might derive from Table 1 is a lower limit rather than the real ratio in these deep X-ray fields: first of all, the optical identifications are largely incomplete and the fraction of type-2 AGN is expected to be higher among unidentified sources, which are on average harder than those already identified (we indeed verified that in both fields the type-2/type-1 ratio increases towards faint R magnitudes); second, the number of obscured sources misclassified as type-1, as defined on the basis of the here adopted classification, is likely to be higher than the number of unobscured sources misclassified as type-2. This can be seen for example in Fig. 9 of Tozzi et al. (tozzi01 (2001)) where it is shown how the observed hardness ratio decreases with redshift for a given value of the obscuring column density . In Gilli et al. (gilli03 (2003)) we classified an X-ray source as AGN with slightly different criteria from those adopted here. In particular, we considered to be AGN those sources satisfying at least one of the following conditions: erg s-1, , , where is the observed 0.5-10 keV luminosity and is the ratio between the 0.5-10 keV flux and the R band flux (see Section 4.1 of Gilli et al. 2003 for details). We verified that the two classification criteria provide very similar results. Indeed, of the sources classified as AGN by one method are also classified as AGN by the other.
4 The spatial correlation function
4.1 Analysis techniques
The most widely used statistics to measure the clustering properties of a source population is the two point correlation function , defined as the excess probability of finding a pair with one object in the volume and the other in the volume , separated by a comoving distance (Peebles 1980):
| (1) |
A related quantity, which is what we actually measure in this paper, is the so-called projected correlation function:
| (2) |
where is the two point correlation function expressed in terms of the separations perpendicular () and parallel () to the line of sight as defined in Davis & Peebles (dp83 (1983)) and applied to comoving coordinates. The advantage of using the integral quantity rather than directly estimating the two point correlation function in redshift space is that is not sensitive to distortions introduced on small scales by peculiar velocities and errors on redshift measurements.
If the real space correlation function can be approximated by a powerlaw of the form and then the following relation holds (Peebles peeb80 (1980)):
| (3) |
where and is the Euler’s Gamma function. increases from 3.68 when to 7.96 when .
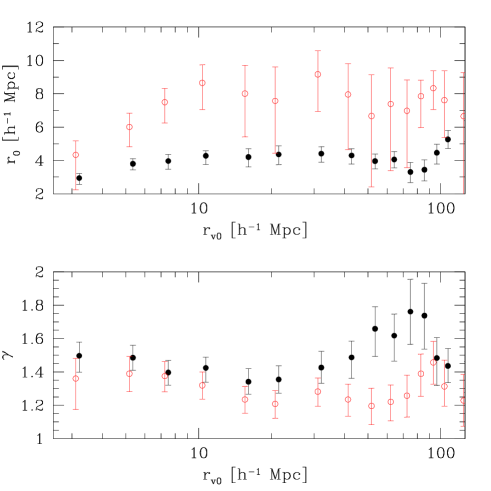
A practical integration limit has to be chosen in Eq. 2 in order to maximize the correlation signal. Indeed, one should avoid too large values which would mainly add noise to the estimate of . On the other hand too small scales, comparable with the redshift uncertainties and with the pairwise velocity dispersions, (i.e. the dispersion in the distribution of the relative velocities of source pairs), should also be avoided since they would not allow to recover the whole signal. A redshift uncertainty of (the typical value observed in our samples) corresponds to comoving scales below Mpc at all redshifts. The average velocity dispersion measured by Cohen et al. (cohen00 (2000)) for the redshift spikes observed in the Hubble Deep and Flanking fields is of the order of 400 km , corresponding to at . At these redshifts the pairwise velocity dispersion should be of the same order. Indeed, the value measured in the local Universe ( km ; Marzke et al. marzke95 (1995), Zehavi et al. zehavi02 (2002)) is expected to decrease by at a redshift of 0.7 (see e.g. the CDM simulations by Kauffmann et al. kauff99 (1999)). We further checked that the velocity dispersion measured for the redshift structures of X-ray sources in the CDFS and CDFN corresponds typically to Mpc. To search for the best integration radius we measured for the CDFS and CDFN total samples for different values ranging from 3 to Mpc. The obtained correlation length and slope as a function of are shown in Fig. 9. We note that decreases for values smaller than Mpc, showing that the signal is not fully recovered. For values greater than Mpc does not vary significantly, but the errorbars are higher. This behaviour, which is more evident for the CDFS sample, is similar to that observed by Carlberg et al. (carl00 (2000)) for the galaxies in the CNOC2 sample (Yee et al. yee00 (2000)). The slope of the correlation is rather constant over most of the range. For the CDFN sample a steepening of is observed at Mpc. However, at these large radii, the errors are large and the measured slope is consistent within with the value obtained for Mpc. We therefore consider the observed steepening as a fluctuation which is not statistically significant and in the following we will fix to Mpc.
To measure we created random samples of sources in our fields and measured the excess of pairs at separations with respect to the random distribution. We used the minimum variance estimator proposed by Landy & Szalay (1993), which is found to have a nearly Poissonian variance:
| (4) |
where DD, DR and RR are the number of data-data, data-random and random-random pairs at separations and , and , where and are the total number of sources in the data and random sample, respectively.
Both the redshift and the coordinate distributions of the identified sources are potentially affected by observational biases. In particular, the redshift distribution may be biased by the presence of a limiting magnitude beyond which spectroscopic redshifts can not be obtained. The distribution, on the other hand, is affected by at least two biases: the X-ray bias, due to the non-uniform X-ray sensitivity limits over the field of view, and the spectroscopic bias, due to the positioning of the masks within the field and of the slits within the masks. For this reason special care has to be taken in creating the sample of random sources. The redshifts of these sources were randomly extracted from a smoothed distribution of the observed one. This procedure should include in the redshift selection function the same biases affecting the observed distribution. We assumed a Gaussian smoothing length as a good compromise between too small smoothing scales (which suffer from significant fluctuations due to the observed spikes) and too large scales (where on the contrary the source density of the smoothed distribution at a given redshift might be not a good estimate of the average observed value). We verified that our results do not change significantly when using a smoothing length in the range . The smoothed redshift distributions adopted for our simulations, shown in Fig. 3 and 4 for the CDFS and CDFN, respectively, have very similar shapes peaking at . We assumed that the clustering amplitude is constant with redshift and did not try to estimate clustering variations at different redshifts. Indeed, the clustering signal in a given redshift interval will strongly depend on small variations in the choice of the interval boundaries, which might include or exclude prominent redshift spikes from the interval, hence producing extremely high fluctuations in the vs. measurements. Since the X-ray sensitivity varies across the field of view, in particular with off-axis angle, we checked if there are significant differences in the redshift distribution of sources as a function of their off-axis angles. In particular we compared the distributions of sources inside and outside a given off-axis angle with a Kolmogorov-Smirnov (hereafter KS) test. We repeated the KS test for several source subsamples (e.g. AGN, galaxies) in the CDFS and CDFN and for different off-axis angles. With the exception of the galaxies in the CDFN, for which the average redshift at off-axis angles below 4 arcmin is found to be significantly higher than that outside this region, we do not find any significant difference in the other subsamples. In the following we will then generate the redshift distribution for the random samples by simply smoothing the total distribution observed in each subsample. The case of CDFN galaxies will be discussed in detail in Section 4.2.2.
The coordinates () of the random sources were extracted from the coordinate ensemble of the real sample, thus reproducing on the random sample the same uneven distribution on the plane of the sky of the real sources (e.g. in both the CDFS and CDFN the X-ray sources were identified preferentially at the center of the field). This procedure, if anything, would dilute the correlation signal, since it removes the effects of angular clustering. We note however that we do not expect a strong signal from angular clustering in these deep pencil-beam surveys, where the radial coordinate spans a much broader distance than the transverse coordinate and the clustering signal should be dominated by redshift clustering (see the tests with random coordinates in the next section).
The source density adopted in the random samples is a factor of 50-100 larger than that of the data sample depending on its size. More details on the chosen way to construct the random source sample, as well as several checks on its validity will be discussed in the next Section.
We binned the source pairs in interval of =0.4 and measured in each bin. The resulting datapoints were then fitted by a power law of the form given in Eq. 3, and the best fit parameters and were determined via minimization. Given the small number of pairs which fall into some bins (especially at the smallest scales), we used the formulae of Gehrels (gehre86 (1986)) to estimate the 84% confidence upper and lower limits, containing the 68% confidence interval (i.e. errorbars in Gaussian statistics). It is well known that Poisson errorbars underestimate the uncertainties on the correlation function when source pairs are not independent, i.e. if the considered objects generally appear in more than one pair. In the samples considered here, this is indeed the case at scales Mpc. On the other hand, bootstrap resampling techniques (e.g. Mo, Jing & Börner mo92 (1992)), which are often used to circumvent this problem, may substantially overestimate the real uncertainties. We tested bootstrap errors for our samples, finding that the uncertainties on the correlation function parameters increase by a factor of with respect to the Poissonian case. In the following we will simply quote and together with their Poisson errors, bearing in mind that the most likely uncertainty lay between the quoted number and its double.
4.2 Results
4.2.1 CDFS
We first considered the correlation function of all CDFS sources regardless of their classification. We excluded from the sample only stars and extended X-ray sources associated to galaxy groups/clusters. In addition we excluded from our calculations 3 low luminosity sources with erg s-1, in which the X-ray emission might be due to a single off-nuclear Ultra Luminous X-ray source in the host galaxy (ULX, see e.g. Fabbiano 1989) rather than to the global star formation rate or to the active nucleus. We note that Hornschemeier et al. (horn04 (2004)) found 10 ULX candidates, all of them with erg s-1, in the combined CDFS + CDFN sample covered by the GOODS survey. Although ULX likely do not represent the whole source population below erg s-1, we nevertheless prefer to apply this luminosity cut since only a few sources are lost and the considered sample should be cleaner. Overall, we are left with a sample of 124 sources.
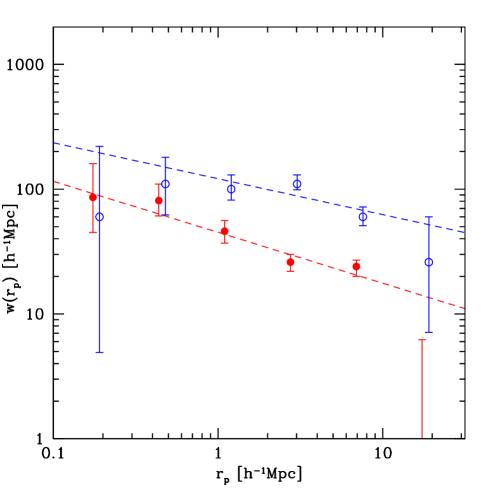
The correlation function was measured in the redshift range (median redshift ) and on scales Mpc. Here and in the following samples a power law fit is found to be an adequate representation of the data. For the total CDFS sample we obtained a fully acceptable value of . The best fit correlation length is Mpc. The slope of the correlation, , is flatter than that commonly observed for optically selected AGN and galaxies (, e.g. Le Fevre et al. 1996; Croom et al. 2001). Based on the error on from this two-parameters fit, we conservatively estimate the clustering signal to be detected at the level. We verified that projected separations above Mpc correspond to angular separations above 5 arcsec for sources in the considered redshift range. Although the FWHM of the Chandra Point Spread Function degrades with off-axis angle, it is still smaller than this value within 8 arcmin from the center of the field, where of our X-ray sources reside. Therefore, at the considered projected scales we do not expect any strong bias against pairs with small angular separations, which may artificially flatten the observed correlation slope. In addition we checked if there is any bias against close pairs because e.g. of the constraints on the slit positioning on the masks used for optical spectroscopy. At any given separation we then computed the ratio between the number of pairs in which both sources have robust spectroscopic redshift and the total number of pairs at the same angular separation. In fact, this ratio is rather constant, decreasing by only at our smallest angular scales below arcsec: this has some effects only at the smallest bins (at , the median redshift of our sample, 20 arcsec correspond to Mpc) where the clustering signal has large uncertainties. Therefore no significant effects on the overall best fit value are expected. The projected correlation function of the total CDFS sample is shown in Fig. 10.
We checked how much these results depend on the choice of the random control sample. In particular we have relaxed the assumption of placing the random sources at the coordinates of the real sources, which might remove some signal due to angular clustering. As said above it is not appropriate to randomly distribute the control sources in the full field of view, since i) the X-ray sensitivity decreases from the center to the outskirts of the field, and ii) the masks used for optical spectroscopy have been placed preferentially in the center of the field. As a first check we limited our analysis to the 110 sources within a circle with a radius of 8 arcmin from the center, where the optical coverage is highest and the X-ray exposure map is constant within across most of the field, with the exception a few narrow stripes with lower sensitivity due to the gaps among ACIS-I CCDs (see e.g. Fig. 3 of Giacconi et al. 2002). Accordingly, the sources of the control sample were randomly placed within this 8 arcmin circle. The best fit correlation length and slope measured for this CDFS subsample were found to be Mpc and , in excellent agreement with the previously quoted values. We can therefore estimate that the suppression in the clustering amplitude produced by the use of the real coordinates is only of the order of a few percent.
As a further, more refined, check we created a probability distribution map for the random sources, where the probability of finding a source at a given position is proportional to the number of real sources with measured redshift around that position. The map was obtained by repeatedly smoothing the distribution of real sources on the sky with a 20 arcsec boxcar (5 iterations). Random sources were then placed in the field according to the created probability map. This approach has the advantage of fully accounting for observational biases, avoiding at the same time the removal of angular clustering from the measured signal. Even in this case we found a high correlation length and a flat slope ( Mpc; ), in agreement with the above derived values. In the light of these checks, in the following we will then simply place the random sources at the coordinates of the real sources, considering for each AGN or galaxy subsample the positions of the sources in that subsample.
Prompted by previous claims (Yang et al. yang03 (2003)), we checked if there is any difference in the clustering properties of soft and hard X-ray selected sources. The best fit parameters obtained for the 109 soft X-ray selected sources are Mpc and , while for the 97 hard selected sources we obtained Mpc and . Since the correlation length and slope are correlated, and large uncertainties arise from the limited size of the samples, we fixed to a common value to best evaluate any possible difference in the clustering amplitude. When fixing to 1.3, we found Mpc for the soft sample and Mpc for the hard sample, which therefore appears to be only marginally more clustered. 333For consistency with the other subsamples considered in this paper, we quote in Table 2 the values obtained by fixing the slope to rather than to . Results are essentially unchanged.
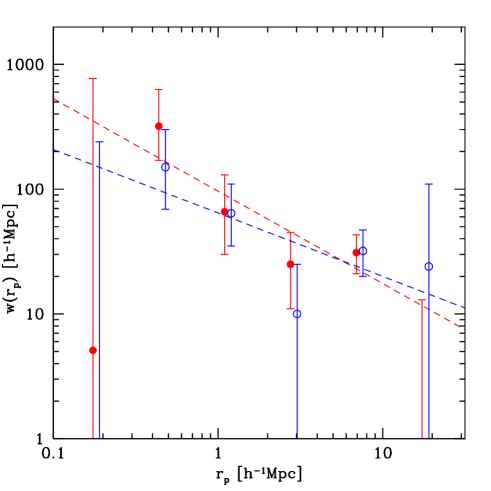
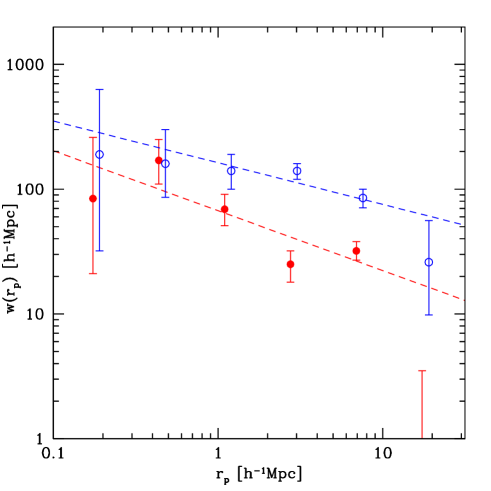
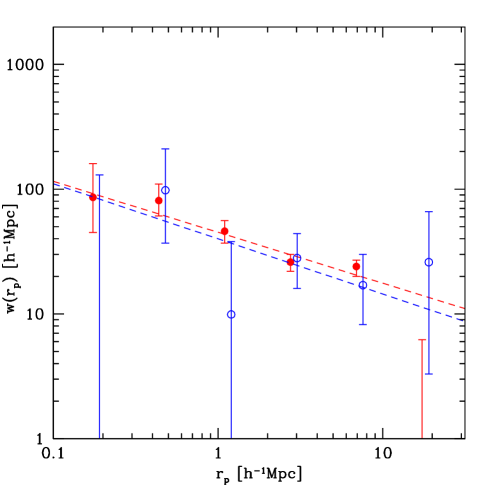
We then considered only the 97 sources classified as AGN finding best fit values ( Mpc, ) similar to those observed in the total sample (as it could be expected since AGN represent the vast majority of the identified sources). The AGN correlation function is shown in Fig. 11. Furthermore, we separated the total AGN sample into type 1 and type 2 AGN (45 and 52 objects, respectively) according to the classification diagram of Section 3, without finding significant differences in their clustering properties (see Table 2). Because of the low statistics (only 27 objects) we cannot put significant constraints to the galaxy correlation function.
Given the large errors introduced by low statistics, we fixed the slope of the correlation function to to search for any difference in the values among different populations. The adopted value is consistent with the average slopes measured in the CDFS and in the CDFN. As expected, the values measured for the various subsamples agree with those already obtained by assuming as a free parameter, but have smaller errors. A summary of the measurements performed in this Section is given in Table 2. We finally checked our results by fixing the slope of the correlation to which is the value commonly observed in galaxy samples at low redshifts (Davis & Peebles dp83 (1983), Carlberg et al. carl00 (2000)): while the fit is significantly worse, the best fit values increase by only 15%.
| Sample | N | |||||
| [ Mpc] | [ Mpc] | |||||
| 1Msec CDFS | ||||||
| Total | 124 | 0.73 | 43.0 | |||
| Soft X-ray selected | 109 | 0.73 | 43.0 | |||
| Hard X-ray selected | 97 | 0.75 | 43.3 | |||
| AGN | 97 | 0.84 | 43.2 | |||
| type 1 | 45 | 1.03 | 43.6 | |||
| type 2 | 52 | 0.73 | 42.8 | |||
| galaxies | 27 | 0.44 | 41.0 | … | … | … |
| 2Msec CDFN | ||||||
| Total | 240 | 0.84 | 42.4 | |||
| Soft X-ray selected | 228 | 0.84 | 42.5 | |||
| Hard X-ray selected | 149 | 0.90 | 43.0 | |||
| AGN | 160 | 0.96 | 43.0 | |||
| type 1 | 89 | 1.02 | 43.5 | |||
| type 2 | 71 | 0.87 | 42.7 | |||
| galaxies | 80 | 0.45 | 41.3 | |||
4.2.2 CDFN
Most of the considerations made for the CDFS sample are also valid for the CDFN sample. In particular a similar uneven distribution on the field of the identified sources can be noticed in Fig. 8, so we kept placing the sources of the random sample at the coordinates of the real sources.
We first measured the correlation length for all the CDFN sources excluding from our sample only objects with erg s-1 (i.e. possible ULX), leaving a final sample of 240 sources. Although no detailed information on the fraction of extended sources is given in Alexander et al. (alex03 (2003)), the detection procedure adopted for the 2Msec CDFN data should be optimized for point-like sources. In Alexander et al. (alex03 (2003)) it is indeed mentioned that only a few sources are likely to be really extended; their presence in the considered sample should therefore not affect significantly our results.
We used again the redshift range since only two sources are beyond . The best fit parameters of the correlation function, measured at a median redshift are Mpc and . Based on the error on , the clustering signal is then detected at the level. While the slope is similar to that found in the CDFS, the clustering amplitude is significantly smaller. The projected correlation function of the total CDFN sample is shown in Fig. 10, where it is also compared with that obtained for the total CDFS sample.
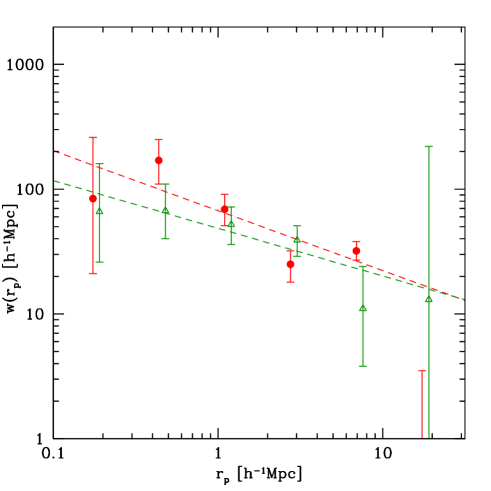
Also in the CDFN we verified that the results do not change significantly when limiting the calculation to the sources within 8 arcmin from the center (80% of the full sample) and placing the control sources randomly within this area. Also in this field the clustering properties of various subsamples are consistent with each other like for example those of soft and hard X-ray selected sources (228 and 149 objects in the two subsamples, respectively), and those of AGN (160 objects) and galaxies (80 objects). The best fit clustering parameters for the various samples are quoted in Table 2. The projected correlation function of CDFN AGN is compared with that of CDFS AGN in Fig. 11 and with that of CDFN galaxies in Fig. 12.
As mentioned in Section 4.1, the average redshift of CDFN galaxies seems to be higher in the center of the field than in the outer regions. By means of a KS test we verified that the redshift distributions of galaxies within and beyond 4 arcmin from the center (38 and 42 objects, respectively) differ at level. To check the possible effects on the measured correlation function, we generated a first random sample by only considering the positions and redshift distribution of the inner sources and a second random sample by considering only the redshifts and coordinates of the outer sources, and we finally pasted the two samples into one. In this way, the outer sources of the random sample have on average lower redshifts than the inner sources, as observed in the real sample. The galaxy correlation function measured using this refined random sample is found to be in excellent agreement with the previous measurement.
Finally, we searched for any possible difference in the clustering properties of type 1 AGN (89 objects) and type 2 AGN (71 objects). Although type 1s seem to have a higher best fit correlation length and a steeper slope than type 2s ( Mpc and vs Mpc and ), the two subsamples agree within the errors (Fig. 13).
Again, we checked our results by fixing to 1.4. Although the have now smaller errors, we did not find any additional difference in the clustering properties of the various source populations. Finally, we checked our results by fixing the correlation slope to finding that the measured values increase by as also seen in the CDFS. A summary of the measurements performed in this Section is given in Table 2.
5 Discussion
5.1 The variance of the clustering amplitude
The X-ray exposure in the CDFN is twice that in the CDFS. It is therefore possible, in principle, that different populations with different clustering properties are being sampled in the two fields at the respective limiting fluxes. Indeed, as it can be easily seen in Table 2, the median luminosity for the total source populations of the CDFN is lower than that of the CDFS. This effect is primarily due to the raise of the galaxy population at very faint X-ray fluxes (see Fig. 1 and Section 3). The median luminosities for the AGN samples are nonetheless very similar in the CDFS and in the CDFN. We performed a test by measuring the correlation function only for the CDFN sources already detected in the first Msec catalog (Brandt et al. brandt01 (2001)), which should guarantee an equal X-ray depth for the CDFS and CDFN samples. For the sample of 189 1Msec CDFN sources with robust spectroscopic redshift we found essentially the same correlation length and slope found in the total 2Msec CDFN sample. Therefore, the variance in between the CDFS and the CDFN cannot be ascribed to the different depth of the X-ray observations. We note that the redshift selection function obtained for the 1Msec CDFN is almost identical to that obtained for the CDFS.
Also, as shown in Section 2, no systematic differences appear in the follow-up programs of optical spectroscopy, with optically faint source being equally observed in both fields. As assessed by a KS test, the R magnitude distributions for the sources in our two samples (i.e. those with robust redshift measurements, Fig. 2) are indistinguishable, although there is a marginal hint that the fraction of sources with is slightly higher in the CDFS than in the 2Msec CDFN ( and , respectively). When considering the R magnitudes of the CDFN sources in the 1Msec catalog, these are distributed as in the CDFS (again checked with a KS test) and the fraction of faint () sources is identical to that of the CDFS. Therefore, the variance in the clustering amplitude cannot be explained by differences in the optical spectroscopy depth. As a final – perhaps redundant – test, it has been directly checked that the clustering amplitude in the two fields does not vary when considering only sources with .
In addition, we checked the R-K colors of our sources. In both fields AGN are on average redder than galaxies. Indeed, AGN follow galaxy color tracks (see Szokoly et al. 2004 and Barger et al. 2003) but lay at higher redshifts than galaxies, where galaxy tracks are redder. This can be understood by considering that, since the majority of the AGN have low luminosities and are in many cases obscured, the optical light is dominated by the contribution of the host galaxy. When comparing the R-K color distribution of the sources in the CDFS and in the CDFN we observed a very similar shape. This, combined with the uncertainties in the R-K color determination, does not allow us to remark any possible difference between the two fields.
We note that about 1/3 of the identified CDFS sources lay within the two prominent spikes at and . In the CDFN, although several redshifts spikes are observed, there are no such prominent structures. The two most populated spikes in the CDFN (at and ) indeed contain only about 1/8 of the total identified sources. As a check we measured the projected correlation function for the total CDFS sample excluding the sources in the two redshift spikes at and , finding Mpc and ( Mpc when fixing to 1.4) in good agreement with the values measured for the total CDFN sample (see Fig. 14). We can therefore conclude that most of the extra-clustering signal in the CDFS is due to these two structures. We also verified that in the CDFN the clustering amplitude and slope do not change significantly when removing the two most populated spikes at and .
We should also investigate if the observed variance might be induced by the high spectroscopic incompleteness of the CDFN and CDFS samples. When looking at the photometric redshifts (e.g. Zheng et al. 2004, Barger et al. 2003), it can be easily shown that unidentified objects lay on average at higher redshifts than spectroscopically identified objects. The median redshift for the unidentified CDFS sources (including photo-z and low quality spectro-z) is indeed 1.15 (1.40 when considering photo-z only), to be compared with 0.73, the median redshift of the sources with high quality spectra. In the CDFN the median redshift for unidentified sources is 1.17 (1.23 when considering only photo-z), to be compared with the median value of 0.84 for the sources already identified. One of the most prominent redshift spikes in the CDFN is at z=1.02 (see Fig. 4), while the most prominent structures in the CDFS are at . One might then speculate that the CDFN spike at z=1.02 is more incomplete than the CDFS spikes. Since at it is difficult to identify sources with weak optical emission lines or sources with absorption line dominated spectra, these should be the main population missing from the spectroscopic samples. In the CDFS, where the information on the optical spectra and classification is fully available, we verified that the best fit parameters of the correlation function do not vary significantly when excluding from the sample sources with absorption line dominated spectra or only weak emission lines. Therefore, spectroscopic incompleteness does not seem a viable argument to explain the different clustering amplitude between the CDFS and CDFN, which is rather due to genuine cosmic variance. We note that large field to field variance might indicate a strong clustering level, whose “real” amplitude can be assessed only with several measurements on independent fields. In principle, the likelihood of obtaining a given value for X-ray selected AGN in deep-pencil beam surveys could be estimated by sampling several times a cosmological volume obtained from N-body simulations, like e.g. the “Hubble Volume Simulations” by the Virgo Consortium (see Frenk et al. 2000 and references therein). Unfortunately, this method requires several assumptions on AGN formation and evolution within dark matter halos and needs careful and extensive tests to evaluate all the possible effects on the clustering amplitude of the considered objects. Such an analysis is beyond the scope of this paper and will be the subject of future work.
An easier task, instead, is to see if the reported differences in the number counts of the Chandra Deep Fields (e.g. Yang et al. yang03 (2003), Bauer et al. bauer04 (2004)) are consistent with the fluctuations produced by the correlation lengths Mpc that we measure. Very recently Bauer et al. (bauer04 (2004)) have revisited the logN-logS relations in the CDFS and CDFN finding general agreement between the two fields, the maximum discrepancy (significant at the level) being for hard sources at the faintest fluxes ( cgs; see their Fig. 5). Since we are considering sources detected at the same limiting flux, the difference in the observed surface density corresponds to a volume density difference of the same entity. The expected cosmic variance in a given volume as a function of the amplitude and slope of the correlation function can be estimated using Eq. 3 of Somerville et al. (some04 (2004)), which is a rearrangement of Eq. 60.3 by Peebles (peeb80 (1980)). Within comoving effective volumes as those surveyed by each Chandra Deep Field ( Mpc3) and for a correlation slope , the expected cosmic variance is 30% and 50% for Mpc and Mpc, respectively. Therefore, we conclude that the reported differences in the number counts between the CDFS and the CDFN are fully consistent with the correlation lengths measured in this paper.
5.2 Comparison with clustering of other X-ray samples
Despite several efforts in the past years, only recently it has been possible to directly measure the spatial clustering of X-ray selected AGN. Carrera et al. (carrera98 (1998)) found only a detection in the ROSAT International X-ray Optical Survey (RIXOS, Mason et al. 2000) on scales Mpc. Interestingly, the signal detected in the RIXOS refers to the subsample of sources in the redshift range 0.5–1.0, where the biggest structures in the CDFN and CDFS are also detected. The lack of clustering signal at and might be due to the small volume sampled and to the falling sensitivity of the RIXOS, respectively. More recently, Mullis et al. (mullis04 (2004)) have measured the spatial correlation function of soft X-ray selected AGN in the ROSAT NEP survey (their clustering detection is at the level). Using the same cosmology adopted here, they found a correlation length of Mpc ( fixed to 1.8) for source pairs at a median redshift and in the scale range Mpc. Also, when accounting for the different cosmology adopted here, the correlation length of the RASS sources at a median redshift , measured by Akylas et al. (akylas00 (2000)) through angular clustering and Limber’s equation, should be increased to Mpc 444At the average comoving separations in the dominated cosmology adopted here are larger by with respect to the Einstein - De Sitter cosmology adopted by Akylas et al. (2000).. The correlation lengths measured at lower redshifts in the NEP and RASS surveys are intermediate values between those observed in the CDFS and in the CDFN. We stress that the comparison between the Chandra Msec surveys and the NEP and RASS survey should be done with the due care since they are sampling different luminosity regimes, and AGN clustering is expected to be a function of luminosity if this correlates with the mass of the dark halo in which the AGN resides (e.g. Kauffmann & Haenelt kauff02 (2002)). The median 0.5-10 keV luminosity of the NEP AGN (converted from the 0.5-2 keV luminosity by assuming a spectrum with photon index 2) is indeed log, i.e. times higher than the median luminosity in the CDFS and CDFN. The above consideration remarks how the Chandra Msec surveys are sampling a population of AGN with rather low luminosities, for which no information on clustering at was available so far. Another possible warning is that we are comparing the soft X-ray selected AGN in the NEP and in the RASS with the CDFS and CDFN AGN, which were selected both in the soft and hard band. However we did not observe any significant difference in the clustering properties of soft and hard X-ray selected AGN within each field. In Fig. 15 we show the correlation length of X-ray selected AGN in the above mentioned surveys as a function of redshift. Due to the variance in measured in the CDFS and CDFN, no conclusion can be drawn on the evolution (if any) of the clustering amplitude with redshift.

5.3 Comparison with clustering of optically selected QSOs
The best constraints on the clustering of optically selected QSOs have been derived from the 2dF QSO Redshift Survey (2QZ, Croom et al. 2001). Based on a sample of objects Croom et al. (croom01 (2001)) measured a QSO correlation length and slope of Mpc and at a median redshift of and on scales Mpc comoving (using the same cosmology adopted here). In addition, thanks to the large number of QSOs in their sample, Croom et al. (croom01 (2001)) were also able to investigate the QSO clustering in different redshift slices. The correlation length measured in their two lowest bins, at a median redshift comparable with that of CDFS and CDFN AGN, is of the order of Mpc (for a fixed slope of ), which is comparable with the correlation length measured for the CDFN AGN. Again, a fully meaningful comparison is hampered by the different luminosity regimes sampled by the 2QZ and the Chandra Msec surveys. Assuming a standard QSO SED (Elvis et al. 1994), the characteristic absolute magnitude of 2QZ QSOs at , (derived from the 2QZ luminosity function of Croom et al. 2004), can be converted into an X-ray luminosity of log, well above the average values of CDFN and CDFS AGN. In the local Universe the clustering of optical QSO has been recently measured by Grazian et al. (grazi04 (2004)) by means of the Asiago-ESO/RASS QSO survey (AERQS) which selects the most rare and luminous objects with mag. These Authors measured a rather high correlation length of Mpc at a median redshift of and on scales Mpc comoving (again for a fixed slope of ). The average 0.5-10 keV luminosity of their QSO sample can be estimated to be log. The AERQS and the 2QZ data have been compared with QSO clustering evolution models (Matarrese et al. mata97 (1997), Moscardini et al. mosc98 (1998)) based on the Press-Schechter formalism for the evolution of the dark matter halo mass function. In fact, Grazian et al. (grazi04 (2004)) and Croom et al. (croom01 (2001)) derive a minimum mass for the dark matter halos where QSO reside of . Due to the present large uncertainties it is not yet possible to put significant constraints to clustering evolution models with X-ray selected AGN. We just note here that clustering of X-ray AGN is consistent with models with if the low value measured in the CDFN is typical at . On the other hand, if the value measured in the CDFS has to be considered as typical, then can be as high as .
5.4 Comparison with galaxy clustering
Gilli et al. (gilli03 (2003)) found that about of the high significance peaks seen in the redshift distribution of K-band selected sources in a sub-area of the CDFS (the area covered by the K20 survey, see Fig. 7; Cimatti et al. 2002), have a corresponding peak in the X-rays. This implies that X-ray and K-band selected sources are tracing the same underlying structures. Also, it might be speculated from these samples that AGN clustering is similar to that of early type galaxies, whose detection rate is higher in K-band rather than in optically selected samples. The measurements of the spatial correlation function for the AGN in the CDFS seem to be in agreement with this idea, since the measured AGN correlation length is found to be similar to that of Extremely Red Objects with (EROs) at , which are thought to be the progenitors of early type galaxies (Daddi et al. daddi01 (2001)). Such a high clustering amplitude is however not observed for the AGN in the 2Msec CDFN, for which is of the order of Mpc. If we then consider the AGN correlation length to be in the range 5-10 Mpc, this is still consistent with AGN at to be generally hosted by early type galaxies. Indeed Coil et al. (2003) have recently measured the correlation length of a sample of R-band selected galaxies at in the DEEP2 survey. With these good statistics they were able to obtain an accurate measure of the correlation function of early-type and late-type galaxies separately (the latter being more numerous by a factor of ), finding Mpc for early type galaxies and Mpc for late type galaxies. Interestingly enough, on scales of Mpc, i.e. very similar to those adopted in this paper, the slope of the correlation function for early-type galaxies is found to be rather flat, , in agreement with that measured for the AGN in the CDFS and in the CDFN (note however that Guzzo et al. (guzzo07 (1997)) found for local early type galaxies). On the contrary the correlation slope for late-type galaxies is found to be significantly steeper (). To summarize, our results are consistent with the idea that at the population of AGN with typical X-ray luminosity of erg s-1 is preferentially hosted by early-type galaxies. However, other deep X-ray pointings in separate fields are needed to measure the average clustering of X-ray selected AGN and get more stringent results.
6 Conclusions and future work
We have measured the projected correlation function of X-ray selected AGN and galaxies in the 2Msec Chandra Deep Field North and in the 1Msec Chandra Deep Field South on scales Mpc. A significantly different amplitude for AGN clustering has been observed in these deg2 fields, the correlation length measured in the CDFS being a factor of higher than in the CDFN. The observed difference does not seem to be produced by any observational bias, and is therefore likely due to cosmic variance. In both fields the slope of the correlation function is found to be flat (), but consistent within the errors with that measured for optically selected QSO (Croom et al. croom01 (2001)). The extra correlation signal present in the CDFS is primarily due to the two prominent spikes at and containing about 1/3 of the identified sources. Indeed, although significant redshifts spikes are also observed in the CDFN, they are less prominent than those observed in the CDFS. In the CDFN we were also able to measure the clustering properties of X-ray selected galaxies, which have been found to be similar to those of AGN in the same field. Finally, within each field, we did not find significant differences between the clustering properties of hard X-ray selected and soft X-ray selected sources, or, similarly, between type-1 and type-2 AGN.
Significant improvements in the measurements of the AGN spatial correlation function and then in the understanding of the large scale structures in the X-ray sky is expected from the on going observations of the Extended Chandra Deep Field South (E-CDFS, PI N. Brandt) and of the COSMOS-XMM field (PI G. Hasinger). The E-CDFS is a deep-and-wide survey consisting of 4 Chandra 250 ksec ACIS-I pointings arranged in a square centered on the Msec CDFS. The final covered area will be deg2, i.e. a factor of 3 higher than that covered by the Msec CDFS, with average sensitivities of erg cm-2 s-1 in the soft band and erg cm-2 s-1 in the hard band. This will allow to significantly enlarge the sample and reduce statistical uncertainties introduced by the small CDFS field of view in the measurements of the clustering of Seyfert-like AGN with average log erg s-1. A detailed study of clustering of high-luminosity X-ray selected AGN will be instead performed by the wide area COSMOS-XMM survey, consisting of a mosaic of 25 XMM short pointings (32 ksec each) covering a total 2.2 deg2 field with a sensitivity of erg cm-2 s-1 in the soft band and erg cm-2 s-1 in the hard band. The two projects are complementary and should constrain the clustering properties of X-ray selected AGN as a function of redshift and luminosity.
Acknowledgements.
We warmly thank Chris Mullis for useful discussions and for sharing with us his results in advance of publication. The anonymous referee is acknowledged for providing several comments which improved the presentation of this work. RG acknowledges support from the Italian Space Agency (ASI) under grant I/R/057/02.References
- (1) Alexander, D.M., Bauer, F.E., Brandt, W.N., et al. 2003, AJ, 126, 539
- (2) Akylas, A., Georgantopoulos, I., Plionis, M. 2000, MNRAS, 318, 1036
- (3) Arnouts, S., Vandame, B., Benoist, C., et al. 2001, A&A, 379, 740
- (4) Boyle, B.J., & Mo, H.J. 1993, MNRAS, 260, 925
- (5) Boyle, B. J., Shanks, T., Georgantopoulos, I., Stewart, G. C., Griffiths, R. E. 1994, MNRAS, 271, 639
- (6) Barger, A.J., Cowie, L.L., Brandt, W.N., Capak, P., Garmire, G.P., Hornschemeier, A.E., Steffen, A.T., Wehner, E.H. 2002, AJ, 124, 1839
- (7) Barger, A.J., Cowie, L.L., Capak, P., et al. 2003, AJ, 126, 632
- (8) Basilakos, S., et al. 2004, ApJ, 607, L79
- (9) Bauer, F.E., Alexander, D.M., Brandt, W.N., et al. 2004, AJ, in press (astro-ph/0408001)
- (10) Brandt, W.N., Alexander, D.M., Hornschemeier, A.E., et al. 2001, AJ, 122, 2810
- (11) Carlberg, R.G., et al. 2000, ApJ, 542, 57
- (12) Carrera F.J., Barcons, X., Fabian, A.C., Hasinger, G., Mason, K.O., McMahon, R.G., Mittaz, J.P.D., Page, M.J. 1998, MNRAS, 299
- (13) Cimatti, A., Mignoli, M., Daddi, E., et al. 2002, A&A, 392, 395
- (14) Cohen, J.G., Hogg, D.W., Blandford, R., et al. 2000, ApJ, 538, 29
- (15) Coil, A.L., et al. 2003, ApJ, 609, 525
- (16) Comastri, A., Setti, G., Zamorani, G., Hasinger, G. 1995, A&A, 296, 1
- (17) Cowie, L.L., Barger, A.J., Hu, E.M., Capak., P., Songaila, A. 2004, AJ, 2004, 127, 3137
- (18) Croom, S.M., Shanks, T., Boyle, B.J., Smith, R.J., Miller, L., Loaring, N.S., Hoyle, F. 2001, MNRAS, 325, 483
- (19) Croom, S.M., et al. 2004, MNRAS, 349, 1397
- (20) Daddi, E., et al. 2001, A&A, 376, 825
- (21) Davis, M., & Peebles, P.J.E. 1983, ApJ, 267, 465
- (22) Elvis, M. et al. 1994, ApJS, 95, 1
- (23) Fabbiano, G., 1989, ARA&A, 27, 87
- (24) Frenk, C.S., Colberg, J.M., Couchman, H.M.P. et al. 2000, astro-ph/0007362
- (25) Gehrels, N. 1986, ApJ, 303, 336
- (26) Georgantopoulos, I., & Shanks, T. 1994, MNRAS, 271, 773
- (27) Giacconi, R., Rosati, P., Tozzi, P., Nonino, M., Hasinger, G., Norman, C., Bergeron, J., Borgani, S., Gilli, R., Gilmozzi, R. & Zheng, W. 2001, ApJ, 551, 624
- (28) Giacconi, R., Zirm, A., Wang, J., Rosati, P., Nonino, M., Tozzi, P., Gilli, R., Mainieri, V., Hasinger, G., Kewley, L., Bergeron, J., Borgani, S., Gilmozzi, R., Grogin, N., Koekemoer, A., Schreier, E., Zheng, W., Norman, C. 2002, ApJS, 139, 369
- (29) Gilli, R., Salvati, M., & Hasinger, G. 2001, A&A, 366, 407
- (30) Gilli, R., Cimatti, A, Daddi, E., et al. 2003, ApJ, 592, 721
- (31) Gioia, I., Henry, J.P., Mullis, C.R., et al. 2003, ApJS, 149, 29
- (32) Grazian, A., Negrello, M., Moscardini, L., et al. 2004, AJ, 127, 592
- (33) Guzzo, L., Strauss, M.A., Fisher, K.B., Giovanelli, R., Haynes, M.P. 1997, ApJ, 489, 37
- (34) Hartwick, F.D.A. & Schade, D. 1990, ARA&A, 28, 437
- (35) Hasinger, G. in the Proceedings of “The Restless High Energy Universe”, Nucl. Physics B. Suppl. Series, E.P.J. Van den Heuvel, J.J.M. in’t Zand, and R.A.M.J. Wijers (Eds.) (astro-ph/0310804)
- (36) Hornschemeier, A.E., Alexander, D.A., Bauer, F.E., et al. 2004, ApJ, 600, L147
- (37) Kauffmann, G., et al. 1999, MNRAS, 307, 529
- (38) Kauffmann, G., & Haehnelt, M.G. 2002, MNRAS, 332, 529
- (39) La Franca, F., Andreani, P., & Cristiani, S., 1998, ApJ, 497, 529
- (40) Landy, S.D., & Szalay, A.S. 1993, ApJ, 412, 64
- (41) Le Fevre, O., Hudon, D., Lilly, S. J., Crampton, David, Hammer, F., Tresse, L. 1996, ApJ, 461, 534
- (42) Magliocchietti, M., Maddox, S.J., Hawkins, E., et al. 2004, MNRAS, 350, 1485
- (43) Martini, P., & Weinberg, D.H. 2001, ApJ, 547, 12
- (44) Marzke, R.O., Geller, M.J., Da Costa, L.N., Huchra, J.P. 1995, AJ, 110, 477
- (45) Mason, K. O., Carrera, F. J., Hasinger, G., et al. 2000, MNRAS, 311, 456
- (46) Matarrese, S., et al. 1997, MNRAS, 286, 115
- (47) Mo, H.J., Jing, Y.P., & Börner, G. 1992, ApJ, 392, 452
- (48) Moscardini, L., et al. 1998, MNRAS, 299, 95
- (49) Mullis, C.R. 2001, Ph.D. thesis, University of Hawaii
- (50) Mullis, C.R., Henry, J.P., Gioia, I.M., et al. 2004, ApJ, in press (astro-ph/0408304)
- (51) Osmer, P.S., 1981, ApJ, 247, 762
- (52) Peebles, P.J.E. 1980, The Large Scale Structure of the Universe (Princeton: Princeton Univ. Press)
- (53) Ratcliffe, A., Shanks, T., Parker, Q.A., Fong, R. 1998, MNRAS, 296, 173
- (54) Rosati, P., Giacconi, R., Gilli, R., Hasinger, G., Kewley, L., Mainieri, V., Nonino, M., Norman, C., Szokoly, G., Wang, J. X., Zirm, A., Bergeron, J., Borgani, S., Gilmozzi, R., Grogin, N., Koekemoer, A., Schreier, E., Zheng, W. 2002, ApJ, 566, 667
- (55) Shanks, T., Fong, R., Boyle, B.J., Peterson, B.A. 1987, MNRAS, 277, 739
- (56) Somerville, R.S., Lee, K., Ferguson, H.C., et al. 2004, ApJ, 600, L171
- (57) Stocke, John T., Morris, Simon L., Gioia, I. M., Maccacaro, T., Schild, R., Wolter, A., Fleming, Thomas A., Henry, J. P. 1991, ApJS, 76, 813
- (58) Szokoly, G., Bergeron, J., Hasinger, G., et al. 2004, ApJS, in press (astro-ph/0312324)
- (59) Tozzi, P., Rosati, P., Nonino, M., Bergeron, J., Borgani, S., Gilli, R., Gilmozzi, G., Hasinger, G., Grogin, N., Kellerman, K., Kewley, L., Koekemoer, A., Norman, C., Schreier, E., Shaver, P., Wang, J.X., Zheng, W., Zirm, A. & Giacconi, R. 2001, ApJ, 562, 42
- (60) Tucker, D. L., Oemler, A., Jr., Kirshner, R. P., et al. 1997, MNRAS, 285, L5
- (61) Ueda, Y., Akiyama, M., Ohta, K., Miyaji, T. 2003, ApJ, 598, 886
- (62) Vikhlinin, A., Forman, W. 1995, ApJ, 455, L109
- (63) Voges, W., et al. 1999, A&A, 349, 389
- (64) Williams, R.E., et al. 1996, AJ, 112. 1335
- (65) Wirth, G.D., Willmer, C.N.A., Amico, P., et al. 2004, AJ, 127, 3121
- (66) Yang, Y., Mushotzky, R. F., Barger, A. J., Cowie, L. L., Sanders, D. B., Steffen, A. T. 2003, ApJ, 585, L85
- (67) Yee, H.K.C., et al. 2000, ApJS, 130, 258
- (68) Zehavi, I., Blanton, M.R., Frieman, J.A., et al. 2002, ApJ, 571, 172
- (69) Zheng, W., et al. 2004, ApJS, in press (astro-ph/0406482)