A Million-Second Chandra View of Cassiopeia A
Abstract
We introduce a million-second observation of the supernova remnant Cassiopeia A with the Chandra X-ray Observatory. The bipolar structure of the Si-rich ejecta (NE jet and SW counterpart) is clearly evident in the new images, and their chemical similarity is confirmed by their spectra. These are most likely due to jets of ejecta as opposed to cavities in the circumstellar medium, since we can reject simple models for the latter. The properties of these jets and the Fe-rich ejecta will provide clues to the explosion of Cas A.
Subject headings:
stars:supernovae—ISM:supernova remnants—X-rays:ISM—X-rays:individual (Cassiopeia A)1. Introduction
The young core-collapse supernova remnant Cassiopeia A is a unique astrophysical laboratory for studying ejecta and shocks in remnants because of its brightness across the electromagnetic spectrum and its well-constrained age and distance. Earlier X-ray observations with the Chandra Observatory have already produced significant results, such as the discovery of the compact stellar remnant (Tananbaum et al. 1999), identification of major types of nucleosynthesis products (Hughes et al. 2000, Laming & Hwang 2003, Hwang & Laming 2003), measurement of magnetic fields (Vink & Laming 2003), identification of the forward and reverse shocks (Gotthelf et al. 2001), and measurement of small-scale proper motions (DeLaney et al. 2003, 2004). The remnant is believed to have lost most of its progenitor mass prior to explosion at 4 M⊙ (e.g., Willingale et al. 2003, Chevalier & Oishi 2003, Laming & Hwang 2003).
A 1 Ms observation of Cas A was performed as a Very Large Project (VLP) in Chandra Cycle 5. It was largely motivated by two papers (Laming & Hwang 2003; Hwang & Laming 2003; hereafter LH03 and HL03), which used Chandra’s subarcsecond angular resolution to isolate compact ejecta features in Cas A. Since the reverse shock crosses these knots in a very short time compared to the age of the remnant, the extracted knot spectra can be characterized with a single electron temperature and ionization age. These are then straightforwardly compared to model results to infer details of the ejecta density profile, the explosion asymmetry, and with further modest assumptions, the Lagrangian mass coordinates of ejecta structures. With earlier Chandra observations, individual ejecta knots could not always be isolated when spectra were extracted over several image resolution elements. A 1 Ms exposure allows nearly every pixel of the ACIS CCD image of Cas A to provide a spectrum for fitting. Revisiting the work of LH03 and HL03 with a larger selection of Cas A ejecta knots would be the first full analysis of its kind and a significant effort that is well beyond the scope of this letter. In this introductory paper, we present new images, highlight some results immediately revealed by the deep pointing, and indicate areas of future work where significant findings are expected.
2. Observations and Data Reduction
Cas A was observed for 1 Ms with the backside illuminated S3 chip of the Advanced CCD Imaging Spectrometer (ACIS) on the Chandra Observatory. The first 50 ks segment was completed between 8 and 9 February 2004, with the same pointing, frame time (3.2 s), and roll angle (325∘) as for two earlier 50 ks ACIS observations to facilitate proper motion studies. The remaining 950 ks were executed in eight segments between 14 April and 6 May 2004 with a 3.0 s frame time and no roll angle constraints (the roll angles drifted from 40∘ to 65∘). The aimpoint in the first 50 ks segment (and in the earlier 50 ks observations) is roughly 1.9′ SE of the point source, while it is 2.4′ NE in the remaining segments. Cas A’s high count rate requires the use of only a single CCD chip and accumulation of the data in GRADED mode to avoid telemetry loss. The spectra thus cannot be corrected to reduce the effects of charge transfer inefficiency.
We retain only events with energies from 0.3-10 keV and apply time-dependent gain corrections for the S3 chip. Time segments with background flares were excluded by making consistent count-rate cuts based on the off-source light curve. The filtered data set contained 282 million photons over the 5′ extent of Cas A and had an exposure time of 980 ks.
3. Results
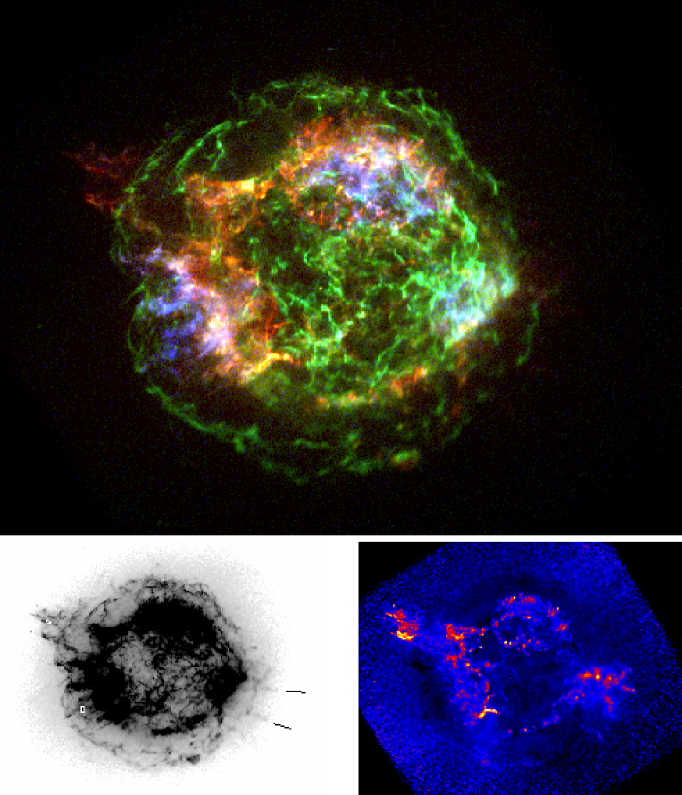
Overview: A three-color composite of Cas A in Si He (1.78-2.0 keV; red), Fe K (6.52-6.95 keV; blue) and 4.2-6.4 keV continuum emission (green) is shown in Figure 1a. The images have not been smoothed nor the continuum contribution removed (i.e., the images contain both line and continuum photons). The figure shows that the filamentary 4-6 keV continuum emission is fragmented, but circular overall, and present throughout the remnant image (see also Gotthelf et al. 2001). Most of this emission is probably synchrotron emission generated at the forward shock. The reverse-shocked ejecta emission, by contrast, is highly non-circular, with the prominent linear jets of Si-rich ejecta (in red) in the northeast (NE), their fainter counterparts to the southwest (SW), and Fe-rich ejecta fingers (in blue) extending to the forward shock in the southeast (see also Hughes et al. 2000, Hwang et al. 2000).
The image revealed several faint point sources around the remnant which matched the positions of optical stars, thereby permitting accurate coordinate transformation of the image relative to the USNO A2.0 catalog. The resulting measured position of the remnant’s central X-ray point source was found to be (J2000) =23h 23m 27.945s0.08s, = 58∘ 48′ 42.45 (see Fesen, Pavlov, & Sanwal 2004, in preparation).
The overexposed broadband image shown in Figure 1b highlights faint features in Cas A, including the jet structures in the NE and SW. An X-ray jet counterpart in the SW had been hinted in earlier Chandra observations (Hwang et al. 2000), but is clearly evident in the new image. It is further highlighted in the ratio image of Si XIII He (plus continuum, 1.78-2.0 keV) relative to the 1.3-1.6 keV band (mostly weak Mg XI and Fe L plus continuum) shown in Figure 1c (see also Vink 2004). The SW jet filaments are fainter, have a larger opening angle on the sky, and do not extend as far inward as their NE counterparts. Though the point source is clearly offset relative to the jets as a whole (Figure 1c), it is well-aligned with the longest NE filament and the lower of two straight SW filaments marked in Figure 1b. A bipolar ejecta structure is already known from optical spectral observations (Fesen 2001) that reveal high-velocity (10,000 km/s) ejecta knots beyond the forward shock in the jet regions, and is now also seen in 24m dust emission (Hines et al. 2004).
The chemical similarity of the jets is demonstrated by their spectra, shown in Figure 2a. Both the spectrum from a filament in the NE jet and the summed spectrum of two SW jet filaments (all at similar radial distance 3.3′ from the compact source) show strong Si, S, Ar, and Ca emission, as well as a Fe K blend. Their thermal characteristics are also similar, with preliminary spectral fits to simple models with an underlying O continuum giving temperatures kT of keV and ionization ages a few times cm-3s. These knots resemble the typical Si/O-rich knots studied by LH03.


In the southeast, where extremely Fe-rich material has been observed, the spectrum of the highly Fe-rich cloud discussed in HL03 is confirmed by the VLP spectrum shown in Figure 2b to be virtually pure Fe. The spectrum is dominated by Fe L and Fe K line blends and Fe continuum. Highly Fe-rich ejecta are sites of complete Si burning in the explosion, and may also harbor some of the 44Ti known to have been synthesized in -rich freeze out (Iyudin et al. 1994, Vink et al. 2001, Vink & Laming 2003). As such, they originated close to the explosion center and are very sensitive to the details of the explosion. HL03 estimate that a few percent of the total Fe ejected by the explosion is currently visible in X-rays, which is similar to the fraction of Ni inferred to have been mixed out into the envelope of SN 1987A by Rayleigh-Taylor instabilities during its explosion (Pinto & Woosley 1988). Identification and modelling of other Fe-rich regions will be the focus of future work, and will offer the best comparisons with theoretical models for Fe-production.
The Nature of the Jets: Jet structures can result from an explosion into local cavities of the interstellar medium formed by asymmetric winds in the late evolutionary phases of the progenitor star (Blondin et al. 1996). However, models of the shock trajectories by Truelove and McKee (1999) as implemented by LH03 (but for lower CSM density), show that the forward shock decelerates very slowly in a local cavity. The reverse shock is thus not strong enough to progress through enough ejecta to yield the relatively high ionization age observed for the plasma in the jet-like region of Cas A. We tentatively conclude that Cas A was formed by an asymmetric explosion that produced jets of ejecta, though more detailed work is required for confirmation. This conclusion is corroborated by the chemical enrichment and high expansion velocities of the optically-emitting jet knots (Fesen 2001). Since the optical ejecta knots are generally accepted as being minimally decelerated by the circumstellar medium, an origin in the explosion mechanism is suggested for the jet knots, which have significantly higher velocities than elsewhere.
Interesting questions then arise as to the nature and energetics of the jets. A jet-induced explosion (e.g. Khokhlov et al. 1999) requires an overdense jet to explode the star and is expected to leave large amounts of Fe ejecta in the jet regions. This contradicts existing X-ray and optical observations of Cas A (e.g. Hughes et al. 2000, Fesen 2001). Furthermore, the kick direction for the compact object that is inferred from the motions of optical knots (Thorstensen et al. 2001) is not along the jet axis as would be expected, but is instead perpendicular to it. Alternatively, an underdense relativistic jet could be driven by a collapsar (see Zhang, Woosley & Heger 2004, Nagataki et al. 2003). In this scenario, the ejecta knots observed in the jet regions could be pulled off at the interface of the jet and ambient ejecta plasma and are unlikely to be Fe-rich. Collapsars are believed to produce super-energetic explosions (i.e., -ray bursts), but estimates of the explosion energy for Cas A by LH03 at erg suggest that it was closer to a normal supernova, and therefore unlikely to have actually produced a -ray burst (Podsiadlowski et al. 2004).
Asymmetries in normal supernova explosions are much milder (Fryer & Heger 2000, Scheck et al. 2004). Whether these explosions can produce the observed asymmetry depends sensitively on the exploding star. Asymmetries are effectively erased if the star retains much of its hydrogen envelope (see Chevalier & Soker 1989 for the case of 1987A). Loss of the hydrogen envelope could allow asymmetries to persist through break-out, and this may explain the jet-like structures in Cas A, since it was much less massive at explosion than the progenitor of SN 1987A. Though these arguments are speculative, we expect to reach much firmer conclusions through spectroscopy of faint jet knots with the VLP data and by coupling hydrodynamics with a treatment of the ionization balance and electron heating.
Point Source: The deep image gives no evidence for an extended pulsar wind nebula surrounding the point source. As ray-tracing simulations confirm, the slightly extended appearance of the point-source image can be explained by the change in the slightly off-axis position of the point source caused by the varying spacecraft roll angle in each individual observation segment.
Detailed analysis of the compact source, including spectra and timing, will be presented in a future paper. Here we simply note that the best single-component model is a blackbody ( for 315 degrees of freedom) for K, an emitting surface with radius km and an absorbing column of . As in previous studies, the temperature is higher than expected from cooling models for a yr old neutron star, and the inferred size of the emitting region is small. Emission from discrete hot spots on the stellar surface may be indicated (Pavlov et al. 2000, Chakrabarty et al. 2001).
4. Conclusions
A new million-second observation of the supernova remnant Cassiopeia A has been obtained with the S3 CCD detector on the Chandra X-ray Observatory. The ejecta have a bipolar structure, implying jets that were formed by the explosion. For such asymmetries to survive beyond the outer layers of the star, the explosion at its source must have an extreme collimation currently only found in hypernova models. Relativistic jets may indeed be indicated by the lack of appreciable Fe in their X-ray spectra, but the total inferred explosion energy for Cas A is closer to that of a normal supernova. Cas A thus provides good evidence that jets may also be produced by normal supernovae.
The Fe ejecta observed elsewhere in the remnant hold clues to the nucleosynthesis that took place during the explosion. Addressing these kinds of questions with detailed modelling and analysis of these data should provide insights into the explosion of Cas A.
References
- Blondin, Lundqvist, & Chevalier (1996) Blondin, J. M., Lundqvist, P., & Chevalier, R. A. 1996, ApJ, 472, 257
- Chakrabarty et al. (2001) Chakrabarty, D., et al. 2001, ApJ, 548, 800
- Chevalier & Soker (1989) Chevalier, R. A., & Soker, N. 1989, ApJ, 341, 867
- DeLaney & Rudnick (2003) DeLaney, T. A., & Rudnick, L. 2003, ApJ, 589, 818
- DeLaney et al (2004) DeLaney, T. A., et al. 2004, ApJL, in press
- Fesen (2001) Fesen, R. A. 2001, ApJS, 133, 161
- Fryer & Heger (2000) Fryer, C. L. & Heger, A. 2000, ApJ, 541, 1033
- Gänsicke et al. (2002) Gänsicke, B. T., Braje, T. M., & Romani, R. W. 2002, A &A, 386, 1001
- Gotthelf et al. (2001) Gotthelf, E. V., Koralesky, B., Rudnick, L., Jones, T. W., Hwang, U., & Petre, R. 2001, ApJ, 552, L39
- Hines et al. (2004) Hines, D. C., et al. 2004, BAAS, 24, 70
- Hughes et al. (2000) Hughes, J. P., Rakowski, C. E., Burrows, D. N., & Slane, P. O. 2000, ApJ, 528, L109
- Hwang, Holt, & Petre (2000) Hwang, U., Holt, S. S., & Petre, R. 2000 ApJ, 537, L119
- Hwang & Laming (2003) Hwang, U., & Laming, J. M. 2003, ApJ, 597, 362
- Iyudin et al. (1994) Iyudin, A. F., et al. 1994, A&A, 284, 1
- Khokhlov et al. (1999) Khokhlov, A., M., Höflich, P. A., Oran, E. .S, Wheeler, J. C., Wang, L., & Chtchelkanova, A. Yu 1999, ApJ, 524, 107L
- Laming & Hwang (2003) Laming, J. M., & Hwang, U. 2003, ApJ, 597, 347
- Nagataki et al. (2003) Nagataki, S., Mizuta, A., Yamada, S., Takabe, H., & Sato, K. 2003, ApJ, 596, 401
- Pavlov et al. (2000) Pavlov, G. G., Zavlin, V. E., Aschenbach, B., Trümper, J., & Sanwal, D. 2000, ApJL, 531, L53
- Pinto & Woosley (1988) Pinto, P. A., & Woosley, S. E. 1988, Nature, 333, 534
- Podsiadlowski et al. (2004) Podsiadowski, Ph., Mazzali, P. A., Nomoto, K., Lazzati, D., & Cappelaro, E. 2004, ApJ, 607, L17
- Scheck et al. (2004) Scheck L., et al. 2004, PRL, 92, 011103
- Thorstensen et al. (2001) Thorstensen, J. R., Fesen, R. A., & van den Bergh, S. 2001, AJ, 122, 297
- Truelove & McKee (1999) Truelove, J. K., & McKee, C. F. 1999, ApJS, 120, 299
- Vink (2004) Vink, J. 2004, NewAR, 48, 61
- Vink et al. (2001) Vink, J., et al. 2001, ApJL, 560, L79
- Vink & Laming (2003) Vink, J., & Laming, J. M. 2003, ApJ, 584, 758
- Zhang et al. (2004) Zhang, W., Woosley, S. E., & Heger, A. 2004, ApJ, 608, 365