1
Type II quasar candidates in the Sloan Digital Sky Survey: evidence for X-ray obscuration
Abstract
Recent X-ray surveys with Chandra and XMM-Newton have found several genuine Type II quasars, the long sought-after population of high-luminosity (high-redshift) Seyfert 2 galaxies, and a sizable number of Type II quasar candidates. However, at present it is hard to know whether the on-going X-ray surveys are providing a reliable and nearly complete census of the Type II quasar population. In order to address this open issue and shed light on the broad-band properties of Type II quasars, we used the sample of 291 high-ionization narrow emission-line AGN at =0.3–0.83 selected from the Sloan Digital Sky Survey by Zakamska et al. (2003). Using archival X-ray information, we were able to place constraints on the X-ray emission of 17 of these objects (three X-ray detections and 14 upper limits). Using the [O iii]5007 line luminosities to predict the intrinsic X-ray power of the AGN, we found that at least 47% of the objects in the observed sample provides evidence for the presence of X-ray absorption (with 1022 cm-2), including the four highest luminosity sources with predicted unobscured luminosities of 1045 erg s-1. For the only source with moderate-quality XMM-Newton spectral data, all of the pieces of the puzzle (2–10 keV luminosity of 4 erg s-1, 1–3 cm-2, and unobscured magnitude 26) assure that this is a genuine Type II quasar.
1 Introduction
Type II quasars, the long sought-after luminous analogs of Seyfert 2 galaxies (i.e., sources with high-ionization, narrow optical emission-line spectra) predicted by Unification models of Active Galactic Nuclei (AGN), represent a key ingredient of many AGN synthesis models for the X-ray background (XRB; e.g., Comastri et al. 2001; Gilli, Salvati & Hasinger 2001). In the X-ray band these objects are expected to be highly luminous ( a few erg s-1) and absorbed by column densities cm-2. Before the advent of Chandra and XMM-Newton, Type II quasars formed quite an elusive class of sources. It was not rare for AGN to be mis-classified as Type II quasars due to either limited spectral coverage or low signal-to-noise ratio optical spectra (see Halpern, Turner & George 1999). X-ray surveys conducted over the last few years have proven to be effective in finding several genuine Type II quasars (i.e., matching both the optical and X-ray definitions; e.g., Norman et al. 2002; Stern et al. 2002; Fiore et al. 2003; Gandhi et al. 2004; Caccianiga et al. 2004; Szokoly et al. 2004) and many more Type II quasar candidates (e.g., Crawford et al. 2001; Mainieri et al. 2002; Barger et al. 2003). Multiwavelength observations of these objects generally support their Type II quasar status. However, some questions regarding Type II quasars still remain without an answer despite the significant progress accomplished by X-ray surveys over the last few years, mainly what is the fraction of genuine Type II quasars among the hard X-ray selected population? At present, less than 20% of the hard X-ray, presumably absorbed sources, have optical counterparts matching the Type II quasar definition (e.g., Barger et al. 2003). However, in many cases the faint optical counterparts of X-ray selected Type II quasar candidates hamper the spectroscopic identification, hence providing further uncertainty on whether or not the census of these objects from X-ray surveys is complete. Thus, the selection of an optically bright sample can complement the information provided by X-ray surveys and shed light on the properties of the Type II quasar population as a whole.
Motivated by these considerations, we have used the sample of 291 high-ionization narrow emission-line AGN at redshift 0.3–0.83 selected by Zakamska et al. (2003, hereafter Z03) from the Sloan Digital Sky Survey (SDSS) spectroscopic data. The sample includes (in almost similar fractions) both Seyfert 2 galaxies and their higher luminosity “cousins”, Type II quasars; although not complete, this catalog represents the only published optically selected sample of Type II quasar candidates in this redshift range. Here we review the main X-ray properties of the SDSS Type II quasar candidates; a detailed analysis is presented by Vignali, Alexander & Comastri (2004).
=70 km s-1 Mpc-1, =0.3, and =0.7 are used throughout the paper.
2 X-ray data
The Z03 catalog of Type II quasar candidates was cross
correlated with archival ROSAT (PSPC, HRI, and ROSAT All Sky Survey, RASS), Chandra, and XMM-Newton observations.
Most of the data presented in the following have been obtained from ROSAT observations, given the larger areal coverage of archival ROSAT fields.
We found reliable X-ray information (a detection or upper limit)
for 17 sources (listed in Table 1 along with the
derived X-ray parameters).
One of these 17 sources was found in an archival XMM-Newton observation, while
none of the Z03 sources lies in archival
Chandra observations.
| Srca | SDSS J | b | c | d | Type IIe | ||
|---|---|---|---|---|---|---|---|
| ID | () | (2–10 keV) | (0.5–2 keV) | Range | QSO | ||
| 34 | 021047.01100152.9 | 0.540 | 9.79 | 45.1 | 6.0–2.0 | ||
| 55 | 023359.93004012.7 | 0.388 | 8.17 | 43.5 | 1.1–9.6 | ||
| 59 | 024309.79000640.3 | 0.414 | 7.95 | 43.3 | 7.0–4.9 | ||
| 68 | 025558.00005954.0 | 0.700 | 8.51 | 43.9 | 0–2.0 | ||
| 70 | 025951.28002301.0 | 0.505 | 8.53 | 43.9 | 0–4.7 | ||
| 130 | 084234.94362503.1 | 0.561 | 10.10 | 45.5 | 8.0–2.3 | ||
| 148 | 090933.51425346.5 | 0.670 | 8.92 | 44.3 | 0 | ||
| 152 | 092014.11453157.3 | 0.402 | 9.04 | 44.4 | 1.3–1.0 | ||
| 174 | 100854.43461300.7 | 0.544 | 8.32 | 43.7 | 0–2.3 | ||
| 188 | 104505.39561118.4 | 0.428 | 9.08 | 44.4 | 8.5–9.5 | ||
| 204 | 122656.48013124.3 | 0.732 | 9.66 | 45.0 | 2.3–1.8 | ||
| f | 44.6 | 7.5–2.0 | |||||
| 208 | 123453.10640510.2 | 0.594 | 8.77 | 44.1 | 0–4.1 | ||
| 209 | 124736.07023110.7 | 0.487 | 8.59 | 43.9 | 0–4.6 | ||
| 212 | 130740.56021455.3 | 0.425 | 8.92 | 44.3 | 0–4.9 | ||
| 239g | 150117.96545518.3 | 0.338 | 9.06 | 44.4 | 0–3.0 | ||
| 256 | 164131.73385840.9 | 0.596 | 9.92 | 45.3 | 6.0–2.1 | ||
| 258 | 165627.28351401.7 | 0.679 | 8.57 | 43.9 | 0–6.2 |
Note — The X-ray detected objects are shown in boldface.
a From Table 1 of Z03. b Logarithm of the predicted 2–10 keV luminosity in units of erg s-1; the relative uncertainty is (i.e., the 1 scatter in the Mulchaey et al. 1994 correlation between the [O iii] line flux and the 2–10 keV flux found for Seyfert 2 galaxies). This correlation has been applied to our data and used to predict the expected 0.5–2 keV flux for each object; see 3 for details. c Galactic absorption-corrected flux (or 3 upper limit) in the observed 0.5–2 keV band, in units of 10-14 . d The range of column densities reported here (in cm-2) has been derived on a source-by-source basis by comparing the predicted 0.5–2 keV fluxes (using the Mulchaey et al. 1994 correlation) with the observed 0.5–2 keV fluxes (or 3 upper limits). For the sources that have not been detected by ROSAT, the column densities should be considered as lower limits (hence the use of “”). For the three X-ray detected sources, the column density range is broadly consistent with the absorption derived from the hardness-ratio analysis using ROSAT data. e indicates the likely absorbed sources with predicted 2–10 keV luminosities erg s-1, i.e., within the Type II quasar locus. f XMM-Newton observation of source #204. The observed 0.5–2 keV flux and de-absorbed 2–10 keV luminosity shown here have been derived directly from X-ray spectral fitting of XMM-Newton data. g Detected in the RASS.
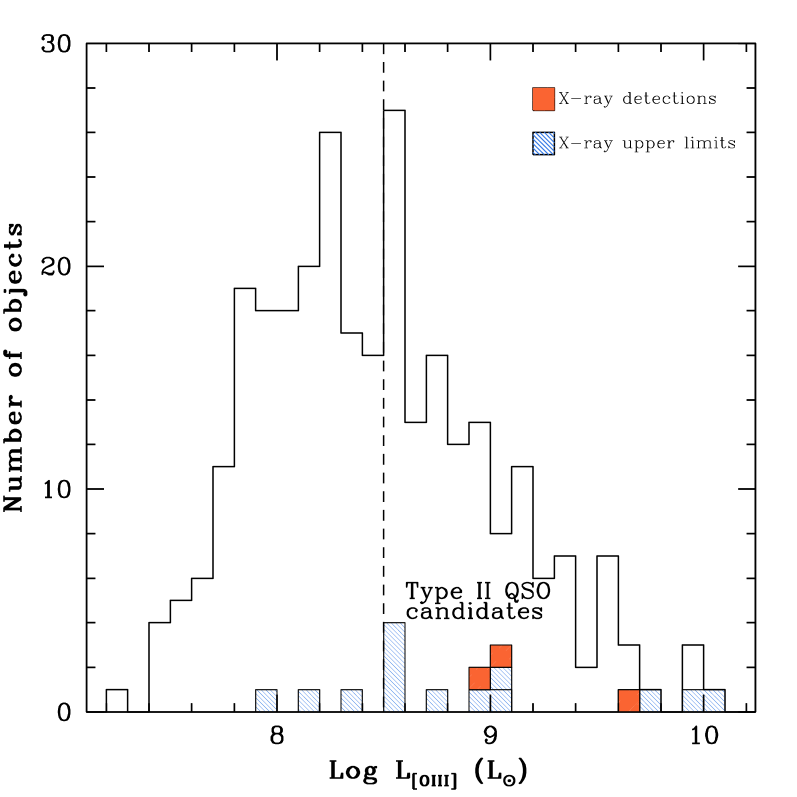
Overall, adopting a detection threshold of 3.2 (3.7) for pointed (RASS) observations and a matching radius of 40′′, three sources of the Z03 sample have significant () X-ray detections with ROSAT (sources #148, #204, and #239). Source #204 was detected also by XMM-Newton and has enough counts for moderate-quality spectral analysis (see 4). The histogram of the [O iii] line luminosities () for all of the sources in the Z03 sample is shown in Fig. 1. Note that 14 of the 17 sources with available X-ray data (filled histograms) have in the range 3 , suggesting unobscured magnitudes of (see Z03 for details). We are also able to provide constraints on the X-ray properties of four of the eight highest luminosity Type II quasar candidates of the Z03 sample (predicted luminosities of 1045 erg s-1; see Fig. 1 and Tab. 1). The identification of such high-luminosity rare obscured quasars allows us to explore a different region of parameter space to that typically probed by X-ray surveys.
3 The X-ray properties of Type II quasar candidates
To derive basic constraints on the X-ray emission of the 17 Type II quasar candidates in our sample, we have used the correlation between the [O iii] flux and the 2–10 keV flux found for Seyfert 2 galaxies by Mulchaey et al. (1994, hereafter M94)adopting the parameterization reported in 3.2 of Collinge & Brandt (2000). Using this approach, for each source we have predicted the expected 2–10 keV flux and errors (on the basis of the 1 scatter in the M94 correlation). The [OIII] line luminosities used in this work are not corrected for the absorption toward the narrow-line region (see Maiolino et al. 1998 for details). This correction would require the measurement of the Balmer decrement, but the redshift range of the Z03 sources and the bandpass of the SDSS spectra (3800–9200 Å) do not provide spectral coverage of the H line for all of the objects. We note that using the uncorrected [OIII] line flux leads to a conservative determination in whether or not a source is absorbed in the X-ray band.
The predicted 2–10 keV fluxes (with their 1 uncertainties) have been converted into soft (0.5–2 keV) X-ray fluxes assuming a power law with photon index =2, which is a relatively good parameterization of the intrinsic X-ray continua of both Type I and Type II AGN (e.g., Nandra & Pounds 1994; Risaliti 2002).
These predicted soft X-ray fluxes have then been compared to the observed soft X-ray fluxes (or the 3 upper limits for the X-ray non-detections; see Table 1). This allows us to estimate on a source-by-source basis the amount of X-ray absorption (listed as a range in Table 1 due to the scatter in the M94 correlation) required to produce the predicted soft X-ray flux. The principal, basic assumption used to derive the X-ray column densities is that these Type II quasar candidates have the same underlying average X-ray continua of local AGN. Clearly, the uncertainties associated with the predicted soft X-ray fluxes (and thus with the derived column densities) are large, mostly due to the scatter in the M94 correlation and partly due to the assumed underlying X-ray spectral slope. Intrinsically flatter X-ray spectral slopes would produce lower column densities (by 20%, if =1.6 instead of 2.0 is adopted), while the presence of an additional soft X-ray component (e.g., thermal emission from the host galaxy, scattering, etc.), often observed in hard X-ray selected sources (e.g., Vignali et al. 2001) would produce the opposite effect. However, within the assumptions adopted in this study, these column densities should be treated as lower limits, since all but three of our sources are not detected in the soft X-ray band.
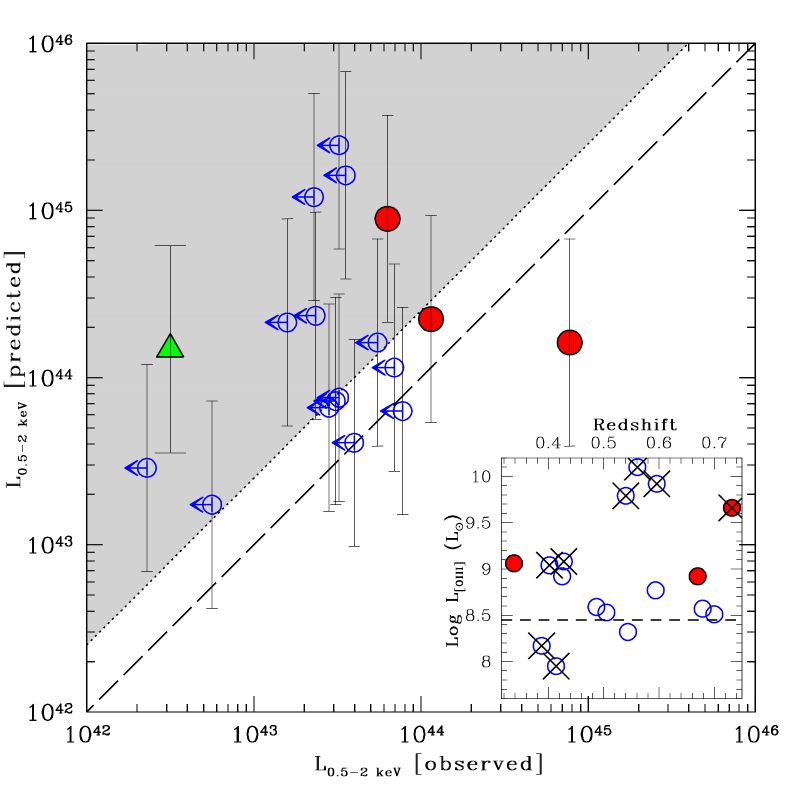
Using the approach described above, we have found that at least 47% (8/17) of the sources with X-ray information indicate the presence of X-ray absorption (see Fig. 2 and Table 1), with column densities typically cm-2 (dotted line in Fig. 2 for a source at =0.5). The predicted 2–10 keV luminosities of six of the eight likely absorbed sources place them in the quasar regime ( erg s-1; see Table 1). Furthermore, the four most luminous sources ( erg s-1; see Table 1) in the sample show evidence for obscuration at X-ray energies. A column density of 1–3 cm-2 was obtained for source #204 through direct X-ray spectral analysis of XMM-Newton data (see 4).
For the 14 X-ray undetected sources we performed a stacking analysis, obtaining an 4 detection (triangle in Fig. 2). Although the statistical relevance of this detection is poor, the comparison of the average flux derived from the stacking analysis (weighted by the exposure time of each observation with respect to the total) with that expected on the basis of the M94 correlation provides an average column density of 1.4–2.7 cm2. Hopefully, tighter constraints will be obtained soon with the scheduled observations of some of the most luminous Type II quasar candidates with Chandra.
4 The X-ray spectrum of a genuine Type II quasar
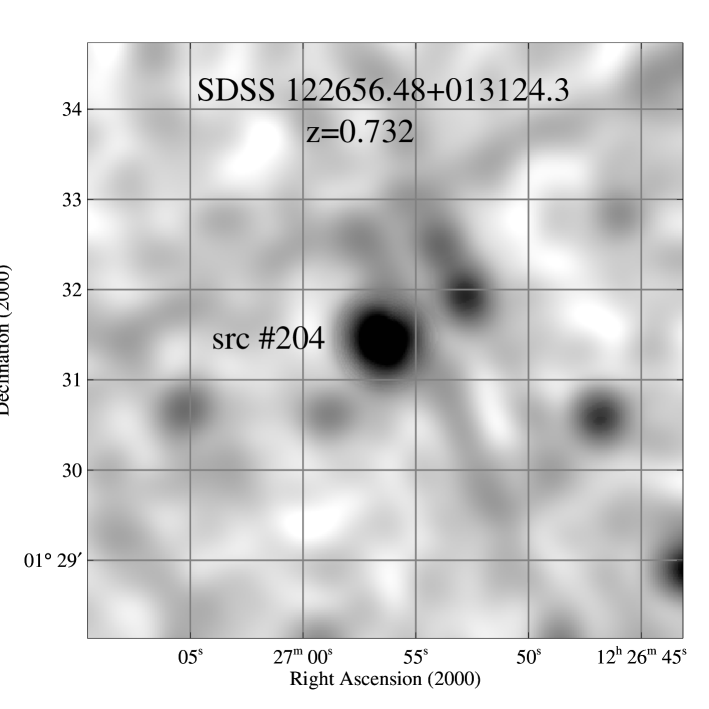
Source #204 (=0.732) has been serendipitously observed and detected by XMM-Newton (see Fig. 3 for the combined pnMOS1MOS2 image), with a total number of counts in the 0.5-10 keV band.
A simple power-law model provides a poor fit to the XMM-Newton data (/d.o.f.=61.2/32); the derived flat photon index (=0.74) suggests the presence of absorption.


If absorption at the source redshift is added to the power-law model, the fit improves significantly (=16); the best-fitting spectrum (shown in Fig. 4, left panel) is parameterized by a photon index =1.30 and a column density =1.26 cm-2. The 68, 90, and 99% confidence contours for the photon index vs. column density are shown in Fig. 4 (right panel). If the photon index is forced to be =1.8–2.0, more representative of the typical AGN intrinsic X-ray emission, becomes 2.2–3.2 cm-2, more consistent with the lower column density boundary derived from ROSAT data (see Table 1). We note, however, that variability in the column density might have occurred between the ROSAT and XMM-Newton observations (over a time-scale of 10 yr). The intrinsic 2–10 keV luminosity (1044.6 erg s-1), the column density ( 1–3 cm-2), the narrow-line optical spectrum (Z03), and the predicted unobscured absolute -band magnitude () are fully consistent with source #204 being a genuine Type II quasar.
5 Summary
We have derived basic X-ray constraints for 17 Type II (high-ionization, narrow emission-line) quasar candidates at =0.3–0.83 selected from the SDSS.
- (a)
-
At least 47% (8/17) of the sources in the present sample indicate the presence of absorption, with column densities cm-2. In particular, there are indications that the four highest luminosity objects ( 1045 erg s-1) are absorbed. The study of such objects is important since it allows the exploration of a different part of parameter space to that typically probed by X-ray surveys.
- (b)
-
X-ray spectral fitting of moderate-quality XMM-Newton data for source #204 provides direct evidence of intrinsic absorption, with a column density of 1–3 cm-2. This result, coupled with the intrinsic 2–10 keV luminosity of 1044.6 erg s-1, the presence of luminous high-ionization and narrow optical lines, and the unobscured magnitude 26 makes this source a genuine Type II quasar at optical and X-ray wavelengths.
Our results complement those obtained recently by Zakamska et al. (2004) on the basis of lower significance RASS data. In particular, Zakamska et al. (2004) noticed that the fraction of SDSS Type I AGN at =0.3–0.8 with a RASS counterpart is much higher than that of SDSS Type II AGN. This result is suggestive of suppression of soft X-rays by cm-2 in the Type II sources.
Investigations of larger samples of SDSS Type II quasars with Chandra and XMM-Newton are clearly required to draw a more accurate and comprehensive picture of the physical properties of this enigmatic class of AGN.
Acknowledgements.
CV and AC acknowledge partial support by the Italian Space agency (contract ASI I/R/057/02) and MIUR (COFIN grant 03-02-23). DMA is supported by the Royal Society. The authors would like to thank L. Angeretti for help in producing the plots.References
- Barger et al. (2003) Barger, A.J., et al. 2003, AJ, 126, 632
- Caccianiga et al. (2004) Caccianiga, A., et al. 2004, A&A, 416, 901
- Collinge & Brandt (2000) Collinge, M.J., & Brandt, W.N. 2000, MNRAS, 317, L35
- Comastri et al. (2001) Comastri, A., Fiore, F., Vignali, C., Matt, G., Perola, G.C., & La Franca, F. 2001, MNRAS, 327, 781
- Crawford et al. (2001) Crawford, C.S., Fabian, A.C., Gandhi, P., Wilman, R.J., & Johnstone R.M. 2001, MNRAS, 324, 427
- Fiore et al. (2003) Fiore, F., et al. 2003, A&A, 409, 79
- Gandhi et al. (2004) Gandhi, P., Crawford, C.S., Fabian, A.C., & Johnstone, R.M. 2004, MNRAS, 348, 529
- Gilli, Salvati & Hasinger (2001) Gilli, R., Salvati, M., & Hasinger, G. 2001, A&A, 366, 407
- Halpern, Turner & George (1999) Halpern, J., Turner, T.J., & George, I.M. 1999, MNRAS, 307, L47
- Mainieri et al. (2002) Mainieri, V., Bergeron, J., Hasinger, G., Lehmann, I., Rosati, P., Schmidt, M., Szokoly, G., & Della Ceca, R. 2002, A&A, 393, 425
- Maiolino et al. (1998) Maiolino, R., Salvati, M., Bassani, L., Dadina, M., Della Ceca, R., Matt, G., Risaliti, G., & Zamorani, G. 1998, A&A, 338, 781
- Mulchaey et al. (1994) Mulchaey, J.S., Koratkar, A., Ward, M.J., Wilson, A.S., Whittle, M., Antonucci, R.R.J., Kinney, A.L., & Hurt, T. 1994, ApJ, 436, 586 (M94)
- Nandra & Pounds (1994) Nandra, K., & Pounds, K.A. 1994, MNRAS, 268, 405
- Norman et al. (2002) Norman, C., et al. 2002, ApJ, 571, 218
- Risaliti (2002) Risaliti, G. 2002, A&A, 386, 379
- Stern et al. (2002) Stern, D., et al. 2002, ApJ, 568, 71
- Szokoly et al. (2004) Szokoly, G.P., et al. 2004, ApJS, in press (astro-ph/0312324)
- Vignali et al. (2001) Vignali, C., Comastri, A., Fiore, F., & La Franca, F. 2001, A&A, 370, 900
- Vignali, Alexander & Comastri (2004) Vignali, C., Alexander, D.M., & Comastri, A. 2004, MNRAS, in press (astro-ph/0407293)
- Zakamska et al. (2003) Zakamska, N.L., et al. 2003, ApJ, 126, 2125 (Z03)
- Zakamska et al. (2004) Zakamska, N.L., Strauss, M.A., Heckman, T.M., Ivezic, Z., & Krolik, J.H. 2004, AJ, 128, 1002