The Third VLBA Calibrator Survey — VCS3
Abstract
This paper presents the third extension to the Very Large Baseline Array (VLBA) Calibrator Survey, containing 360 new sources not previously observed with very long baseline interferometry (VLBI). The survey, based on three 24 hour VLBA observing sessions, fills the areas on the sky above declination where the calibrator density is less than one source within a 4° radius disk at any given direction. The positions were derived from astrometric analysis of the group delays determined at 2.3 and 8.6 GHz frequency bands using the Calc/Solve software package. The VCS3 catalogue of source positions, plots of correlated flux density versus the length of projected baseline, contour plots and fits files of naturally weighted CLEAN images as well as calibrated visibility function files are available on the Web at http://gemini.gsfc.nasa.gov/vcs3
Subject headings:
astrometry — reference frames — astronomical data bases: catalogues — quasars: general — radio continuum: general — reference systems: techniques — interferometric1. Introduction
Catalogues of positions of compact radio sources with the highest precision are the basis for many applications. Among of them are imaging faint radio sources in phase referencing mode, monitoring the Earth’s rotation, space geodesy, and space navigation. The method of VLBI first proposed by Matveenko et al. (1965) allows us to determine positions of sources with nanoradian precision (1 nrad 0.2 mas). The first catalogue of source positions determined with VLBI (Cohen & Shaffer 1971) contained only 35 sources. It is desirable for the above mentioned applications to have many more sources. In 1998 the ICRF catalogue of 667 sources produced by analyzing VLBI observations made in the framework of space geodesy programs was published (Ma et al. 1998). Six years later, the extension of this catalogue, ICRF-Ext2, with 109 more sources, was published (Fey et al. 2004). However, the sky coverage of these catalogues was still not sufficient for some applications. Successful phase referencing requires a calibrator within 4° from the target source with a precise position and known source structure. The probability of finding a calibrator from the ICRF-Ext2 catalogue within 4° of any random target above declination is about 50%. Also, the ICRF catalogue does not provide source maps. In order to overcome these deficiencies, twelve 24 hour observing sessions with the VLBA, called VLBA Calibrator Surveys, were performed. Analysis of these observations produced the VCS1 (Beasley et al. 2002) and VCS2 (Fomalont et al. 2003) catalogues of 1611 new sources not listed in the ICRF catalogue. Approximately 80% of these sources are suitable as phase referencing calibrators and as target sources for space geodesy programs.
Combining all suitable calibrators from the ICRF-Ext2, VCS1 and VCS2 catalogues we get a list of 1986 sources. Over 89.5% of the sky north of declination we find at least one calibrator within a 4° radius disk at any given direction. In this paper we present an extension of the VCS1 and VCS2 catalogues, called the VCS3 catalogue, mainly concentrating on the other 10.5% of the sky where the source density is lowest. Since the observations, calibrations, astrometric solutions and imaging are similar to that of VCS1, most of the details are described by Beasley et al. (2002). In section 2 we describe the strategy for selecting the 450 candidate sources observed in three 24 hour sessions with the VLBA. In section 3 we briefly outline the observations and data analysis. We present the catalogue in section 4, and summarize our results in section 5.
2. Source selection
Having unlimited resources one could try to observe all sources stronger than some limiting flux. However, only sources with bright compact components can be detected with VLBI and might be useful for phase referencing or geodetic applications. Kellermann, Pauliny-Toth, & Davis (1968) first showed that the distribution of sources over spectral index has two peaks: one near (steep spectrum) and another near (flat spectrum). Later, it was confirmed that extended objects dominate in the steep spectrum population (see the review by Kellermann & Owen 1988). In compact regions, which have the synchrotron mechanism of emission, the peak in the spectrum caused by synchrotron self-absorption has frequencies higher than 1 GHz due to their small size. Thus, if a dominating emission comes from compact regions, the spectrum of the total flux density will be predominantly flat or inverted.
Examining spectral indexes of the PKScat90 catalogue (Wright and Otrupcek 1990), which is believed to be complete at the 95% level for sources with flux density Jy at 2.7 GHz (Bolton, Savage, & Wright 1971), we found that only 26% of sources have spectral indexes . Myers et al. (2003) used NVSS (Condon et al. 1998) and GB6 (Gregory et al. 1996) catalogues for selection of sources with spectral indexes at 5 GHz, and they found 11685 sources brighter than 30 mJy, or 24% of the total number of sources. It should be noted that a significant fraction of the sources with spectral index in the range [–0.5, –0.4] belongs to the steep spectrum population and are expected to have extended structure. Thus, taking sources at random, the probability that a source will be compact, and therefore, detectable with VLBI does not exceed 20%. A carefully designed strategy for source selection can significantly increase the yield of detections.
We considered all bright sources at X-band (8.6 GHz) and S-band (2.3 GHz) with spectral indexes greater than as candidates for the VCS3 campaign. In order to find these sources, we first analyzed catalogues of compact flat-spectrum sources: JVAS (Wrobel et al. 1998), CLASS (Myers et al. 2003), Parkes quarter-Jansky catalogue (Jackson et al. 2002), VLA South (Winn, Patnaik, & Wrobel 2003) and selected all sources brighter than 100 mJy at declinations above with arc distances from any known calibrator greater than 3.9°. This produced a list of 374 sources. Not all these catalogues provide flux density at more than one band. We used the CATS database (Verkhodanov et al. 1997) for cross-checking the reported flux density and for acquiring information about flux measurements for these objects from other sources. Unfortunately, most of these measurements were done at different epochs. Since many flat spectrum sources are variable, the estimates of the spectral index made at different epochs may be unreliable. Instantaneous 1–22 GHz broad-band spectra at 4–6 frequencies for 3000 AGN with flux density greater than 100 mJy at 2.3 GHz and , including many sources from this list, were observed with the 600 meter ring radio telescope of the Russian Academy of Sciences RATAN–600 in transit mode (see method of observations and data reduction in Kovalev et al. 1999) as a part of an ongoing survey program. All flat spectrum sources from this sample with flux densities greater than 200 mJy at X and/or S band and not previously observed with VLBI, a total of 116 sources, were included in the VCS3 candidates list. After cross checking we removed sources from the list for which the estimate of the spectral index was either unreliable or less than . The total number of sources selected from these catalogues was 300.
After picking up these 300 sources from all known compact flat-spectrum catalogues we still had areas where the density of calibrators was less than the targeted density. In order to fill these areas we used the NVSS catalogue of about 1.8 million sources (Condon et al. 1998). First, we selected 2704 sources with total flux density greater than 100 mJy at 1.4 GHz in the areas where the distance to the closest calibrator and already selected candidates was greater than 4°. The NVSS catalogue does not provide information about spectral index, so we checked these 2704 sources against the CATS database, which nowadays contains one of the most complete collections of radio catalogues, and found the sources observed under other campaigns at different frequency bands. If they were not found in any other catalogue, for example, they were absent in the GB6 catalogue with flux limit 18 mJy and in the PMN (Wright et al. 1996) catalogue with flux limit 40–70 mJy at 5 GHz, this indicates that with a high probability their spectral index is significantly less than . In total, this initial list had 302 sources.
We examined the spectrum provided by CATS and subjectively ascribed a class to each source:
-
0 —
the source has flat spectrum, and the estimate of the spectral index is reliable (e.g., RATAN–600 instantaneous spectrum is available), and the estimated correlated flux density is greater than 100 mJy;
-
1 —
the estimate of the spectral index is less reliable, or the spectral index is in the range [–0.4, –0.2], and the estimated correlated flux density is greater than 100 mJy;
-
2 —
the estimate of the spectral index is unreliable or in the range of [–0.5, –0.4], and/or the estimated correlated flux density is less than 100 mJy.
Then for each source we computed a score based on angular distance to the closest calibrator, flux density, spectral index and class:
| (1) |
where — angular distance to the closest calibrator or already selected candidate, minimal angular distance (4°), — spectral index, — class, — flux density in Jy extrapolated to 8.6 GHz. An iterative procedure computed the score, selected the source with the largest score and ran again. Using this method we selected 150 sources with the highest scores in addition to the 300 sources previously chosen.
3. Observations and data analysis
The VCS3 observations were carried out in three 24 hour observing sessions with the VLBA on 2004 April 30, 2004 May 08, and 2004 May 27. Since the correlated flux density for selected candidates was expected to be different, we split our sources into three categories:
-
a —
sources of class 0 brighter than 200 mJy;
-
b —
sources of class 0 with flux density in the range 100–200 mJy or sources of class 1 brighter than 200 mJy;
-
c —
all other sources.
Integration time was chosen to be 90 seconds for sources from category a, 180 seconds from category b, and 300 seconds from category c. The sources above ° declination were scheduled for two scans at different hour angles in order to improve the coverage, while the sources in [] declination range were scheduled only for one scan. The target sources were observed in a sequence designed to minimize loss of time from antenna slewing. In addition to the target sources, 77 strong sources were taken from the GSFC astrometric and geodetic catalogue 2004a_astro 111http://gemini.gsfc.nasa.gov/solutions/astro. Observations of 3–4 strong sources from this list were made every 1–1.5 hours during observing sessions. These observations were scheduled in such a way, that at each station at least one of these sources was observed at an elevation angle less than 20°, and at least one at an elevation angle greater than 50°. The purpose of these observations was to provide calibration for mismodelled troposphere path delays and to tie the VCS3 source positions to the ICRF catalogue. On average, the antennas were on-source 70% of the time.
The observations used the VLBA dual-frequency geodetic mode, observing simultaneously at 2.3 GHz and 8.6 GHz. Each band was separated into four 8 MHz channels (IFs) which spanned 140 MHz at 2.3 GHz and 490 MHz at 8.6 GHz, in order to provide precise measurements of group delays for astrometric processing. Since the a priori coordinates of many candidates were expected to have errors of up to 30″, the data were correlated with an accumulation period of 1 second in 64 frequency channels in order to provide extra-wide windows for fringe searching.
Processing of the VLBA correlator output to obtain the astrometric observables was made using the Astronomical Image Processing System (AIPS) (Greisen 1988). First, phases of the calibration signals injected into the receivers were subtracted from the fringe phases for each scan and each channel. Then the phases of a single strong calibrator scan were subtracted from each scan to flatten out the phases across the band of each individual channel. Sampler bias correction together with initial amplitude calibration was performed using the recorded system temperatures and gain tables (tasks “ACCOR” and “APCAL”). Task “FRING” was then run for each baseline separately (with SNR cutoff = 3) to obtain the residual narrow-band group delays for each channel, residual single channel fringe phases, and residual single channel phase delay rates. Task “MBDLY” was then used to compute the residual group delays from the 4 single channel fringe phases at each frequency band. Then task “CL2HF” was used to compute the total group delays, phase delay rates and fringe phases by combining the residuals with the correlator model, and converting them from geocenter to reference station quantities. Finally, the AIPS output was reformatted for input into the Calc/Solve geodetic/astrometric VLBI analysis software package222http://gemini.gsfc.nasa.gov/solve using task “HF2SV”.
The software package Calc/Solve was used for determination of accurate positions of all detected sources. Astrometric analysis was performed in several steps. First, we used narrow-band group delays determined over each 8 MHz wide channel and incoherently averaged separately over all channels within X and S band. Narrow-band group delays are less precise than wide-band group delays, but have very wide ambiguity spacings: 4 mks. In the first step X-band single-band delay data (and S-band data for the sources detected only at S-band) were used for estimation of new source positions and clock functions modeled by second degree polynomials. These position estimates were used in an S-band wide-band group delay solution for short baselines between stations Pietown, Kitt Peak, Owens Valley, Los Alamos and Fort Davis in order to resolve the group delay ambiguities with spacings of 100 ns and then again solve for source positions in the second step. In step three these estimates were used in an S-band group delay solution for longer baselines for further ambiguity resolution. In the fourth step the previous estimates of source positions were used for ambiguity resolution of X-band group delays (with spacings 29 ns) on short baselines, and a new solution was made. These estimates then were used for resolving X-band group delays at long baselines in the next step. In the sixth step ionosphere free combinations of X and S band wide-band group delays were used for data analysis. The estimation model at this step included coefficients of linear splines for clocks of all stations, except a reference station, and troposphere zenith path delays at all sites. The time interval for linear splines was 60 minutes. The data were carefully analyzed for the presence of any remaining errors in group delay ambiguity resolution and for outliers. About 1% of the data were deselected, primarily because the fringe fitting algorithm picked a secondary maximum of the delay resolution function. If only two observations of a source are used in a solution, errors in group delay ambiguity resolution cannot be detected. However, if more observations are used in a solution, errors in group delay ambiguity resolution can result in a significant misfit. Therefore, analysis of observations of sources with numerous misfits allowed us to detect group delay ambiguity resolution errors with at least 3–6 observations. Being conservative, we set a minimum number of 8 observations needed to rule out the possibility of group delay ambiguity resolution errors. After outlier elimination we determined additive baseline-dependent corrections to the a priori weights in such a manner that the ratios of the sums of weighted squares of post-fit residuals to their mathematical expectation were close to unity.
In the final solution all available astrometric and geodetic data from August 1979 to August 2004, including the three VCS3 sessions, were used in a single least square solution. Estimated parameters included positions and velocities of stations, coordinates of all sources, Earth orientation parameters, clock functions and troposphere zenith path delays. The only differences in treatment of the VCS3 sessions with respect to other experiments were that we did not estimate troposphere gradients and the time interval for clocks and troposphere zenith path delays were 60 minutes instead of 20 minutes. Since a few sources were detected in only one band, we made three solutions: using 1) ionosphere free linear combinations of X-band and S-band wide-band group delays, 2) only X-band group delays and 3) only S-band group delays.
Since the equation for time delay is invariant with respect to the group of coordinate transformations, observations themselves do not determine source positions, but only a family of positions. In order to pick a specific element of this family, we imposed boundary conditions by applying net-rotation constraints on the positions of 212 sources listed as “defined” in the ICRF catalogue such that the set of new positions of these 212 sources did not have a net-rotation with respect to the set of old position from the ICRF. More details about this procedure can be found in Beasley et al. (2002).
| Declination | X/S | X-band | S-band | |||||||||
|---|---|---|---|---|---|---|---|---|---|---|---|---|
| zone | # pts | # pts | # pts | |||||||||
| (deg) | (mas) | (mas) | (mas) | (mas) | (mas) | (mas) | ||||||
| ( +20.0, | +90.0 ) | 33 | 0.2 | 0.4 | 96 | 0.6 | 0.5 | 94 | 5.1 | 4.7 | ||
| ( 0.0, | +20.0 ) | 16 | 0.3 | 0.2 | 77 | 0.5 | 0.6 | 77 | 4.2 | 7.2 | ||
| ( –20.0, | 0.0 ) | 11 | 0.2 | 0.3 | 64 | 0.8 | 1.5 | 64 | 7.0 | 16.8 | ||
| ( –30.0, | -20.0 ) | 11 | 0.2 | 0.7 | 44 | 1.2 | 1.8 | 44 | 13.0 | 27.6 | ||
| ( –45.0, | -30.0 ) | 13 | 0.3 | 0.4 | 76 | 2.4 | 7.3 | 75 | 40.0 | 40.0 | ||
In order to evaluate position errors we made a special solution using only the three VCS3 sessions in which we estimated coordinates of all sources and applied no-net-rotation constraints on 20 sources common in the VCS3 and ICRF defining lists. Since 77 sources used in the VCS3 campaign were intensively observed earlier under various geodetic and astrometric programs, we used the differences between very accurate positions derived from analysis of these observations and positions from the VCS3 sessions as a measure of the upper limit of VCS3 catalogue errors. We represent estimates of errors in right ascension () and in declination () of the VCS3 catalogue in the form:
| (4) |
where and stand for the formal uncertainties derived by the errors propagation law from fringe amplitude signal to noise ratios, and are additive reweighting parameters. The multiplicative factor 1.5 in (4), first found by Ryan et al. (1993), accounts for underestimated systematic errors in the computation of uncertainties of wide-band group delays and affects uncertainties of estimates of all parameters from VLBI, including source coordinates. We split the sources into five declination zones, and for each group we found the values of and which made ratios of the weighted sum of squares of residuals to their mathematical expectation close to unity. Using this techniques we computed additive corrections to uncertainties of the estimates of X-band only and S-band only solutions by analyzing the differences between dual band and single band solutions. Reweighting parameters are presented in Table 1. The histogram of source position errors is presented in Figure 1.

For imaging purposes the data were re-processed with the global fringe fitting procedure (task “FRING” ) with SNR cutoff 4 at each individual channel. Global, station-based fringing allows detection of weaker sources than the baseline-based fringing used for astrometric analysis. (We did not use global fringing for astrometric analysis, since as we found earlier, it gives less reliable group delays than baseline-based fringing). A bandpass correction was then determined with the task “BPASS”. After initial editing the fringe amplitude and phases were averaged across the channels. We used the AIPS task “CALIB” in order to perform the first step of the self-calibration procedure applying the point source model. The whole scan length was used to find the combined solution for the channels with the SNR cutoff 3. After that we imported data to the Caltech DIFMAP package (Shepherd 1997). We have adapted the automated procedure originally written by Greg Taylor (Pearson et al. 1994) for self-calibration and imaging of the VCS3 short snapshot observations.
For each detected source at each band, we computed two estimates of correlated flux density: one averaged over the entire image (total CLEAN flux density) and another averaged only over the spatial frequencies at S-band and and at X-band, which corresponds to the range [0.7, 1.0] of the maximum spatial frequencies of the VLBA. The latter estimate characterizes the flux density of unresolved components. Errors of our estimates of total correlated flux density of sources brighter than 100 mJy are determined mainly by the accuracy of amplitude calibration, which for the VLBA, according to Wrobel and Ulvestad (2004), is at the level of 5% at 1–10 GHz. This estimate was confirmed by the comparison of the correlated flux density with the single-dish flux density measured with RATAN–600 in October 2003 for several slowly varying sources without extended structure. The contribution of fringe amplitude errors is significant for sources with flux density mJy. The error of correlated flux density for this group of sources is about 10%. It should be noted that in the case of a source with asymmetric extended structure the estimate of the correlated flux density from unresolved components may be biased due to a significant non-uniformity of coverage at long spacings.
| Source name | J2000.0 Coordinates | Errors (mas) | Correlated flux density (Jy) | ||||||||||
|---|---|---|---|---|---|---|---|---|---|---|---|---|---|
| 8.6 GHz | 2.3 GHz | ||||||||||||
| Class | IVS | IAU | Right ascension | Declination | Corr | # Obs | Total | Unres | Total | Unres | Band | ||
| (1) | (2) | (3) | (4) | (5) | (6) | (7) | (8) | (9) | (10) | (11) | (12) | (13) | (14) |
| C | 0001-120 | J0004-1148 | 00 04 04.914997 | -11 48 58.38564 | 0.24 | 0.40 | -0.069 | 20 | X/S | ||||
| – | 0003+340 | J0006+3422 | 00 06 07.382435 | +34 22 20.41138 | 1.83 | 4.46 | -0.233 | 5 | X | ||||
| C | 0009+655 | J0012+6551 | 00 12 37.671095 | +65 51 10.82363 | 9.21 | 4.00 | 0.040 | 10 | X/S | ||||
| – | 0017+296 | J0019+2956 | 00 19 37.791440 | +29 56 01.93471 | 19.34 | 7.63 | -0.015 | 14 | S | ||||
| – | 0021-084 | J0024-0811 | 00 24 00.672746 | -08 11 10.05397 | 4.75 | 8.88 | -0.124 | 7 | X/S | ||||
| C | 0026-015 | J0029-0113 | 00 29 00.986049 | -01 13 41.76047 | 0.74 | 0.95 | 0.349 | 36 | X/S | ||||
| C | 0027-024 | J0030-0211 | 00 30 31.823755 | -02 11 56.13361 | 0.30 | 0.57 | -0.243 | 68 | X/S | ||||
| C | 0029-147 | J0031-1426 | 00 31 56.411853 | -14 26 19.34670 | 0.93 | 1.60 | -0.607 | 36 | X/S | ||||
| C | 0042+186 | J0044+1855 | 00 44 42.227898 | +18 55 05.03460 | 0.76 | 1.69 | 0.591 | 36 | X/S | ||||
| – | 0042-373 | J0045-3705 | 00 45 12.065955 | -37 05 48.47087 | 3.05 | 7.43 | -0.066 | 20 | X | ||||
| C | 0043+246 | J0046+2456 | 00 46 07.825737 | +24 56 32.52438 | 0.26 | 0.46 | 0.051 | 90 | X/S | ||||
| C | 0046+063 | J0048+0640 | 00 48 58.723150 | +06 40 06.47544 | 0.67 | 1.20 | 0.414 | 28 | X/S | ||||
| C | 0054+161 | J0056+1625 | 00 56 55.294324 | +16 25 13.34088 | 0.33 | 0.29 | 0.019 | 90 | X/S | ||||
| C | 0055+060 | J0058+0620 | 00 58 33.804481 | +06 20 06.07358 | 0.68 | 1.31 | -0.221 | 19 | X/S | ||||
Note. — Table 2 is presented in its entirety in the electronic edition of the Astronomical Journal. A portion is shown here for guidance regarding its form and contents. Units of right ascension are hours, minutes and seconds, units of declination are degrees, minutes and seconds.
In total, 365 out of 450 sources were detected and yielded at least two good points for position determination. However, not all of these sources are suitable as phase referencing calibrators or as targets for geodetic observations. We consider a source suitable as a calibrator if 1) the number of good X/S pairs of observations is 8 or greater in order to rule out the possibility of a group delay ambiguity resolution error; and 2) position error before reweighting is less than 5 mas. We found that usually 8 observations at the VLBA is sufficient to get positions with errors less than 5 mas. If the errors are significantly greater, this means that the source was not detected at long baselines, and therefore, we do not possess information on whether the source can be detected when used as a phase referencing calibrator. Only 231 sources satisfy this calibrator criteria. It should be mentioned that our criterion for suitability a source as a phase calibrator is rather conservative, and sources which fail this criterion may still be useful for some applications.
Five detected sources turned out to be known gravitational lenses. Since the fringe amplitude may have several minima and maxima during integration time for such source, our technique for fringe searching is not applicable. We excluded these gravitational lenses from the analysis, since they are certainly not suitable as calibrators.
4. The VCS3 catalogue
The VCS3 catalogue is listed in Table 2. The first column gives source class: “C” if the source can be used as a calibrator, “–” if it cannot. The second and third columns give IVS source name (B1950 notation), and IAU name (J2000 notation). The fourth and fifth columns give source coordinates at the J2000.0 epoch. Columns /6/ and /7/ give inflated source position uncertainties in right ascension and declination in mas, and column /8/ gives the correlation coefficient between the errors in right ascension and declination. The number of group delays used for position determination is listed in column /9/. The next two columns give the estimates of correlated flux density in Jansky at X-band: total CLEAN flux density (column /10/) and flux density of unresolved components (column /11/). Similar information for S-band is listed in columns /12/ and /13/. For some sources only estimates of the total VLBA flux density are presented, because either no data at long baseline were collected or the data at these baselines were unreliable. Column /14/ gives data type used for position estimation: X/S stands for ionosphere-free linear combination of X and S wide-band group delays; X stands for X-band only group delays; and S stands for S-band only group delays. Some sources which yielded less than 8 pairs of X and S band group delay observables had 2 or more observations at X and/or S band observations. For these sources either X-band or S-band only estimates of coordinates are listed in the VCS3 catalogue, whichever uncertainty is less.
In addition to this table, the html version of this catalogue is posted on the Web at http://gemini.gsfc.nasa.gov/vcs3. For each source it has 8 links: to a pair of postscript maps of the source at X and S-band; to a pair of plots of correlated flux density as a function of the length of the baseline projection to the source plane; to a pair of fits files with naturally weighted CLEAN images; and to a pair of fits files with calibrated data. The coordinates and the plots are also accessible from the NRAO VLBA Calibration Search web-page http://magnolia.nrao.edu/vlba_calib/.


a)


b)
c)


d)
e)
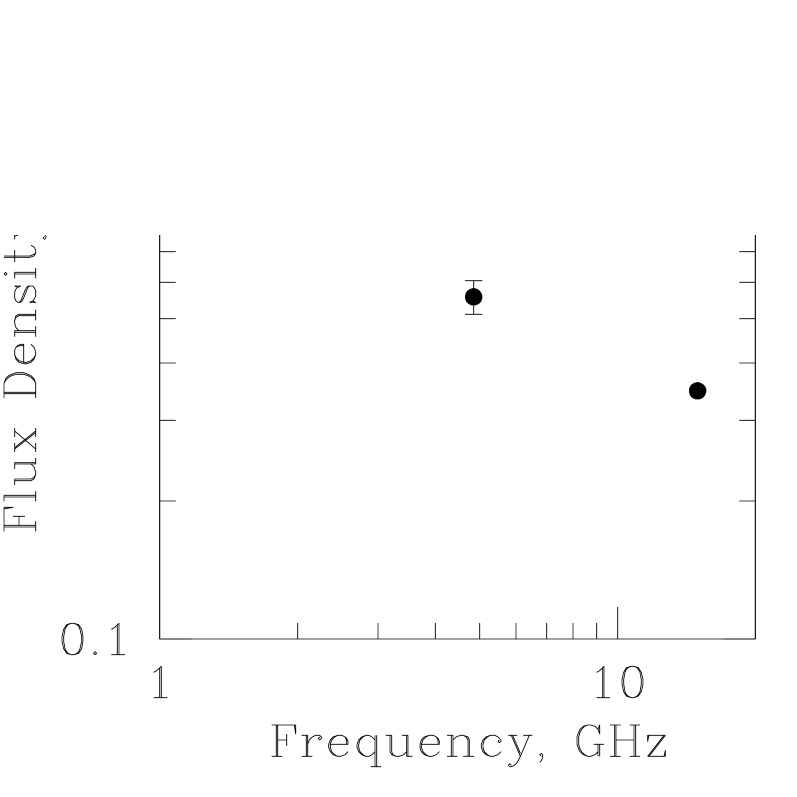
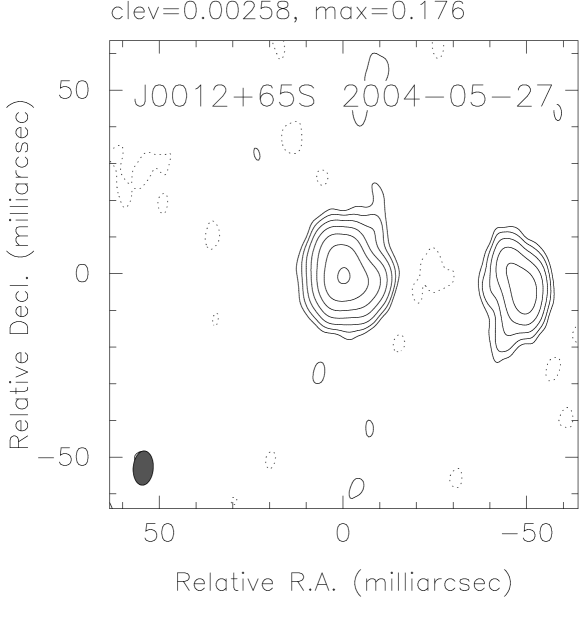
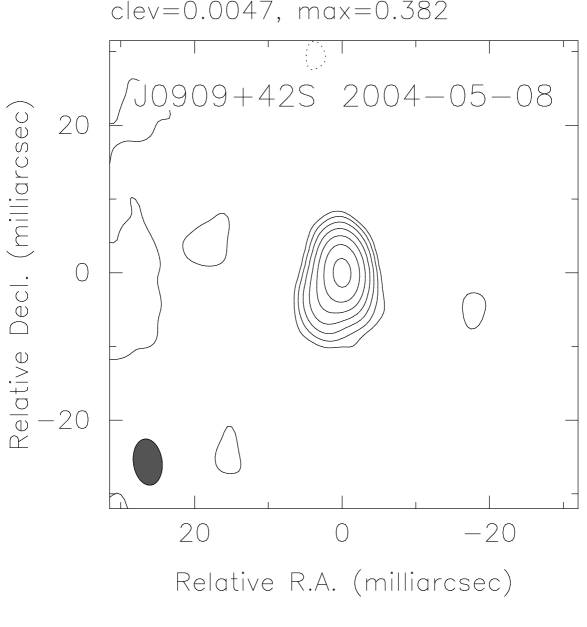
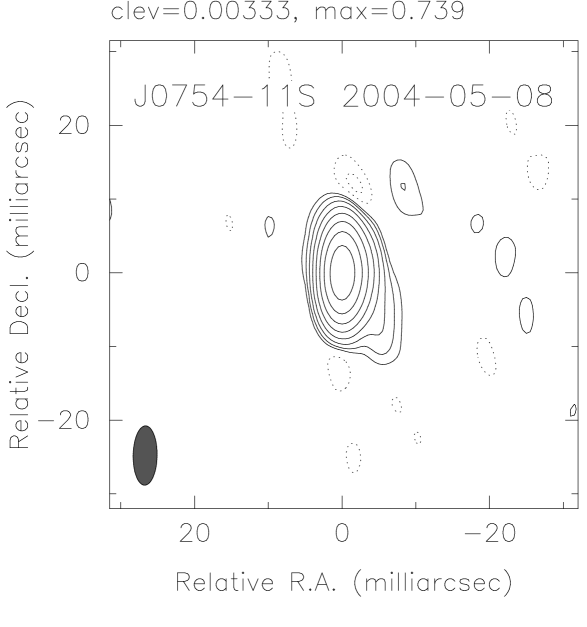
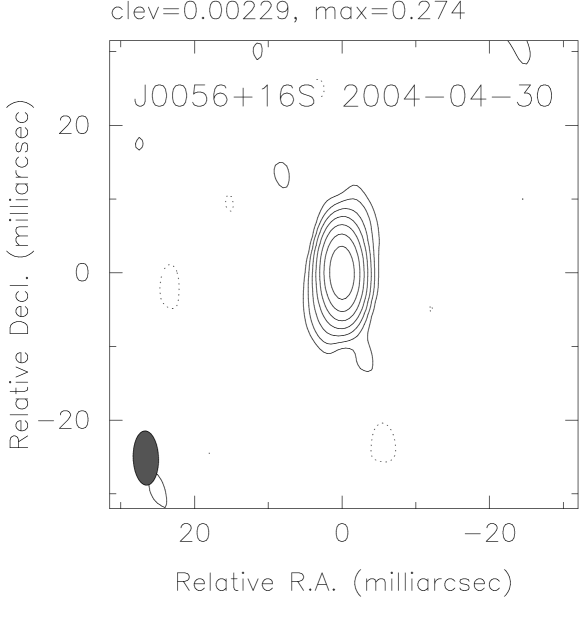
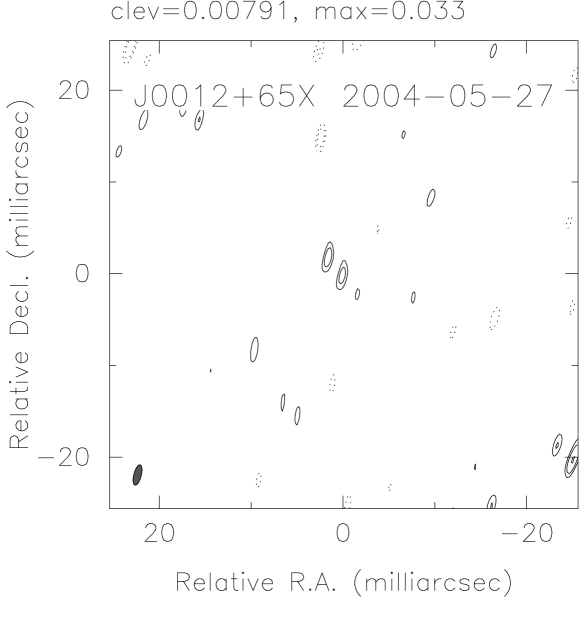
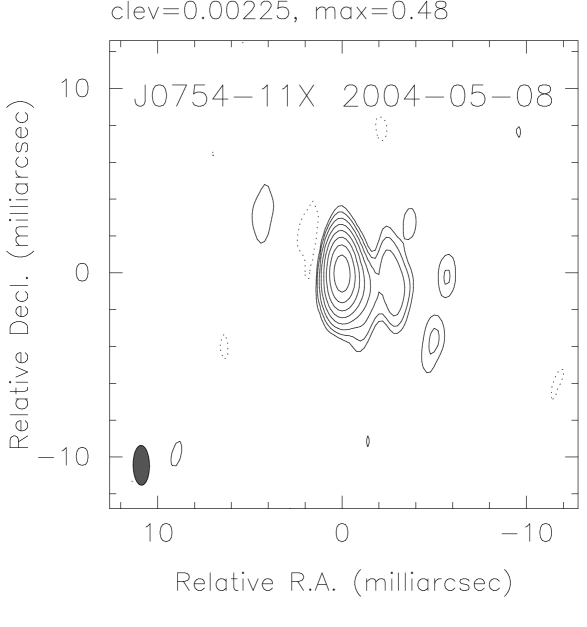
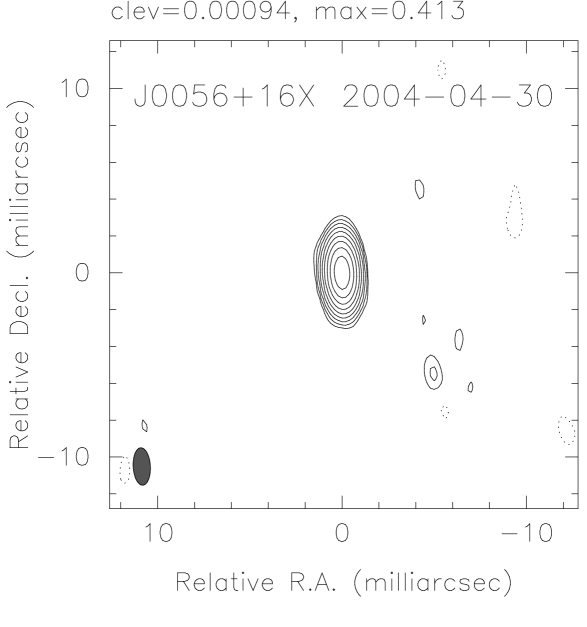
A sample of data used for candidate selection as well as some typical imaging results are shown in Figure 2. In row /a/ we present the broad-band spectra from RATAN–600 observations in 2003 and from some old data taken from the NVSS, 87GB (Gregory & Condon 1991) and the Radio Survey of the Galactic Plane at 11cm (Fürst et al. 1990) catalogues. In rows /b/ and /d/ the dependence of visibility function amplitude versus projected baseline at S and X bands, respectively, is shown. Each point is a coherent average over the scan duration and over the band. Naturally weighted CLEAN images at S and X bands are presented in rows /c/ and /e/333The scale of the J0012+6551 map is increased with respect to other maps.. The sources in this figure are placed such that the contribution of the compact component in total emission increases from left to right. According to Kovalev et al. (2002), we interpret the broad-band spectra of all selected sources as a sum of two constituents: emission from an optically thin extended component with steep spectrum which usually increases with decreasing frequency up to hundreds of MHz, and emission from a compact component with self-absorption which has a maximum at a frequency higher than 1 GHz. The spectrum of J0012+6551 has spectral index . No contribution to emission from the compact component is seen, and the correlated flux density even at the shortest baseline projections is several times less than the total flux density. See discussion of angular dimensions of compact steep spectrum sources in O’Dea (1998) for more details. The source is below the detection limit at both bands at spacings 20 M. At X-band the map shows only noise. The spectrum of J0909+4253 has the spectral index at frequencies less than 2 GHz and it flattens at higher frequencies. This flattening is caused by the contribution of the compact component. When the contribution of the extended component is subtracted from the spectrum, the residual spectrum grows with increasing the frequency, and our measurements of the correlated flux density confirm it. The remaining two sources have flat and inverted spectra, which is an indication of dominance of the compact constituent in total emission. Again our VLBA observations confirm it. Correlated flux densities at short spacings for J0056+1625 and some other sources are even higher than the total flux density observed at RATAN half a year before the VLBA measurements due to the strong variability of the object. Analysis of this sample illustrates the validity of our approach for candidate selection.
5. Conclusion
The VCS3 Survey has added 360 new sources not previously observed with VLBI. Of these, 231 sources are suitable as phase referencing calibrators and as target sources for geodetic applications. A careful strategy of source selection resulted in a very high detection rate; more than 80% of the sources in our candidates list were detected.
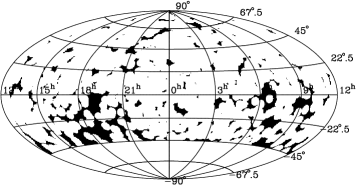
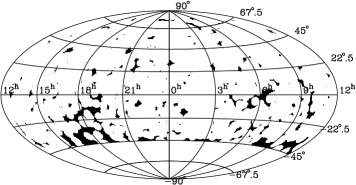
This campaign contributed considerably in reducing the areas with low density of known calibrators. If only sources from the ICRF-Ext2 catalogue are taken into account, 48.1% of the sky area above declination has no calibrator within a 4° radius disk in any given direction. Combining the ICRF-Ext2 and the VCS1 catalogues, this area is reduced to 13.7%. Adding the VCS2 catalogue reduces the area to 10.5%. After the VCS3 campaign this area is only 5.3% of the sky above declination . Figure 3 shows the area with insufficient calibrators density before and after the VCS3 observing campaign.
References
- Beasley et al. (2002) Beasley, A. J., Gordon, D., Peck, A. B., Petrov, L., MacMillan, D. S., Fomalont, E. B., & Ma, C. 2002, ApJS, 141, 13
- Bolton, Savage, & Wright (1971) Bolton, J. G., Savage, A., & Wright, A. E. 1979, Australian Journal of Physics, Astroph. Suppl., 46, 1
- Cohen & Shaffer (1971) Cohen, M. H., & Shaffer, D. B. 1971, AJ, 76, 91.
- Condon et al. (1998) Condon, J. J., Cotton, W. D., Greisen, E. W., Yin, Q. F., Perley, R. A., Taylor, G. B., & Broderick, J. J. 1998, AJ, 115, 1693
- Fey et al. (2004) Fey, A.L., Ma, C., Arias, E. F., Charlot, P., Feissel-Vernier, M., Gontier, A.-M., Jacobs, C. S., Li, J., & MacMillan, D. S. 2004, AJ, 127, 3587.
- Fomalont et al. (2003) Fomalont, E., Petrov, L., McMillan, D. S., Gordon, D., & Ma, C. 2003, AJ, 126, 2562
- Fürst et al. (1990) Fürst, E., Reich, W., Reich, P., & Reif, K. 1990, A&AS, 85, 805
- Gregory & Condon (1991) Gregory, P. C., & Condon, J. J. 1991, ApJS, 75, 1011
- Gregory et al. (1996) Gregory, P. C., Scott, W. K., Douglas, K., & Condon, J. J. 1996, ApJS, 103, 427
- Greisen (1988) Greisen, E. W. 1988, in Acquisition, Processing and Archiving of Astronomical Images, ed. G. Longo & G. Sedmak (Napoli: Osservatorio Astronomico di Capodimonte), 125
- Jackson et al. (2002) Jackson, C. A., Wall, J. V., Shaver, P. A., Kellermann, K. I., Hook, I. M., & Hawkins, M. R. S. 2002, A&A, 386, 97
- Kellermann, Pauliny-Toth, & Davis (1968) Kellermann, K. I., Pauliny-Toth, I. I. K., & Davis, M. M. 1968, Astrophysical Letters, 2, 105
- Kellermann & Owen (1988) Kellermann, K. I. & Owen, F. N. 1988, Galactic and Extragalactic Radio Astronomy, ed. G. L. Verschur & K. I. Kellermann (Springer Verlag), 563
- Kovalev et al. (1999) Kovalev, Y. Y., Nizhelsky, N. A., Kovalev, Yu. A., Berlin, A. B., Zhekanis, G. V., Mingaliev, M. G., & Bogdantsov, A. V. 1999, A&AS, 139, 545
- Kovalev et al. (2002) Kovalev, Y. Y., Kovalev, Yu. A., Nizhelsky, N. A., & Bogdantsov, A. B. 2002, PASA, 19, 83
- Ma et al. (1998) Ma, C., et al. 1998, AJ, 116, 516
- Matveenko et al. (1965) Matveenko, L. I., Kardashev, N. S., Sholomitskij, G. B. 1965, Izvestia VUZov. Radiofizika, 8, 651 (in Russian)
- Myers et al. (2003) Myers, S. T., et al. 2003, MNRAS, 341, 1
- O’Dea (1998) O’Dea, C. P. 1998, PASP, 110, 493
- Pearson et al. (1994) Pearson, T. J., Shepherd, M. C., Taylor, G. B., & Myers, S. T. 1994, BAAS, 185, 0808
- Ryan et al. (1993) Ryan, J. W., Clark, T. A., Ma, C., Gordon, D. Caprette, D. S., & Himwhich, W. E. 1993, in Global scale tectonic plate motions measured by CDP VLBI data, 23, ed. D. E. Smith & D. L. Turcotte, (Washington, D.C.: American Geophysical Union, Geodynamics Series), 37
- Shepherd (1997) Shepherd, M. C. 1997, in ASP Conf. Series. 125, Astronomical Data Analysis Software and Systems VI, ed. G. Hunt & H. E. Payne (San Francisco: ASP), 77
- Verkhodanov et al. (1997) Verkhodanov, O. V., Trushkin, S. A., Andernach, H., & Chernenkov, V. N. 1997, in ASP Conf. Ser. 125, Astronomical Data Analysis Software and Systems VI, ed. G. Hunt, & H. E. Payne (San Francisco: ASP), 322
- Winn, Patnaik, & Wrobel (2003) Winn, J. N., Patnaik, A. R., & Wrobel, J. M. 2003, ApJS, 145, 83
- Wright and Otrupcek (1990) Wright, A. E. & Otrupcek, R. 1990, Australia Telescope National Facility, CSIRO, Parkes
- Wright et al. (1996) Wright, A. E., Griffith, M. R., Hunt, A. J., Troup, E., Burke, B. F., & Ekers, R. D. 1996, ApJS, 103, 145
- Wrobel et al. (1998) Wrobel, J. M., Patnaik, A. R., Browne, I. W. A., & Wilkinson, P. N. 1998, A&AS, 193, 4004
- Wrobel and Ulvestad (2004) Wrobel, J. M., & Ulvestad, J. S. 2004, VLBA status summary, NRAO