Infall, the Butcher-Oemler Effect, and the Descendants of Blue Cluster Galaxies at
Abstract
Using wide-field HST/WFPC2 imaging and extensive Keck/LRIS spectroscopy, we present a detailed study of the galaxy populations in MS 2053–04, a massive, X-ray luminous cluster at . Analysis of 149 confirmed cluster members shows that MS2053 is composed of two structures that are gravitationally bound to each other; their respective velocity dispersions are km s-1 (113 members) and km s-1 (36 members). MS2053’s total dynamical mass is . MS2053 is a classic Butcher-Oemler cluster with a high fraction of blue members (%) and an even higher fraction of star-forming members (%), as determined from their [OII] emission. The number fraction of blue/star-forming galaxies is much higher in the infalling structure than in the main cluster. This result is the most direct evidence to date that the Butcher-Oemler effect is linked to galaxy infall. In terms of their colors, luminosities, estimated internal velocity dispersions, and [OII] equivalent widths, the infalling galaxies are indistinguishable from the field population. MS2053’s deficit of S0 galaxies combined with its overabundance of blue spirals implies that many of these late-types will evolve into S0 members. The properties of the blue cluster members in both the main cluster and infalling structure indicate they will evolve into low mass, galaxies with extended star formation histories like that of low mass S0’s in Coma. Our observations show that most of MS2053’s blue cluster members, and ultimately most of its low mass S0’s, originate in the field. Finally, we measure the redshift of the giant arc in MS2053 to be ; this object is one in only a small set of known strongly lensed galaxies at .
1 Introduction
The seminal papers by Butcher & Oemler (1978, 1984) gave rise to an entire generation of studies on the evolution of galaxy populations in clusters. Their observations of an increasing number of blue cluster members with increasing redshift, christened the Butcher-Oemler (B-O) effect, have since been confirmed with photometric (Couch et al. 1994; Dressler et al. 1994; Rakos & Schombert 1995; Lubin 1996; Dressler et al. 1997; Couch et al. 1998; Margoniner & de Carvalho 2000) and spectroscopic studies (Lavery & Henry 1986; Couch & Sharples 1987; Newberry et al. 1988; Lavery et al. 1992; Dressler & Gunn 1992; Abraham et al. 1996; Caldwell & Rose 1997; Ellingson et al. 2001; Tran et al. 2003a). However, the origins of the B-O effect have yet to be fully understood.
Several early studies suggested the B-O effect was due to galaxy-galaxy interactions (Lavery & Henry 1988; Lavery et al. 1992; Dressler et al. 1994; Couch et al. 1994). More recently, galaxy infall has become a favored mechanism for increasing the blue fraction in clusters, especially at intermediate redshifts (Kauffmann 1995; Couch et al. 1998; van Dokkum et al. 1998b; Ellingson et al. 2001; Fairley et al. 2002). A panoramic imaging study of A851 () by Kodama et al. (2001) suggests that the transition from predominantly blue to red galaxy colors occurs most often in the subclumps outside the cluster core. However, the observations needed to understand the physical mechanisms driving the evolution of cluster galaxies, redshifts, morphologies, and spectral types, are difficult to obtain. Although substructure in massive clusters is quite common and is attributed to the continued accretion of galaxies, the evidence linking galaxy infall to the B-O effect, the spatial and kinematic segregation of early and late-type members (Dressler 1980; Fisher et al. 1998; Biviano et al. 2002), remains circumstantial.
Knowing whether the B-O effect is due to galaxy infall is particularly important if we are to explain the unexpected deficit of S0 galaxies observed at intermediate redshifts (Dressler et al. 1997; Fasano et al. 2000; Lubin et al. 2002). These studies suggest that the S0’s in nearby clusters form out of the excess of spirals observed at higher redshifts, the B-O galaxies (although for an alternative explanation, see Andreon 1998). If S0’s form from infalling spirals, then this would mean that most S0’s in nearby clusters originated in the field.
To assess how galaxy infall, the Butcher-Oemler effect, and the possible progenitors of S0 members are related, we present a detailed study of MS 2053–04, a massive, X-ray luminous galaxy cluster (Stocke et al. 1991; Luppino & Gioia 1992) at . With extensive Keck/LRIS spectroscopy, we identify 149 members and measure MS2053’s velocity dispersion and mass. Combining our spectroscopic survey with wide-field HST/WFPC2 imaging, we then examine the colors, luminosities, morphologies, estimated internal velocity dispersions, and [OII] equivalent widths of the confirmed cluster members. We also test whether the current star formation in B-O galaxies at is consistent with trends observed in clusters at , that cluster S0’s tend to have younger luminosity-weighted ages than the ellipticals (Poggianti et al. 2001; Smail et al. 2001). For comparison to the field population, we utilize a field sample with redshifts comparable to MS2053.
In §2 and §3, we describe our imaging and spectroscopic observations as well as how physical properties such as colors and spectral types were determined. In §4, we briefly summarize our sample of field galaxies. In §5, we present MS2053’s redshift distribution, velocity dispersion, and mass as well as a short discussion on substructure. In §6, we examine MS2053’s early-type galaxy population. We determine MS2053’s fraction of blue members and show how it is related to galaxy infall in §7. The spectroscopic Butcher-Oemler fraction is presented in §8 along with a summary of the X-ray observations from Chandra. We dicuss how the blue members in MS2053 are related to S0 galaxies in lower redshift clusters in §9, and present our conclusions in §10.
Unless otherwise noted, we use , and km s-1 Mpc-1. At MS2053’s redshift, this corresponds to a projected scale of kpc/arcsec.
2 Imaging
2.1 Ground-Based Observations
Our early observations of the MS2053 field included a 200s and 240s image ( seeing) taken at Keck centered on the Brightest Cluster Galaxy (BCG; #1667). Objects were detected and magnitudes determined with FOCAS (Valdes 1982). The and images were used primarily to select spectroscopic targets for observing runs from August 1995 up to August 1997.
2.2 HST/WFPC2 Observations
MS2053 was imaged by HST/WFPC2 in October 1998. The observations consisted of six overlapping pointings taken in both F606W and F814W filters and covered an area (Fig. 1). The total integration time at each pointing was 3200s and 3300s for F606W and F814W respectively; the image reduction is detailed in Hoekstra et al. (2002).
Total magnitudes were measured using SExtractor (Bertin & Arnouts 1996), and colors measured within a diameter aperture. Following the method outlined in van Dokkum & Franx (1996), we transform magnitudes in the WFPC2 filter system to redshifted Johnson magnitudes using:
| (1) |
| (2) |
where the constants were calculated for an E/S0 galaxy spectral energy distribution (Pence 1976) redshifted to . Apparent magnitude is converted to an absolute magnitude using a distance modulus adjusted for passive evolution ((); here we have accounted for simple fading, as determined from the Fundamental Plane (; van Dokkum et al. 1998a). We also correct for Galactic reddening as mag in the MS2053 field (Schlegel et al. 1998).
2.3 Morphologies and Structural Parameters
All galaxies on the WFPC2 imaging brighter than were visually classified by M. Franx, P. van Dokkum, and D. Fabricant using the method described in Fabricant et al. (2000). The morphological types of {E, E/S0, S0, S0/a, Sa, Sb, Sc, Sd} were assigned values of ; intermediate values were also used. In our analysis, the galaxies are split into five main categories: E/S0 galaxies have , S0/a galaxies , Sa galaxies , spirals , and mergers .
We complement the visual classifications with structural parameters measured using GIM2D (Simard et al. 2002). For each cluster and field galaxy with HST/WFPC2 imaging, we fit surface brightness models using a pure de Vaucouleurs profile. The half-light radii and surface brightnesses were then used with the galaxy colors to estimate internal velocity dispersions (see §3.5). For a more extensive discussion on analyzing cluster galaxies at intermediate redshifts using GIM2D, see Tran et al. (2003b).
3 Spectroscopy
3.1 Observations and Reductions
Using LRIS (Oke et al. 1995) on Keck, a spectroscopic survey of the MS2053 field was conducted from August 1995 to July 2001 over 7 observing runs. During this period, spectroscopic targets were selected from three object catalogs. The first two catalogs were made from the Keck and images. Spectra taken during the August 1995 to August 1997 observing runs were selected from these Keck catalogs. A third object catalog was created later from the HST/WFPC2 mosaic (taken in October 1998). Spectra obtained after August 1997 were selected from the HST catalog. In all cases, the spectroscopic targets were selected by magnitude () and not morphology.
A total of 18 multi-slit masks containing 669 targets were observed. The multi-slit masks included both masks designed to measure redshifts ( sec) and masks to measure internal velocity dispersions ( sec) with redshift fillers. The slits were typically wide and the seeing on the observing runs was . Depending on the grating used, the spectral resolution (FWHM) ranged from Å with higher spectral resolution (Å) used for the dispersion masks.
IRAF101010IRAF is distributed by the National Optical Astronomy Observatories, which are operated by the Association of Universities for Research in Astronomy, Inc., under cooperative agreement with the National Science Foundation. routines and custom software provided by L. Simard and D. Kelson (Kelson 1998) were used to reduce the spectra; a detailed explanation of the reduction pipeline can be found in Tran et al. (1999). The spectra were corrected for the telluric atmospheric A and B bands by using the spectrum of a bright blue star included on all the masks. The observed wavelength coverage of the 669 targets depended on the grating and slitlet position, but was typically Å. For most cluster members, this includes the [OII] doublet and 4000Å break.
3.2 Measuring Redshifts
The IRAF routine XCSAO (Kurtz et al. 1992) was used to measure absorption line redshifts and their errors. Four template galaxy spectra were used: NGC7331 (morphological type SA(s)b), NGC4889 (E4), NGC2276 (SAB(rs)c), and an “E+A” galaxy. The cross-correlation wavelength range for the cluster members was approximately Å in the restframe. Emission line redshifts were determined from measuring the central wavelengths of the appropriate lines, the [OII] doublet, H, and/or [OIII]. All redshifts were inspected by eye. No systematic difference was found for redshifts determined from both absorption and emission lines.
The final redshift catalog has 484 redshifts: 44 stars, 157 cluster members, and 283 field galaxies. Each redshift was given a quality flag where corresponded to definite, probable, and maybe (single emission line). In our analysis, we consider only galaxies with a redshift quality flag of ; this reduces the total cluster sample to 149 members. The average redshift error is km s-1.
3.3 Completeness and Selection Effects
To determine if our redshift survey of the MS2053 field is influenced by selection effects, we consider the possibility of magnitude bias due to it being inherently more difficult to measure redshifts of fainter objects, and color bias due to sparse sampling. In the following discussion, we consider only the objects that fall on the WFPC2 mosaic.
By comparing the number of galaxies in the WFPC2 photometric catalog to the number of spectroscopic targets and acquired redshifts, we investigate the completeness of our survey using the method outlined in Yee et al. (1996) and van Dokkum et al. (2000). Figure 2 shows the sampling rate, success rate, and completeness of our sample as a function of . The sampling rate, defined as the number of spectroscopic targets divided by the number of galaxies in the HST catalog, is % at (). The success rate, defined as the number of acquired redshifts divided by the number of targets, is also high (%) at . Our incompleteness at the faint end is due to sparse sampling and not the inability to measure redshifts of targeted galaxies.
We then compare the colors of galaxies with measured redshifts to all galaxies in the WFPC2 catalog to determine if the spectroscopic sample is biased against faint blue galaxies because of sparse sampling. We focus on objects with and denote as . Figure 3 compares the color distribution of all galaxies in the WFPC2 catalog to that of the spectroscopic sample and cluster members. Note the similarity in the color distributions of the photometric sample to that of the spectroscopic sample; a Kolmogorov-Smirnov test (Press et al. 1992) finds the two distributions are indistinguishable, , our redshift sample is not biased against faint blue galaxies. As an additional visual check, we include the weighted color distribution of the spectroscopic sample determined by weighting each galaxy by the inverse of the magnitude selection function ; this is also quite similar to the full photometric sample.
3.4 Spectral Types
Using the same spectral bandpasses as Fisher et al. (1998) and Tran et al. (2003a, 2004), we measure [OII], H, H, and H equivalent widths (EW) for the 149 cluster members and 38 field galaxies (see §4). We separate the galaxies into three spectral types to quantify their recent and ongoing star formation: 1) absorption line galaxies with no significant [OII] emission ([OII]Å) and no strong Balmer absorption [(HH Å]; 2) emission line galaxies with strong [OII] emission (Å); and 3) post-starburst (“E+A”) galaxies that have weak or no [OII] emission ( Å) and strong Balmer absorption [(HH Å].
3.5 Internal Velocity Dispersions
A significant part of our spectroscopic observations with Keck/LRIS were devoted to measuring internal velocity dispersions for the brightest cluster members in MS2053. The reduction and analysis of the measured internal velocity dispersions () for 33 cluster galaxies () are described in Wuyts et al. (2004).
To estimate internal velocity dispersions () for the rest of our cluster sample, we use the method outlined in Kelson et al. (2000) and Tran et al. (2003a). To summarize, we evolve the galaxies until they lie on the color magnitude relation defined by a passively evolving galaxy population, the early-types in MS2053, and then use the Fundamental Plane to estimate . Because this method requires accurate colors and structural parameters, we can estimate velocity dispersions only for galaxies that have WFPC2 imaging. We measure the necessary structural parameters by fitting pure de Vaucouleurs profiles to the galaxies (see §2.3).
3.6 Redshift of the Gravitational Arc
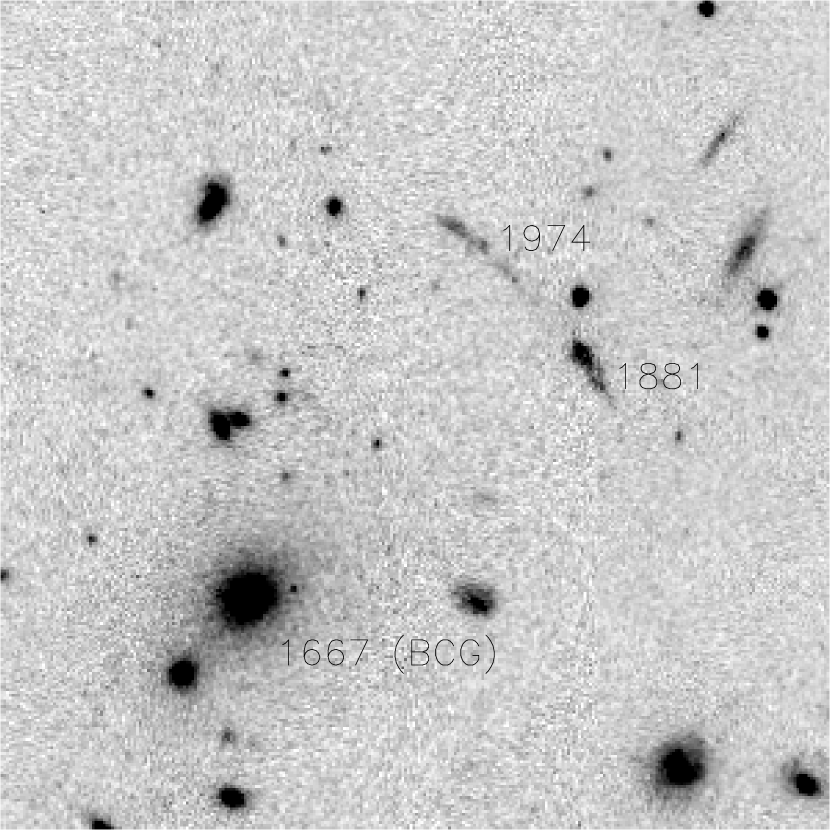
MS2053 lenses a background galaxy that appears as two giant tangential arcs (Luppino & Gioia 1992, #1881 & #1974 in Fig. 4). After a heroic effort that spanned virtually all of our Keck/LRIS observing runs for MS2053, we were able to measure in July 2001 a redshift for galaxy #1881 []. With a total integration time of 3.5 hours, we determine the source redshift to be ; the 1D spectrum is shown in Fig. 5. This object is one of only a small set of known strongly lensed galaxies at .
4 Field Sample
In our analysis, we also include a comparison to field galaxies at the same approximate redshift as MS2053. The field galaxies are drawn from an extensive spectroscopic survey completed by our group of four different fields, of which MS2053 was one. Our unique dataset contains an unsually large number of spectroscopically confirmed field galaxies (; ) gathered over a total area of ; HST/WFPC2 mosaics in F606W and F814W were also obtained in these fields. The observational details of the fields and their characteristics are summarized in Tran et al. (2003a, 2004).
We select field galaxies within the redshift range whose wavelength coverage included [OII], and that were imaged by WFPC2. These selection criteria enable direct comparison between the field population and the cluster members since both can be analyzed in the exact same manner, spectral indices, colors, rest-frame magnitudes, morphological types, and structural parameters. Our field sample of 38 galaxies spans comparable ranges in luminosity () and morphology () as the cluster members. We also estimate internal velocity dispersions for the field galaxies using the method described in §3.5 (see Tran et al. 2003a, 2004).
5 Cluster Characteristics
5.1 MS2053’s Redshift and Velocity Dispersion
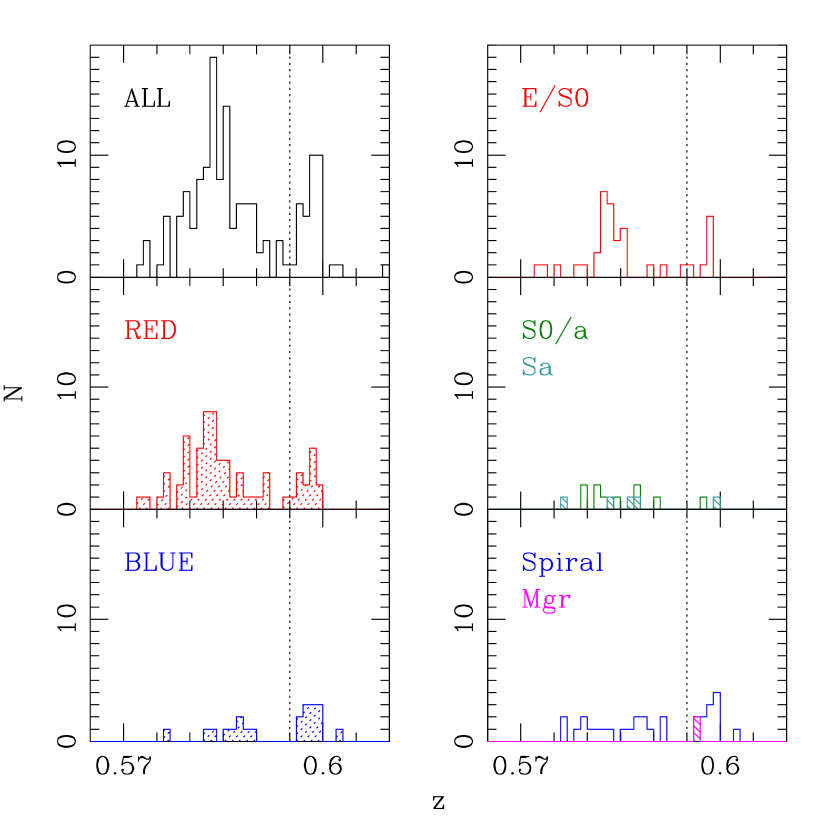
From our redshift survey of the MS2053 field, we identify 149 cluster members and show their redshift distribution in Fig. 6. The cluster members show a striking bimodal distribution with a main peak centered at and a smaller peak at . Guided by the shapes of the two peaks, we define members with to be in the main cluster (hereafter referred to as MS2053-A) and members at to be in the group/sheet (MS2053-B). MS2053-A has 113 galaxies and MS2053-B 36 galaxies.
The velocity dispersions of MS2053-A and MS2053-B are km s-1 and km s-1 respectively. The average redshifts, dispersions, and their corresponding errors are calculated using the biweight and jacknife methods (Beers et al. 1990), and they are listed in Table 1. The velocity dispersion of MS2053-A is in remarkable agreement with that estimated from weak-lensing ( km s-1; Hoekstra et al. 2002). If MS2053’s bimodal redshift distribution had not been recognized, the cluster’s spectroscopic velocity dispersion would be significantly overestimated ( km s-1).
5.2 Virial Mass
To estimate the virial masses of MS2053-A and MS2053-B, we follow Ramella et al. (1989) and first determine the virial radii using:
| (3) |
where is the mean velocity of the cluster, is the number of members, and the angular separation between the and members. With the virial radius, we then estimate the mass using
| (4) |
where is the line of sight velocity dispersion and the gravitational constant. We consider MS2053-A and MS2053-B separately and measure their virial radii to be 1.07 and 1.13 Mpc, respectively. MS2053-A’s mass is while MS2053-B is only (Table 1).
Combining MS2053-A’s velocity dispersion with the X-ray temperature measured from Chandra for MS2053 ( keV; Vikhlinin et al. 2002), we find MS2053 agrees well with the non-evolving relation (Mushotzky & Scharf 1997). Although MS2053 is not a visually striking cluster (see Fig. 1), its dynamical mass and X-ray temperature are consistent with it being a massive system.
5.3 Spatial Distribution and Substructure
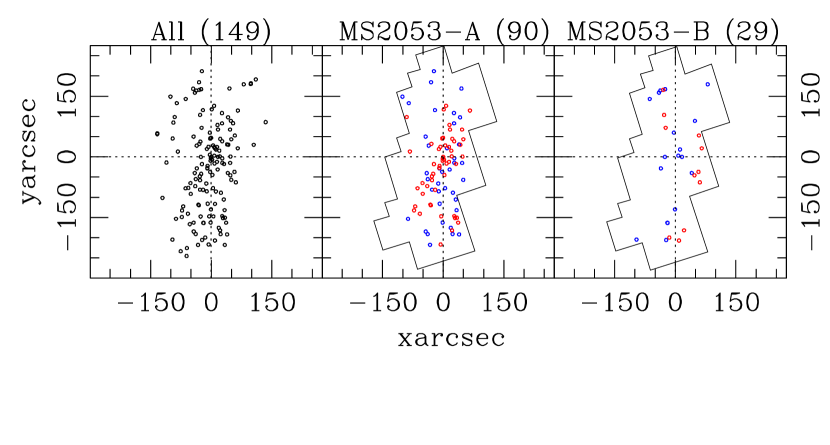
Having established the bimodality in the redshift distribution of MS2053, we now investigate whether the spatial distributions of members in the two components also show a high degree of substructure. The spectroscopically confirmed cluster members have an elongated spatial distribution (Fig. 7). This is partly due to the layout of the HST/WFPC2 mosaic which was designed to reflect MS2053’s elongated distribution first observed in the Keck imaging. However, MS2053’s spatial distribution is mainly due to a real elongation in the distribution of cluster members.
In MS2053-A, the absorption line members are more spatially concentrated than the emission line members (Fig. 7). However, the spatial distributions of absorption and emission line galaxies in MS2053-B are indistinguishable from each other, and the galaxies in MS2053-B tend to lie at larger radii than galaxies in MS2053-A ( kpc vs. kpc). MS2053-B’s extended spatial distribution and lack of spectral segregation is consistent with a scenario where it is in the initial stages of being accreted by the main cluster (MS2053-A).
A useful measure of the degree of substructure in a cluster is the Dressler-Schectman test (Dressler & Shectman 1988). By using redshifts and spatial positions, the D-S test quantifies how much the local mean redshift and velocity dispersion (as defined by the ten nearest neighbors to each galaxy) deviate from the cluster’s global values. Considering all cluster members (149) as well as only galaxies in MS2053-A, we find the degree of substructure in MS2053 to be significant at the % confidence level in both cases. Although MS2053 is rich, its significant substructure and bimodal redshift distribution indicate it is a dynamically young system.
6 Cluster Early-type Population
In the following, we consider only the spectroscopically confirmed cluster members that 1) belong to MS2053-A or MS2053-B, 2) are brighter than , and 3) are on the WFPC2 mosaic. Our conservative magnitude limit corresponds to a spectroscopic completeness of % in the WFPC imaging (see Fig. 2), and includes virtually all spectroscopically confirmed cluster members that were visually classified. These selection criteria reduce our cluster sample to 63 members in MS2053-A and 26 in MS2053-B; these galaxies are shown in Fig. 8.
6.1 Early-type Fraction
To estimate the early-type fraction in MS2053, we follow van Dokkum et al. (1998b) and combine the E/S0’s with half of the S0/a members. Considering only members that have been morphologically typed, the early-type fraction in MS2053 is %. This value is consistent with the expected value from the observed trend in clusters of decreasing early-type fraction with increasing redshift (Dressler et al. 1997; van Dokkum et al. 2000). It is also consistent with galaxy clusters having a substantially higher early-type fraction than the field: the early-type fraction in MS2053 is nearly twice that of the field at comparable redshifts (see Table 2). However, MS2053’s higher early-type fraction is primarily due to the main cluster; the early-type fraction in MS2053-B is actually comparable to that of the field.
MS2053 has an unusual morphological mix in that it has no members that are visually classified as S0 galaxies (Fig. 8). This may be partially due to the difficulty of separating ellipticals from S0’s (Fabricant et al. 2000), and it could be argued that we have missed the S0’s in MS2053 due to, e.g. inconsistencies between classifiers. However, the same classifiers (D. Fabricant, M. Franx, and P. van Dokkum) also morphologically typed galaxies in CL 1358+62 (; Fabricant et al. 2000). S0 galaxies were identified in CL1358 whereas the same classifiers find none in MS2053. Therefore, the deficit of S0’s in MS2053 is unlikely to be the result of inconsistencies in the classification.
6.2 Color-Magnitude Relation
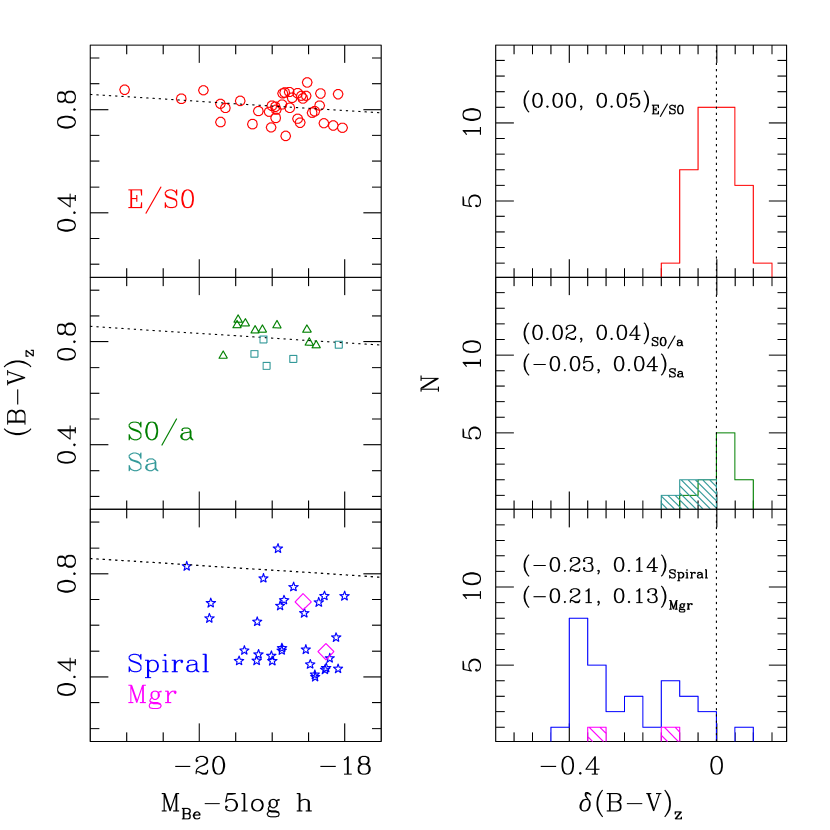
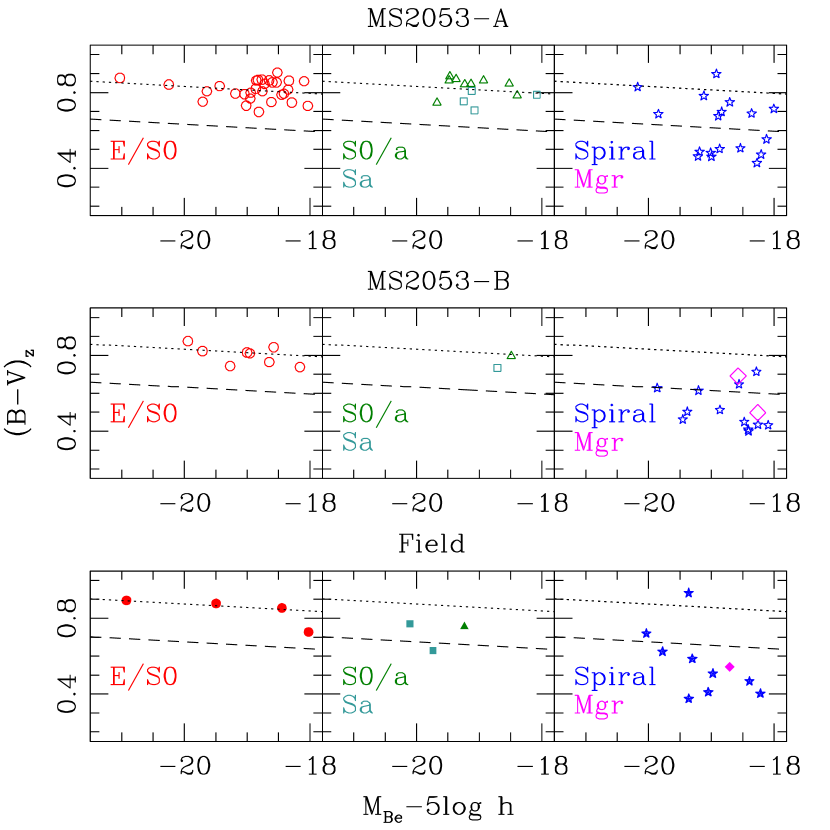
The color-magnitude (CM) distribution for cluster members is shown in Fig. 9 where galaxies are separated by morphological type into early-types (E/S0), early-type spirals (S0/a-Sa), spirals (Sa/b and later), and mergers. We adopt the slope of the CM relation measured from CL1358 (; van Dokkum et al. 1998b) and normalize it to the E/S0 members. The residuals of the CM relation also are included in Fig. 9.
The early-type galaxies in MS2053 define a red sequence that is well fit by the CM relation from CL1358. We find no suggestion of evolution in the slope of the CM relation, consistent with results on the CM relation in MS 1054–03 (; van Dokkum et al. 2000). The observed scatter (RMS) of the E/S0’s is 0.05; this value is larger than observed in CL1358 (; van Dokkum et al. 1998b). The larger scatter associated with E/S0’s in MS2053 may indicate that the faint early-types are younger than the more luminous E/S0’s (see Wuyts et al. 2004). We also find a trend between color and morphological type, later type members tend to be bluer, similar to that observed at lower redshifts.
7 Infall and the Butcher-Oemler Effect
A recent study of A851 (; Kodama et al. 2001) finds that the transition from predominantly blue to red galaxy colors occurs most often in the subclumps outside the cluster core. However, a link between galaxy infall and a high fraction of blue cluster galaxies has yet to be conclusively established. Here we demonstrate that: 1) the two structures making up MS2053 are gravitationally bound to each other and will eventually merge; 2) MS2053’s blue fraction is elevated by the galaxies in the infalling structure; and 3) the infalling galaxies as a whole are indistinguishable from those in the field.
As in the previous section, we consider only spectroscopically confirmed members brighter than that fall on the HST/WFPC2 mosaic (Table 2; Fig. 8).
7.1 Evidence of Infalling Galaxies
To confirm that MS2053-A and MS2053-B are gravitationally bound to each other and will eventually merge into one system, we follow Beers et al. (1982) and treat the system as a two-body problem. From their Eq. 15, a bound system has
| (5) |
where is the relative velocity, the projected separation, the total mass of the system, and the projection angle with respect to the plane of the sky.
MS2053-A and MS2053-B are virtually superimposed on the sky (see Fig. 7): the difference in the average projected radius () of the galaxies in the two structures is 97 kpc. The total mass of the system is and the difference in the mean redshifts of MS2053-A and MS2053-B gives km s-1. Because the projection angle is the only unknown parameter, we adopt a simple approach and determine whether the two structures are bound for . We find that as long as , MS2053-A and MS2053-B are bound. Thus given a random distribution of projection angles, the probability that the two structures are bound is %, very likely.
As another check, we compare the relative velocity of the two structures () to the escape velocity () of the main cluster (MS2053-A). Using and Mpc (Table 1), we estimate km s-1. Since , the two structures are bound. In addition, the similarity in the two velocities suggests that MS2053-B is infalling.
An infalling scenario is supported by the properties of the galaxies in MS2053-B. The fraction of star-forming galaxies in MS2053-B is comparable to that of our field sample (67% vs. 61%), and it is times larger than in MS2053-A (see Table 2). This is also the case for the blue galaxies. Since star formation in infalling galaxies is effectively quenched within a few Gyr (Balogh et al. 2000), a core-crossing time, their activity indicates the galaxies in MS2053-B have yet to pass through the core of the main cluster.
7.2 Fraction of Blue Cluster Members
Using the classical definition of a blue cluster galaxy (; Butcher & Oemler 1978), we measure the fraction of blue members in MS2053 to be % (see Table 2). MS2053’s fraction of blue cluster members agrees with the expected value from the original trend found by Butcher & Oemler (1984) of increasing blue fraction with redshift. It is also consistent with the correlation between blue fraction and redshift measured by Ellingson et al. (2001) using the CNOC1 cluster sample ().
We have defined MS2053’s blue cluster fraction using our sample of spectroscopically confirmed cluster members () rather than using the classic photometric approach (Butcher & Oemler 1984). The advantage of using a spectroscopic sample to determine MS2053’s blue fraction is that we are free from the usual uncertainty due to field contamination that is associated with photometric studies. However, we note for comparison that our blue fraction is very similar to that determined photometrically (%; Fairley et al. 2002).
7.3 Origin of Blue Cluster Members
We find that MS2053’s high fraction of blue cluster members is due primarily to the galaxies in MS2053-B and not the main cluster: more than half of the blue galaxies are associated with MS2053-B (Fig. 6). The fraction of blue galaxies in the main cluster is only 13% and is comparable to that of clusters at (Butcher & Oemler 1984; Ellingson et al. 2001). However, the fraction of blue galaxies in MS2053-B is over a factor of 3 higher (46%).
The galaxy population in MS2053-B is remarkably similiar to that of the general field. To quantify this, we compare the color-magnitude distributions of both MS2053-A and MS2053-B to that of the field (Fig. 10). In all three environments, the early-type galaxies follow the defined CM relation and the luminosity distributions are indistinguishable. However, while the fraction of blue galaxies in MS2053-B is comparable to that in the field (56%), both are significantly higher than in MS2053-A. Using the K-S test, the color distribution of MS2053-B’s galaxies is indistinguishable from that of the field, whereas MS2053-A’s galaxies differ at the % confidence level. We also note that the morphological distribution of galaxies in MS2053-B is indistinguishable from the field.
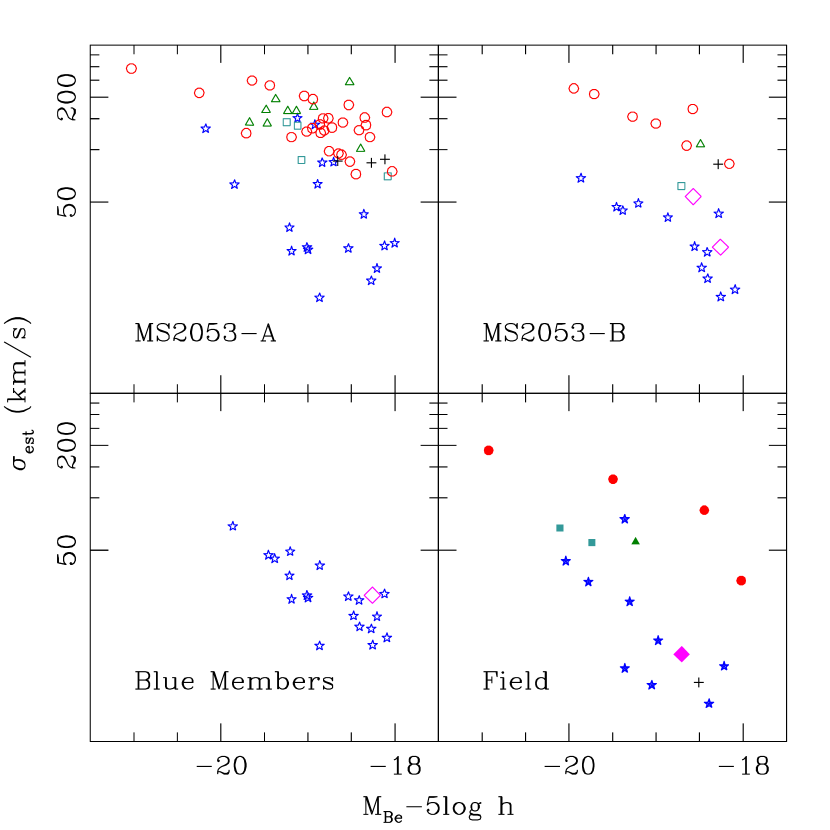
Finally, we compare the estimated internal velocity dispersions (see §3.5) of the galaxies in MS2053-A, MS2053-B, and the field (Fig. 11). Using the K-S test, we find that the distribution of MS2053-B is indistinguishable from that of the field. However, MS2053-A’s galaxies differ from the field at the % confidence level. We conclude that MS2053’s elevated fraction of blue members is due to a population of infalling galaxies that are indistinguishable from the field.
8 Spectroscopic Butcher-Oemler Effect
Our spectroscopic survey not only enables us to determine the fraction of blue galaxies in MS2053 without contamination from the field, it also allows us to test whether the high fraction of blue members is reflected in the spectroscopic properties of the cluster members. By separating the cluster members into absorption line, emission line, and post-starburst galaxies, we measure the fraction of active galaxies in MS2053. To confirm that the observed [OII] emission is due to star formation rather than emission from active galactic nuclei, we utilize Chandra observations of the MS2053 field. We then determine whether the blue members in MS2053 are related to its star-forming population.
8.1 Emission Line Members
MS2053 has an unusually high fraction of emission line galaxies (50%): of the 111 cluster members for which we can measure [OII], 56 have [OII]Å. In comparison to clusters at with comparable velocity dispersions (Fisher et al. 1998; Balogh et al. 2002), MS2053 has more than twice the number of active members. As found in earlier studies of lower redshift clusters (Couch & Sharples 1987; Dressler & Gunn 1992), MS2053’s high fraction of blue members is reflected in its high fraction of spectroscopically active members. We find that like the blue cluster members, the fraction of emission line galaxies in MS2053-B is significantly higher than in the main cluster (see Table 2).
8.2 AGN Activity
To determine whether any of MS2053’s emission line galaxies harbor active galactic nuclei (AGN), we analyse archival X-ray observations from Chandra. Two overlapping pointings of the MS2053 field were taken with ACIS-I (). Each pointing was ksec, giving an approximate flux detection limit of erg s-1 cm-2 (Martini et al. 2002); this corresponds to erg s-1 at and is deep enough to detect the majority of AGN (Norman et al. 2004).
Of the 149 confirmed cluster members, we find only the brightest cluster galaxy (BCG; #1667) is detected in the X-ray. However, the BCG has no detectable [OII] emission. Of the 56 cluster members with [OII]Å, none are X-ray detected to the given flux limit. Thus the [OII] emission measured in MS2053’s members is most likely due to ongoing star formation rather than AGN activity.
8.3 Ongoing Star Formation
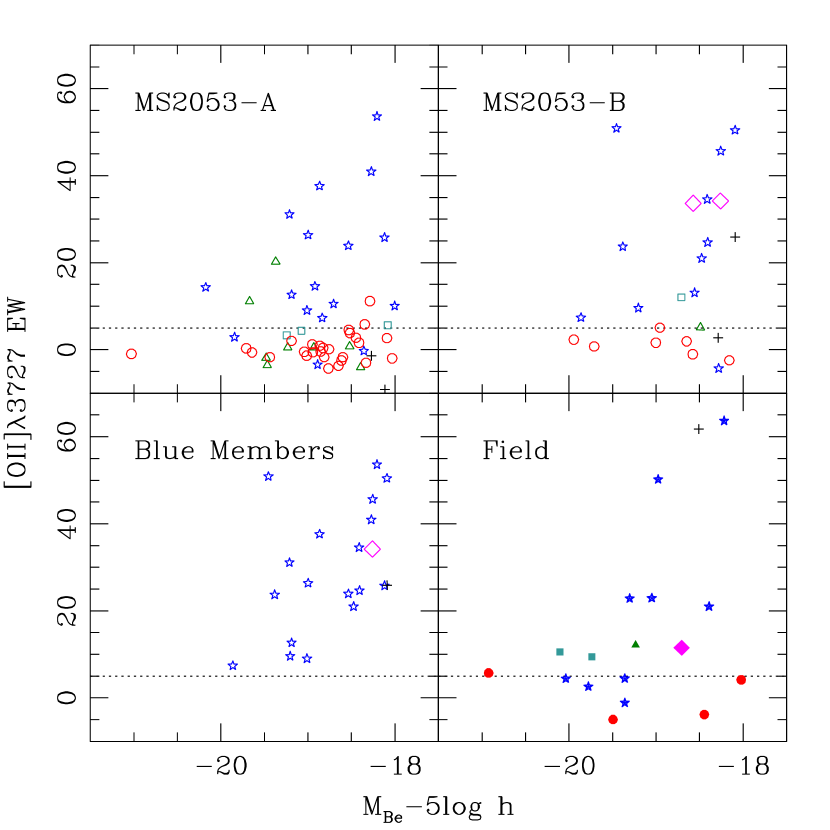
In Fig. 12, we show the distribution of [OII] equivalent width versus absolute magnitude as a function of morphological type for both the cluster members and field sample; we consider only galaxies with that have HST/WFPC2 imaging. Not surprisingly, the majority of early-type galaxies in both environments are absorption line ([OII]Å) systems while the majority of the late-types are emission line ([OII]Å) galaxies. Note the trend in the blue galaxies of increasing [OII] with decreasing luminosity; this trend is signficant at the % level using the Spearman rank test (Press et al. 1992).
One striking result from Fig. 12 is that all of the blue galaxies in MS2053 are emission line systems (Fig. 12), forming stars, and virtually all of them are spirals. However, not all of the emission line members are blue. In fact, there are 15 star-forming members that are red, and they include early-types and S0/a’s; these may be the dusty, star-forming members discussed in Poggianti et al. (1999). Although blue colors do identify star-forming members, using colors alone underestimates the total star formation activity in the cluster.
8.4 Infalling Galaxies vs. the Field
Results from several studies suggest that infall does not induce excess star formation in the infalling galaxies relative to the field (Balogh et al. 1997; Ellingson et al. 2001; Kodama & Bower 2001). To test if this is the case in MS2053, we compare the [OII] and Balmer EW distributions of galaxies in MS2053-B to those in the field. We consider only the galaxies in MS2053-B because we are relatively confident that they are falling into the cluster for the first time, whereas this is not the case if we include galaxies from MS2053-A. To enable comparison to §6 and §7, we adopt our usual magnitude limit () and requirement of WFPC2 imaging.
In terms of their [OII] and Balmer EW’s, a K-S test finds MS2053-B’s galaxies share a common parent population with the field galaxies. Assuming [OII] and Balmer EW traces star formation in the same manner in both environments, we find no indication of enhanced activity in MS2053-B’s galaxies relative to the field. However, we note that we cannot say whether star formation is enhanced later as MS2053-B and MS2053-A continue to merge.
As shown here, the similarities between the infalling galaxies and those in the field are not limited to their photometric properties (see §7.3). Their [OII] and Balmer EW distributions are indistinguishable, and their average [OII] EW are the same: Å and Å for MS2053-B and the field respectively. In comparison, the average [OII] EW of MS2053-A is times lower (Å), and its [OII] EW distribution differs from that of the field at the % confidence level. More than half of MS2053’s star-forming members belong to the infalling structure (MS2053-B), and the infalling galaxies are spectroscopically indistinguishable from that of the field population.
9 Descendants of Blue Cluster Galaxies
Having established that MS2053’s elevated fraction of blue/star-forming galaxies is due primarily to an infalling structure, we now address what the descendants of these blue galaxies can be. Are these new members the progenitors of the S0 galaxies found in nearby clusters? In the following discussion, we consider blue galaxies from MS2053-A and MS2053-B together, and adopt our usual magnitude limit () and requirement of WFPC2 imaging.
Similar to what has been observed in other intermediate redshift clusters (Couch et al. 1998), we find MS2053’s blue galaxies tend to be fainter than . None are brighter than (see Fig. 10), and their average absolute magnitude is . The luminosities of MS2053’s blue cluster galaxies indicate they will evolve into members with . Assuming the blue cluster galaxies evolve passively with time, they will fade and redden to eventually populate the faint end of the CM relation, as suggested by Kodama & Bower (2001).
The estimated internal velocity dispersions () of the blue cluster galaxies also indicates they will remain low mass systems. With only one exception, all of the blue galaxies in MS2053 have km s-1 (see Fig. 11); these blue galaxies cannot evolve into massive cluster members. Their low are consistent with De Propris et al. (2003)’s suggestion that the B-O effect is largely due to low mass, star-forming galaxies.
MS2053 has an unusual morphological mix of galaxies compared to clusters at : it has no S0’s but it has twice the number of blue spirals compared to clusters at lower redshifts. Note that a deficit of S0’s has also been observed in other clusters at intermediate redshifts (Dressler et al. 1997; Lubin et al. 2002). Assuming MS2053 will eventually have a galaxy population similar to that of equally massive clusters at lower redshifts, CL1358 or Coma, this means that MS2053 must develop a sizeable population of S0 galaxies within the next Gyr. Given its high fraction of blue spirals, the obvious solution is to transform these late-types into the missing S0 population.
The conversion in MS2053 of the blue cluster galaxies into faint, low mass S0’s would be consistent with the luminosity-weighted ages of low mass S0 galaxies in Coma (Poggianti et al. 2001). Although the ellipticals in Coma have been quiescent over the last Gyr, more than 40% of the S0’s have formed stars during the same period and so have younger luminosity-weighted ages. In addition, the fraction of S0’s in Coma with recent activity increases with decreasing luminosity. This latter point is consistent with our observed trend in MS2053’s blue galaxies of increasing [OII] EW with decreasing luminosity, lower mass blue cluster members have younger luminosity-weighted ages.
Our analysis shows that the blue cluster galaxies can be the missing link between the deficit of S0’s observed at intermediate redshifts and their relative abundance in the local universe. Not only does MS2053 have an overabundance of blue, low mass spirals, their spectral properties are consistent with the extended star formation histories observed in low mass cluster S0’s at lower redshifts. Although they originated in the field, these blue galaxies are the likely progenitors of many of the S0 galaxies seen in nearby clusters.
Finally, our results highlight a serious problem that still remains. Although we have established the link between blue cluster galaxies and low mass S0 members, our analysis does not account for the many bright () S0 galaxies in nearby clusters. This may be partially due to the difficulty of separating S0’s from ellipticals at higher redshift, some of MS2053’s S0 galaxies may have been visually classified as ellipticals. Evolutionary effects can also increase the number of luminous S0’s in MS2053. For example, there are several bright, red, massive spirals in MS2053 (see Figs. 10 & 11) that are viable progenitors of the luminous S0’s at lower redshift. We have also identified several bright, red, massive, passive spirals in MS 1054–03 (; Tran et al. 2003a) that may be the progenitors of massive cluster S0’s at . However, we stress that our current analysis does not address the origin of the bright S0 galaxies in nearby clusters.
10 Conclusions
We have studied the galaxy populations in MS2053 using high resolution, wide-field imaging from HST/WFPC2 and an extensive spectroscopic survey completed with Keck/LRIS. MS2053 is an X-ray lumininous cluster at with a bimodal redshift distribution. It is composed of a main cluster (MS2053-A) and an infalling structure (MS2053-B) that are gravitationally bound to each other. Of the 149 spectroscopically confirmed cluster members, 113 belong to MS2053-A and 36 to MS2053-B. The velocity dispersions of MS2053-A and MS2053-B are km s-1 and km s-1, and the total dynamical mass of the system is . MS2053 also lenses a background galaxy at .
MS2053 is a classic Butcher-Oemler cluster: 24% of its members are blue galaxies, and an even higher fraction (44%) are star-forming. However, more than half of the blue/star-forming members belong to the infalling structure (MS2053-B). Unlike previous studies that have found only indirect evidence for the link between the Butcher-Oemler effect and galaxy infall, our unique dataset enables us to show conclusively that this is the case in MS2053.
Comparing MS2053’s infalling galaxies to a field sample at approximately the same redshift, we find that they share a common parent population. Galaxies in MS2053-B span the same ranges in luminosity, color, estimated velocity dispersion ( mass), and [OII] equivalent width as those in the field. Not only is MS2053’s fraction of blue/star-forming members boosted due to an infalling component, the galaxies in MS2053-B are indistinguishable from that of the field population. We do not find any evidence of enhanced star formation in the infalling galaxies relative to the field, although we note this may change as MS2053-A and MS2053-B continue to merge.
Given that MS2053 currently has no S0 galaxies but rather an overabundance of blue, star-forming, low mass late-types, it is very likely that many of these spirals will evolve into low mass S0 galaxies. Such a scenario is consistent with the extended star formation histories of low mass S0’s in lower redshift clusters. If MS2053’s blue galaxies do evolve into S0’s, their luminosities and estimated internal velocity dispersions indicate they will be faint (), low mass members.
Taken as a whole, our observations suggest that most of the blue members in MS2053, and ultimately most of its low mass S0’s, originate in the field.
References
- Abraham et al. (1996) Abraham, R. G., Smecker-Hane, T. A., Hutchings, J. B., Carlberg, R. G., Yee, H. K. C., Ellingson, E., Morris, S., Oke, J. B., & Rigler, M. 1996, ApJ, 471, 694
- Andreon (1998) Andreon, S. 1998, ApJ, 501, 533
- Balogh et al. (2002) Balogh, M., Bower, R. G., Smail, I., Ziegler, B. L., Davies, R. L., Gaztelu, A., & Fritz, A. 2002, MNRAS, 337, 256
- Balogh et al. (1997) Balogh, M. L., Morris, S. L., Yee, H. K. C., Carlberg, R. G., & Ellingson, E. 1997, ApJ, 488, L75+
- Balogh et al. (2000) Balogh, M. L., Navarro, J. F., & Morris, S. L. 2000, ApJ, 540, 113
- Beers et al. (1990) Beers, T. C., Flynn, K., & Gebhardt, K. 1990, AJ, 100, 32
- Beers et al. (1982) Beers, T. C., Geller, M. J., & Huchra, J. P. 1982, ApJ, 257, 23
- Bertin & Arnouts (1996) Bertin, E. & Arnouts, S. 1996, A&A, 117, 393
- Biviano et al. (2002) Biviano, A., Katgert, P., Thomas, T., & Adami, C. 2002, A&A, 387, 8
- Butcher & Oemler (1978) Butcher, H. & Oemler, A. 1978, ApJ, 219, 18
- Butcher & Oemler (1984) —. 1984, ApJ, 285, 426
- Caldwell & Rose (1997) Caldwell, N. & Rose, J. A. 1997, AJ, 113, 492
- Couch et al. (1998) Couch, W. J., Barger, A. J., Smail, I., Ellis, R. S., & Sharples, R. M. 1998, ApJ, 497, 188
- Couch et al. (1994) Couch, W. J., Ellis, R. S., Sharples, R. M., & Smail, I. 1994, ApJ, 430, 121
- Couch & Sharples (1987) Couch, W. J. & Sharples, R. M. 1987, MNRAS, 229, 423
- De Propris et al. (2003) De Propris, R., Stanford, S. A., Eisenhardt, P. R., & Dickinson, M. 2003, ApJ, 598, 20
- Dressler (1980) Dressler, A. 1980, ApJ, 236, 351
- Dressler & Gunn (1992) Dressler, A. & Gunn, J. E. 1992, ApJS, 78, 1
- Dressler et al. (1997) Dressler, A., Oemler, A. J., Couch, W. J., Smail, I., Ellis, R. S., Barger, A., Butcher, H., Poggianti, B. M., & Sharples, R. M. 1997, ApJ, 490, 577
- Dressler et al. (1994) Dressler, A., Oemler, A. J., Sparks, W. B., & Lucas, R. A. 1994, ApJ, 435, L23
- Dressler & Shectman (1988) Dressler, A. & Shectman, S. A. 1988, AJ, 95, 985
- Ellingson et al. (2001) Ellingson, E., Lin, H., Yee, H. K. C., & Carlberg, R. G. 2001, ApJ, 547, 609
- Fabricant et al. (2000) Fabricant, D., Franx, M., & van Dokkum, P. 2000, ApJ, 539, 577
- Fairley et al. (2002) Fairley, B. W., Jones, L. R., Wake, D. A., Collins, C. A., Burke, D. J., Nichol, R. C., & Romer, A. K. 2002, MNRAS, 330, 755
- Fasano et al. (2000) Fasano, G., Poggianti, B. M., Couch, W. J., Bettoni, D., Kjærgaard, P., & Moles, M. 2000, ApJ, 542, 673
- Fisher et al. (1998) Fisher, D., Fabricant, D., Franx, M., & van Dokkum, P. 1998, ApJ, 498, 195+
- Hoekstra et al. (2002) Hoekstra, H., Franx, M., Kuijken, K., & van Dokkum, P. G. 2002, MNRAS, 333, 911+
- Kauffmann (1995) Kauffmann, G. 1995, MNRAS, 274, 153
- Kelson (1998) Kelson, D. D. 1998, Ph.D. thesis, University of California at Santa Cruz (Santa Cruz, CA: University of California)
- Kelson et al. (2000) Kelson, D. D., Illingworth, G. D., van Dokkum, P. G., & Franx, M. 2000, ApJ, 531, 184
- Kodama & Bower (2001) Kodama, T. & Bower, R. G. 2001, MNRAS, 321, 18
- Kodama et al. (2001) Kodama, T., Smail, I., Nakata, F., Okamura, S., & Bower, R. G. 2001, ApJ, 562, L9
- Kurtz et al. (1992) Kurtz, M. J., Mink, D. J., Wyatt, W. F., Fabricant, D. G., Torres, G., Kriss, G. A., & Tonry, J. L. 1992, in Astronomical Data Analysis Software and Systems I, ed. d. M. Worrall, C. Biemesderfer, & J. Barnes, Vol. 25 (A.S.P. Conference Series), 432
- Lavery & Henry (1986) Lavery, R. J. & Henry, J. P. 1986, ApJ, 304, L5
- Lavery & Henry (1988) —. 1988, ApJ, 330, 596
- Lavery et al. (1992) Lavery, R. J., Pierce, M. J., & McClure, R. D. 1992, AJ, 104, 2067
- Lubin (1996) Lubin, L. M. 1996, AJ, 112, 23
- Lubin et al. (2002) Lubin, L. M., Oke, J. B., & Postman, M. 2002, AJ, 124, 1905
- Luppino & Gioia (1992) Luppino, G. A. & Gioia, I. M. 1992, A&A, 265, L9
- Margoniner & de Carvalho (2000) Margoniner, V. E. & de Carvalho, R. R. 2000, AJ, 119, 1562
- Martini et al. (2002) Martini, P., Kelson, D. D., Mulchaey, J. S., & Trager, S. C. 2002, ApJ, 576, L109
- Mushotzky & Scharf (1997) Mushotzky, R. & Scharf, C. A. 1997, ApJ, 482, L13
- Newberry et al. (1988) Newberry, M. V., Kirshner, R. P., & Boroson, T. A. 1988, ApJ, 335, 629
- Norman et al. (2004) Norman, C., Ptak, A., Hornschemeier, A., Hasinger, G., Bergeron, J., Comastri, A., Giacconi, R., Gilli, R., Glazebrook, K., Heckman, T., Kewley, L., Ranalli, P., Rosati, P., Szokoly, G., Tozzi, P., Wang, J., Zheng, W., & Zirm, A. 2004, ApJ, 607, 721
- Oke et al. (1995) Oke, J. B., Cohen, J. G., Carr, M., Cromer, J., Dingizian, A., Harris, F. H., Labrecque, S., Luciano, R., Schaal, W., Epps, H., & Miller, J. 1995, PASP, 107, 375
- Pence (1976) Pence, W. 1976, ApJ, 203, 39
- Poggianti et al. (2001) Poggianti, B. M., Bridges, T. J., Carter, D., Mobasher, B., Doi, M., Iye, M., Kashikawa, N., Komiyama, Y., Okamura, S., Sekiguchi, M., Shimasaku, K., Yagi, M., & Yasuda, N. 2001, ApJ, 563, 118
- Poggianti et al. (1999) Poggianti, B. M., Smail, I., Dressler, A., Couch, W. J., Barger, A. J., Butcher, H., Ellis, R. S., & Oemler, A. J. 1999, ApJ, 518, 576
- Press et al. (1992) Press, W. H., Teukolsky, S. A., Vetterling, W. T., & Flannery, B. P. 1992, Numerical recipes in FORTRAN. The art of scientific computing (Cambridge: University Press, —c1992, 2nd ed.)
- Rakos & Schombert (1995) Rakos, K. D. & Schombert, J. M. 1995, ApJ, 439, 47
- Ramella et al. (1989) Ramella, M., Geller, M. J., & Huchra, J. P. 1989, ApJ, 344, 57
- Schlegel et al. (1998) Schlegel, D. J., Finkbeiner, D. P., & Davis, M. 1998, ApJ, 500, 525+
- Simard et al. (2002) Simard, L., Willmer, C. N. A., Vogt, N. P., Sarajedini, V. L., Phillips, A. C., Weiner, B. J., Koo, D. C., Im, M., Illingworth, G. D., & Faber, S. M. 2002, ApJS, 142, 1
- Smail et al. (2001) Smail, I., Kuntschner, H., Kodama, T., Smith, G. P., Packham, C., Fruchter, A. S., & Hook, R. N. 2001, MNRAS, 323, 839
- Stocke et al. (1991) Stocke, J. T., Morris, S. L., Gioia, I. M., Maccacaro, T., Schild, R., Wolter, A., Fleming, T. A., & Henry, J. P. 1991, ApJS, 76, 813
- Tran et al. (2003a) Tran, K. H., Franx, M., Illingworth, G., Kelson, D. D., & van Dokkum, P. 2003a, ApJ, 599, 865
- Tran et al. (2004) Tran, K. H., Franx, M., Illingworth, G. D., van Dokkum, P., Kelson, D. D., & Magee, D. 2004, ApJ, 609, 683
- Tran et al. (1999) Tran, K. H., Kelson, D. D., van Dokkum, P., Franx, M., Illingworth, G. D., & Magee, D. 1999, ApJ, 522
- Tran et al. (2003b) Tran, K. H., Simard, L., Illingworth, G., & Franx, M. 2003b, ApJ, 590, 238
- Valdes (1982) Valdes, F. 1982, Faint Object Classification and Analysis System Manual
- van Dokkum & Franx (1996) van Dokkum, P. G. & Franx, M. 1996, MNRAS, 281, 985
- van Dokkum et al. (2000) van Dokkum, P. G., Franx, M., Fabricant, D., Illingworth, G. D., & Kelson, D. D. 2000, ApJ, 541, 95
- van Dokkum et al. (1998a) van Dokkum, P. G., Franx, M., Kelson, D. D., & Illingworth, G. D. 1998a, ApJ, 504, L17
- van Dokkum et al. (1998b) van Dokkum, P. G., Franx, M., Kelson, D. D., Illingworth, G. D., Fisher, D., & Fabricant, D. 1998b, ApJ, 500, 714+
- Vikhlinin et al. (2002) Vikhlinin, A., VanSpeybroeck, L., Markevitch, M., Forman, W. R., & Grego, L. 2002, ApJ, 578, L107
- Wuyts et al. (2004) Wuyts, S., van Dokkum, P. G., Kelson, D. D., Franx, M., & Illingworth, G. D. 2004, ApJ, 605, 677
- Yee et al. (1996) Yee, H. K. C., Ellingson, E., & Carlberg, R. G. 1996, ApJS, 102, 269+


| Group | Number | -range | (km s-1) | (Mpc)bbVirial radii and masses determined using , and km s-1 Mpc-1 cosmology. | ()bbVirial radii and masses determined using , and km s-1 Mpc-1 cosmology. | |
|---|---|---|---|---|---|---|
| MS2053-AllaaNote that when considering all cluster members, the velocity dispersion and virial mass are both significantly overestimated due to MS2053’s bimodal redshift distribution. | 149 | 1.15 | ||||
| MS2053-A | 113 | 1.07 | ||||
| MS2053-B | 36 | 1.13 | ||||
| Field | 38 |
| Property | MS2053-All | MS2053-A | MS2053-B | Field |
|---|---|---|---|---|
| NumberbbThe total number of galaxies where the number in parentheses corresponds to the number that are visually typed into Hubble classes. | 89 (84) | 63 (60) | 26 (24) | 18 (17) |
| E/S0 | 37 | 29 | 8 | 4 |
| S0/a | 10 | 9 | 1 | 1 |
| Sa | 5 | 4 | 1 | 1 |
| Spiral | 30 | 18 | 12 | 9 |
| Merger | 2 | 0 | 2 | 1 |
| Early-Types ccThe early-type fraction is determined by combining all the E/S0 members () with half of the S0/a members (). The late-type fraction is all members with combined with half of the S0/a’s. | 50% | 56% | 35% | 26% |
| Late-Types ccThe early-type fraction is determined by combining all the E/S0 members () with half of the S0/a members (). The late-type fraction is all members with combined with half of the S0/a’s. | 50% | 44% | 65% | 74% |
| Red [] | 76% | 87% | 54% | 44% |
| Blue [] | 24% | 13% | 46% | 56% |
| Absorption LineddSpectral types are defined as emission line ([OII]Å), passive ([OII]Å), and E+A ((HHÅ, [OII]). | 51% | 60% | 29% | 39% |
| Emission LineddSpectral types are defined as emission line ([OII]Å), passive ([OII]Å), and E+A ((HHÅ, [OII]). | 44% | 34% | 67% | 61% |
| E+AddSpectral types are defined as emission line ([OII]Å), passive ([OII]Å), and E+A ((HHÅ, [OII]). | 5% | 5% | 4% | 0% |