Elemental Abundances in Two High Column Density Damped Lyman Alpha Systems at 11affiliation: Based on data obtained with the NASA/ESA Hubble Space Telescope operated by STScI-AURA under NASA contract NAS 5-26555.
Abstract
We present Keck/HIRES abundance measurements and metal-line kinematic profiles of the damped Lyman alpha systems (DLAs) towards the quasars Q0933+733 () and Q0948+433 (). These two DLAs have among the five highest H I column densities at any redshift: cm-2. The metal-line data, presented here for the first time, reveal that these DLAs are noteworthy for several other reasons as well. 1) The Q0933+733 DLA exhibits simple kinematic structure with unusually narrow velocity widths as measured from its unsaturated metal lines ( km s-1). At 2.6% solar, it has the second lowest metallicity at . 2) The Q0948+433 DLA has among the strongest metal-line transitions of any known DLA. The saturated Si II 1808 line implies a high metallicity ([Si/H]) and a significant -enhancement. The strong metal lines of this DLA have made possible the detection of Ti II 1910, Co II 2012, and Mg I 2026. 3) We find that the relative gas-phase abundances of both DLAs follow the general trend seen at high redshift, e.g., enhanced Zn/Fe and Si/Fe, and sub-solar Mn/Fe, indicating that there is little evolution in the nucleosynthetic patterns of DLAs down to this epoch. 4) Their high H I column densities imply that these DLAs dominate the column density-weighted cosmic mean metallicity, , of the universe at . Using the 15 DLAs with measured metallicities in the redshift interval , we find , where the uncertainties are 95% confidence limits.
1 Introduction
It has been known for almost two decades now that damped Lyman alpha systems (DLAs) seen in the spectra of background quasars trace the neutral gas content of the universe back to the redshifts of the most distant quasars (Wolfe et al. 1986). This fact has since been exploited to study the evolution of the neutral gas content of the universe (e.g., Lanzetta et al. 1991, Peroux et al. 2003, Rao & Turnshek 2000 [RT00], Storrie-Lombardi & Wolfe 2000; Prochaska & Herbert-Fort 2004) and its chemical enrichment history (e.g., Pettini et al. 1999, Prochaska et al. 2003b, and references therein). Until recently, however, the rarity of DLAs in combination with the requirement of the Hubble Space Telescope to discover them at redshifts has meant that most of our knowledge about the galaxies that contain the bulk of the neutral gas has come from objects that span only the first 30% of the age of the universe.
High resolution spectrometers on 10m-class telescopes have been instrumental in advancing our knowledge about the detailed abundance patterns and kinematic properties of DLAs (e.g. Pettini et al. 1999; Pettini et al. 2000; Molaro et al. 2000; Prochaska et al. 2001; Ledoux, Bergeron, & Petitjean 2002; Prochaska & Wolfe 2002; Dessauges-Zavadsky et al. 2004). This work has mainly concentrated on the large sample of DLAs known to date. With the success of UV surveys for DLAs at redshifts (RT00; Rao, Turnshek, & Nestor 2004), the number of DLAs available for study at these redshifts has been steadily increasing and it is now becoming possible to fill in the large gap in cosmic time between today and . The importance of studying low-redshift DLAs cannot be understated: these systems bridge the gap between our knowledge of present-day galaxies and high-redshift DLAs. The low-redshift systems are the only population (currently) of cosmological objects for which the neutral gas content, abundances, and kinematic properties obtained via high resolution spectroscopy can be compared with observable galaxy properties such as morphology and star formation history.
To date, only a handful of DLAs have been observed with high resolution spectroscopy (e.g. Pettini et al., 1999, 2000). These observations showed that the abundance ratios and general kinematic properties of lower-redshift DLAs are similar to those at higher redshift. Here we add to the growing list of DLA abundance measurements at with Keck/HIRES data on the DLAs towards the quasars Q0933+733 () and Q0948+433 (). With cm-2 (§2.1), these two DLAs rank among the five highest H I column density systems known. High column density DLAs are important for follow-up metallicity observations for two reasons. First, their high column density may allow the measurement of weak lines rarely observed in DLAs. For example, we report a detection of Co II in the Q0948+433, , DLA (§3.2). This is the second detection of Co to date (Ellison, Ryan, & Prochaska, 2001) and the most secure. Its detection promises the observation of weak transitions of even rarer elements (e.g., Cu, Ga, B, etc.). Second, the highest column density DLAs dominate the determination of cosmic metallicity since cosmic metallicity is given by an H I column density-weighted mean. Thus, the current measurement of the cosmological mean metallicity in neutral gas at is dominated by these two DLAs. This paper is organized as follows. In §2 we describe the observations and data reduction techniques. The metal-line profiles and chemical abundances of the two DLAs are presented in §3. We conclude with a discussion in §4.
2 Observations
2.1 HST data
2.1.1 Q0933+733
HST-UV spectroscopic data for Q0933+733 were obtained as part of a Cycle 6 survey for DLAs in known Mg II absorption-line systems (HST PID 6577, S. Rao PI; RT00). This quasar has two strong Mg II systems along the sightline at and (Steidel & Sargent 1992). Figure 10 of RT00 shows the HST-FOS G270H grating spectrum of Q0933+733. Since the Ly profiles of the two absorbers are blended with each other and with a Lyman limit edge, the H I column density of the DLA at was determined using the Ly absorption line (see figure 11 of RT00), and was found to be cm-2. The higher redshift system, which also has detectable Ly absorption, has an H I column density cm-2 (Rao et al. 2004) just below the DLA criterion, and we reserve an analysis of this absorber to a future paper. The uncertainty in these two column density measurements reflects the low signal-to-noise ratio of the spectrum near the Ly lines.
2.1.2 Q0948+433
This quasar was observed with HST-STIS as part of another DLA survey for strong Mg II absorption-line systems found in optical spectra of quasars (HST PID 9051, R. Becker PI). The data, which we obtained from the HST public archive, consist of two exposures taken with the G230L grating for a total of 2,333 seconds. We combined the two sub-exposures using a weighted average based on exposure time and combined the error arrays accordingly. We then normalized the resulting spectrum using standard routines in IRAF. Since there are Lyman limit edges in this spectrum, only a local continuum near the DLA line was determined. Part of the normalized HST archive spectrum encompassing the DLA line is shown in Figure 1. As is usually the case for high column density DLA lines, the Ly forest populates the DLA trough making it very difficult to use a routine such as least squares minimization to fit a Voigt profile to the data. Therefore, the best ‘fit’ was estimated by eye. A Voigt profile with column density cm-2 convolved with the Gaussian line spread function of the HST-STIS G230L grating is shown as the dotted line in Figure 1. The uncertainty in the column density determination, cm-2 in this case, is dominated by the error in continuum placement and was estimated using the procedure described in RT00.
2.2 Keck/HIRES data
Q0933+733 and Q0948+433 were observed with Keck/HIRES (Vogt et al., 1994) on UT 2003 March 11 and 12 for a total integration time of 5,400s each. For both sets of observations, we implemented the C1 decker (0.86′′ width; FWHM km s-1 resolution) and the kv380 filter to block second order light. Data reduction and calibration proceeded in standard fashion (e.g. Prochaska et al., 2001) with the MAKEE reduction package kindly provided by T. Barlow. The data were continuum fit with custom software and rebinned to 2 km s-1 per pixel. The signal-to-noise ratio of these data exceeds 20 per pixel for the majority of the Q0933+733 spectrum and is greater than per pixel redward of 4500Å in the Q0948+433 spectrum.
3 Metal-Line Profiles and Chemical Abundances
All of the ionic column densities were derived with the apparent optical depth method (AODM; Savage & Sembach, 1991; Jenkins, 1996). This technique can be used to identify hidden saturation by comparing the apparent column densities of multiple transitions from a single ion. This technique also gives an efficient, non-parametric means of calculating total column densities for each ion. For those transitions where the profile saturates in at least one pixel (i.e., normalized flux ), the column densities are listed as lower limits. We report non-detections as statistical upper limits. We have ignored continuum error in our analysis which may dominate the measurements of very weak transitions. We estimate a systematic error in most cases due to continuum placement. We calculate ionic column densities for each transition and assign final column densities by calculating the weighted-mean for ions with multiple transitions. In the velocity plots, is chosen arbitrarily and corresponds to the redshift listed in the figure caption. We indicate regions of blending, primarily through blends with other metal-line systems or the Ly forest, by plotting with dotted lines.
The atomic data considered in this paper are listed in Table Elemental Abundances in Two High Column Density Damped Lyman Alpha Systems at 11affiliation: Based on data obtained with the NASA/ESA Hubble Space Telescope operated by STScI-AURA under NASA contract NAS 5-26555.. Table 2 gives our assumed solar abundance data compiled by Grevesse & Sauval (1999).
3.1 Q0933+733; z=1.479
The metal line profiles of this DLA are shown in Figure 2. The profiles are remarkably narrow with a velocity width km s-1, where is the interval encompassing 90% of the total optical depth (Prochaska & Wolfe, 1997), and is measured using the unsaturated Zn II 2026 profile. This is among the lowest value recorded for a DLA (Prochaska & Wolfe, 2001). We also note a likely ’edge-leading asymmetry’ for the profiles towards positive velocities in the unsaturated metal lines, consistent with rotation. This characterization, however, is limited by the fact that the profile is only resolution elements wide.
We have integrated the line profiles using the AODM to calculate the ionic column densities given in Table 3. Columns 1 and 2 list the ion and rest wavelength, column 3 gives the column density, column 4 is the weighted mean column density determined from multiple absorption lines of the same ion, and is listed alongside the first occurrence of the ion, and column 5 is the derived abundance relative to solar. Comparisons of multiple transitions from a given ion (e.g. Cr II) are in reasonable agreement and there is no indication of line saturation. We note, however, that the Cr II 2062 and Zn II 2062 column densities are lower than their partner transitions which may indicate that the continuum level is systematically low in this region.
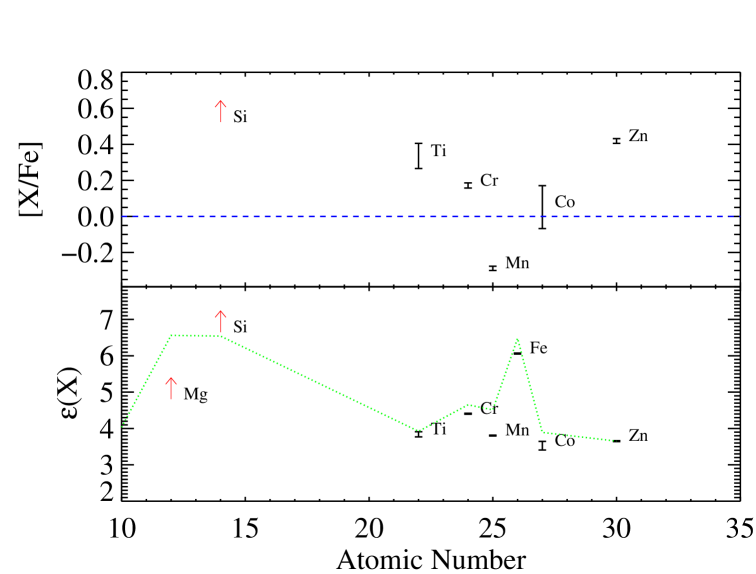
Measurements of Zn and Si indicate a metallicity solar which falls dex below the mean metallicity at . The value lies at the lower end of the DLA metallicity distribution at these redshifts and is the second lowest value recorded at . Figure 3 describes the relative abundances for this DLA system. As is standard practice in stellar abundance studies, and now generally adopted to describe DLA abundances, we plot measured abundances relative to Fe (top panel). This comparison serves to illustrate the combined effects of dust depletion and nucleosynthesis (e.g. Prochaska & Wolfe, 2002). The bottom panel gives the absolute abundances on a logarithmic scale where hydrogen has value 12.0. In both cases we present gas-phase abundances, i.e., the observed values uncorrected for depletion.
Similar to the results for other DLAs (Pettini et al., 1999) and the majority of DLAs (Prochaska & Wolfe, 2002), this DLA shows modest enhancements of Zn and Si relative to Fe. These enhancements are suggestive of differential depletion and/or nucleosynthetic processes, and it is difficult to disentangle the two effects. The Cr/Fe overabundance relative to solar is notable as it exceeds the value observed for Cr/Fe in the majority of Milky Way sightlines (e.g. Savage and Sembach, 1996). Prochaska & Wolfe (2002) reported a similar enhancement for their sample of high DLAs and suggested that it is a signature of nucleosynthesis. Interestingly, the enhancement runs contrary to the behavior of Cr in metal-poor halo stars where [Cr/Fe] decreases with [Fe/H] (McWilliam et al., 1995). Although this is only a modest departure from the solar ratio, it suggests differences in the yields of Fe-peak elements.
Finally, we note sub-solar Ti/Fe and Mn/Fe ratios. As emphasized by Dessauges-Zavadsky, Prochaska, & D’Odorico (2002), Mn and Ti are particularly valuable for disentangling the competing effects of nucleosynthesis and differential depletion. The sub-solar Ti/Fe ratio observed here is indicative of differential depletion, and is somewhat surprising given the low dust depletion levels implied by the relatively low Zn/Fe ratio. Perhaps the low Ti/Fe ratio is more reflective of grain core growth as opposed to grain mantle growth and, in turn, an important clue to the mechanism of grain formation in young, metal-poor galaxies (e.g., supernovae, red giant winds). In contrast to Ti, the observed low Mn/Fe ratio is a reflection of nucleosynthesis. The sub-solar value follows previous measurements of Mn/Fe (Pettini et al., 2000; Ledoux, Bergeron, & Petitjean, 2002) and supports the notion that Mn production is metallicity-dependent (McWilliam, Rich, & Smecker-Hane, 2003).
We note that except for Ti II and Fe II, the results of Khare et al. (2004) agree with our measurements for this DLA. Their Multiple Mirror Telescope (MMT) spectra do not have the high resolution and signal-to-noise ratio per pixel that characterize our Keck data. Thus, we believe that the Ti II column density is indeed an upper limit as shown in Table 3, rather than a confirmed detection as claimed by Khare et al. (2004). In addition, our Fe abundance is more secure since Khare et al. (2004) used the equivalent widths of lines measured by Steidel & Sargent (1992) and an assumed b parameter to estimate its column density.
3.2 Q0948+433; z=1.233
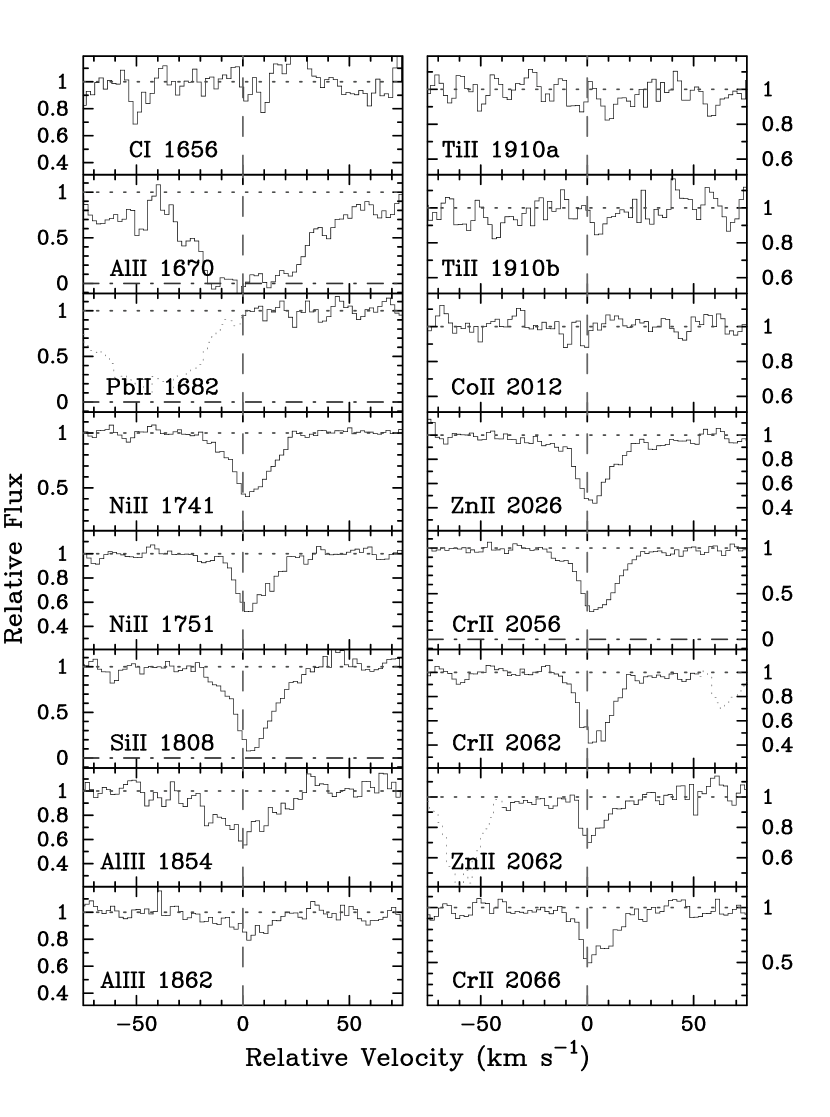
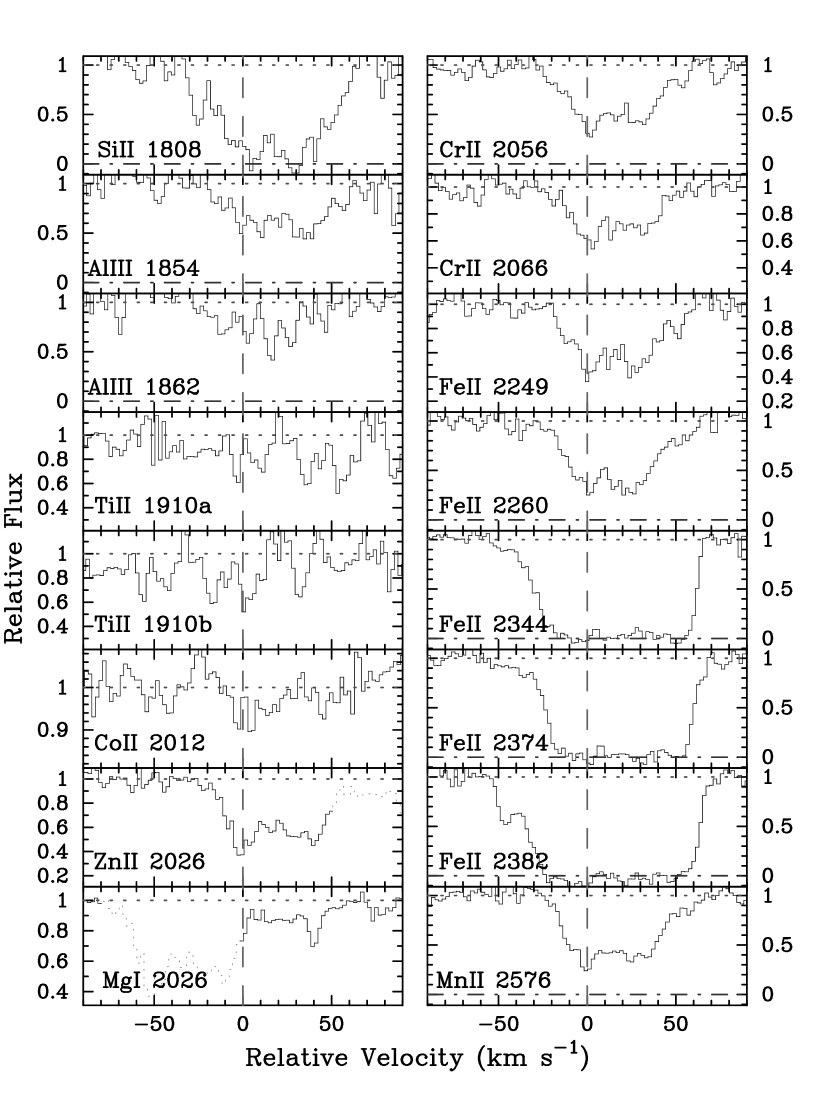
The metal line profiles of the damped Ly system at are shown in Figure 4. The line profiles show greater complexity than the DLA toward Q0933+733 although the observed velocity width ( km s-1) is still lower than the median value at . We also note that the line profiles show the ‘edge-leading’ characteristic of many high DLAs (Prochaska & Wolfe, 1997) and a mild asymmetry to the line profiles. Again, these characteristics are consistent with rotation.
The metal-line transitions of this DLA are among the strongest ever observed. Note, in particular, the saturated Si II 1808 profile which implies and [Si/H] dex. This Si II 1808 profile is deeper than that observed for almost any sightline through the Milky Way111Due to depletion of Si from the gas-phase in Milky Way sightlines with large and because sight lines observed in the Milky Way at high resolution tend to have lower .. We find, therefore, that this ‘metal-strong’ DLA shows positive detections of weak transitions like Ti II 1910, Co II 2012, and Mg I 2026. We note that for the Ti II 1910 doublet, we integrated the optical depth over both transitions and used the sum of the oscillator strengths to convert that optical depth to column density. The column densities for all of the detected transitions are listed in Table 4. We predict that the Cr II 2026 transition contributes to the Zn II 2026 profile and have ignored this blend in our analysis.
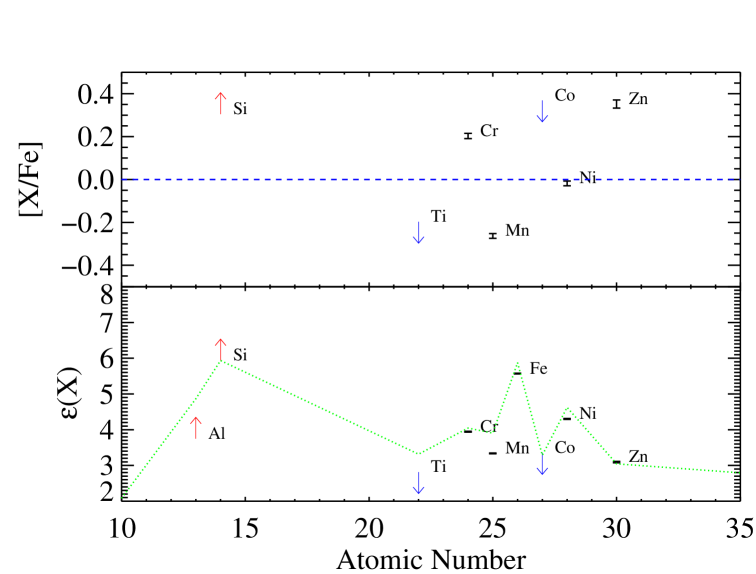
The relative abundances of this DLA are presented in Figure 5. The abundance pattern of Cr, Mn, Zn, and Fe is similar to that of the DLA system toward Q0933+733: Cr/Fe and Zn/Fe show modest enhancements and Mn/Fe is significantly underabundant. In addition, we report the second detection of Co to date. In contrast to the first detection of Co by Ellison et al. (2001) in the Q2206199 DLA system222But see Prochaska & Wolfe (2002) who do not consider this detection to be very secure., which is overabundant relative to Fe, we find a solar Co/Fe abundance ratio in the Q0948+433 DLA. Ellison et al. show that the overabundance in the Q2206199 DLA is consistent with the pattern seen in Galactic bulge stars. The solar Co/Fe ratio and observed metallicity (e.g., [Fe/H]) in the Q0948+433 DLA, on the other hand, are more typical of metal-rich Galactic halo stars (Gratton & Sneden 1991). While it is impossible to establish trends with only two systems, it is at least evident that their [Co/Fe] ratios fall within the locus traced by Galactic stars.
Perhaps the most interesting result of these observations is that both Si and Ti333One may view the Ti result cautiously because of the relatively poor S/N at the Ti II 1910 transitions. (the -elements) are significantly enhanced relative to Fe. Since Ti is more readily adsorbed onto dust grains than Fe (e.g. Savage and Sembach, 1996), differential depletion leads to negative values for [Ti/Fe]. Therefore, the observed enhancement (i.e., positive [Ti/Fe]) is not due to depletion, but implies a nucleosynthetic origin instead. This characteristic is, as in the case of the Co/Fe ratio discussed above, typical of Galactic halo stars (e.g., Gratton & Sneden, 1991). If one were to correct for differential depletion in this DLA, by using the Cr/Zn ratio for example, the dust-corrected Ti/Fe ratio may exceed +0.4 dex. Differential depletion could be invoked to explain the large Si/Fe ratio, but we emphasize that [Si/Zn] , and given the significant line saturation in Si II1808, the Si/Zn ratio may exceed +0.3 dex. Altogether, these relative abundances indicate a significant -enhancement in this modest metallicity gas. This result contradicts a primary conclusion of Pettini et al. (2000) who argued that the low DLA systems have solar /Fe ratios and therefore may not trace the bulk of star formation. We note that the abundance pattern and metallicity mirror those observed for the most metal-rich Galactic halo stars (e.g. Edvardsson et al., 1993) and the Galactic thick disk stars (Prochaska et al., 2000). Perhaps we are observing the by-products of the generation of star formation which immediately proceeds the formation of the galactic disk in this system, a speculation supported by the ’edge-leading’ nature of the metal-line profiles.
4 Discussion
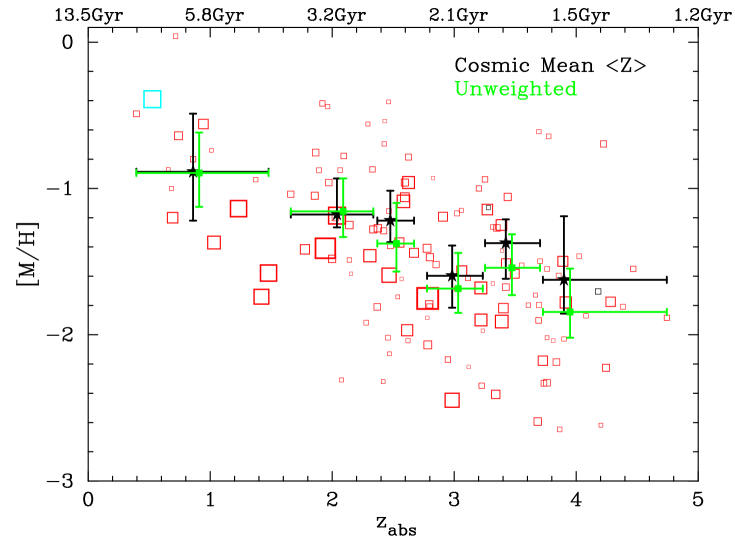
The DLAs towards Q0933+733 and Q0948+433 are unusual in several ways. At cm-2, their H I column densities are among the five highest at any redshift of over 150 DLAs with measured metallicities, and so they dominate the column density-weighted mean metallicity of the universe at . Here we update the Prochaska et al. (2003b) estimate of the column-density weighted mean metallicity for the redshift interval . We add the Q0933+733 DLA to the sample, and use a revised value for the H I column density of the Q0948+433 DLA. We also include the recent results of Turnshek et al. (2004) and Khare et al. (2004). Table 5 lists the data used to determine the column density-weighted mean metallicity, . We find at a median redshift of , where the uncertainties have been estimated using the bootstrap technique and are 95% confidence limits. This result is shown in Figure 6 along with high-redshift measurements from Prochaska et al. (2003b). The new low-redshift value of is in agreement with the value estimated by Prochaska et al. (2003b), but with significantly smaller uncertainty. We also confirm the trend of increasing metallicity with cosmic time and, from a least-squares fit to the values, derive a slope of .
The narrow velocity width of the Q0933+733 DLA, km s-1, implies a kinematically simple system, while the edge-leading asymmetries of the unsaturated lines reveal structure even on these small velocity scales. Although the metal line profiles of the Q0948+433 DLA have several components, their combined velocity width of km s-1 is still lower than the median value measured for DLAs. Both DLAs follow the trend first noted by Wolfe & Prochaska (1998), which is still evident in the larger sample of Prochaska et al. (2003a), that high DLAs tend to have smaller metal-line velocity widths. The compilation of 21 cm line widths by Kanekar & Chengalur (2003) indicates that a similar trend might be present between 21 cm line widths and . Additionally, Nestor et al. (2003) found a correlation between DLA metallicity and Mg II rest equivalent width, the latter being an indicator of the velocity spread along the line of sight. Thus, a comprehensive study of 21 cm absorption line properties, H I column densities, metallicities, and metal line profiles for DLAs in front of radio loud quasars might provide some insight into the nature of the individual cloud(s) that gives rise to a DLA system.
The high value of the Q0933+733 DLA ensures that many metal-line transitions are easily measured even at a metallicity as low as 2.6% solar (§3.1). This is the second lowest value recorded at . Even so, relative abundance patterns in this DLA are similar to results for other DLAs, implying that there is minimal evolution in the nucleosynthetic patterns for gas with [M/H] at this epoch.
Finally, the Q0948+433 DLA is characterized by the highly saturated Si II1808 line, which implies a high metallicity ([Si/H] ) and a significant -enhancement. The unusually strong lines of this DLA have made possible the detections of Ti II 1910, Co II 2012, and Mg I 2026, and we further predict that echelle observations to the atmospheric limit would reveal positive detections of transitions for Ga, P, Ge, Sn, and possibly Pb. Since the mean metallicity of the DLAs is observed to increase with decreasing redshift, a large sample of DLAs may be more likely to yield ‘metal-strong’ candidates. Therefore, surveys of these galaxies may be the most efficient approach to obtain comprehensive abundance pattern measurements of young galaxies, and given the recent loss of STIS on HST, emphasizes the need for a UV spectrograph in space.
References
- Bergeson & Lawler (1993) S.D. & Lawler, J.E. 1993, ApJ, 408, 382
- Bergeson & Lawler (1993b) Bergeson, S.D. & Lawler, J.E. 1993b, ApJ, 414, L137
- Bergeson, Mullman, & Lawler (1994) Bergeson, S.D., Mullman, K.L., & Lawler, J.E. 1993, ApJ, 435, L157
- Boisse et al. (1998) Boissé, P., Le Brun, V., Bergeron, J., & Deharveng, J.-M. 1998, A&A, 333, 841
- Churchill et al. (2000) Churchill, C. W., Mellon, R. R., & Charlton, J. C. et al. 2000, ApJS, 130, 91
- de la Varga et al. (2000) de la Varga, A., Reimers, D., Tytler, D., Barlow, T. A., & Burles, S. 2000, A&A, 363, 69
- Dessauges-Zavadsky, Prochaska, & D’Odorico (2002) J.X., & D’Odorico, S. 2002, A&A, 391, 801
- Dessauges-Zavadsky et al. (2004) Dessauges-Zavadsky, M., Calura, F., Prochaska, J.X., D’Odorico, S., & Matteucci, F. 2004, A&A, 416, 79
- Edvardsson et al. (1993) paper Edvardsson, B., Anderson, J., Gutasfsson, B., Lambert, D.L., Nissen, P.E., and Tompkin, J. 1993, A&A, 275, 101
- Ellison, Ryan, & Prochaska (2001) Ellison, S.L., Ryan, S., & Prochaska, J.X. 2001, MNRAS, 326, 628
- Fedchak, Wiese, & Lawler (2000) J. A., Wiese, L. M., & Lawler, J. E. 2000, ApJ, 538, 773
- Gratton & Sneden (1991) abundances Gratton, R.G. & Sneden, C. 1991, A&A, 241, 501
- Grevesse & Sauval (1999) Grevesse, N. & Sauval, A.J. 1999, A&A, 347, 348
- Jenkins (1996) Jenkins, E. B. 1996, ApJ, 471, 292
- Kanekar & Chengalur (2003) Kanekar, N., & Chengalur, J. N. 2003, A&A, 399, 857
- Khare et al. (2004) Khare, P., Kulkarni, V. P., Lauroesch, J. T., York, D. G., Crotts, A. P. S., & Nakamura, O. 2004, astro-ph/0408139
- Lanzetta et al. (1991) Lanzetta, K. M., Wolfe, A. M., Turnshek, D. A., Lu, L., McMahon, R. G., & Hazard, C. 1991, ApJS, 71, 1
- Ledoux, Bergeron, & Petitjean (2002) Ledoux, C., Bergeron, J., & Petitjean, P. 2002, A&A, 385, 802
- McWilliam et al. (1995) Paper II McWilliam, A., Preston, G.W., Sneden, C., & Searle,L. 1995, AJ, 109, 2757
- McWilliam, Rich, & Smecker-Hane (2003) McWilliam, A., Rich, R.M., & Smecker-Hane, T.A. 2003, ApJ, 592, L21
- Meyer, Lanzetta, & Wolfe (1995) Meyer, D. M., Lanzetta, K. M., & Wolfe, A. M. 1995, ApJ, 451, L13
- Molaro et al. (2000) Molaro, P., Bonifacio, P., Centurin, M., D’Odorico, S., Vladilo, G., Santin, P., & Di Marcantonio, P. 2000, ApJ, 541, 54
- Morton (1991) Morton, D.C. 1991, ApJS, 77, 119
- Morton (2004) Morton, D.C. 2004, priv. comm.
- Mullman et al. (1998) K. L., Lawler, J. E., Zsargo, J., & Federman, S. R. 1998, ApJ, 500, 1064
- Nestor et al. (2003) Nestor, D. B., Rao, S., Turnshek, D. A., & Vanden Berk, D. 2003, ApJ, 595, L5
- Péroux et al. (2003) Péroux, C., McMahon, R. G., Storrie-Lombardi, L. J., & Irwin, M. J. 2003, MNRAS, 346, 1103
- Pettini et al. (1999) Pettini, M., Ellison, S. L., Steidel, C. C., & Bowen, D. V. 1999, ApJ, 510, 576
- Pettini et al. (2000) Pettini, M., Ellison, S. L., Steidel, C. C., Shapley, A. E., & Bowen, D. V. 2000, ApJ, 532, 65
- Pettini et al. (2002) Pettini, M., Ellison, S. L., Bergeron, J., & Petitjean, P. 2002, A&A, 391, 21
- Prochaska et al. (2000) J. X., Naumov, S.O., Carney, B.W., McWilliam, A., & Wolfe, A.M. 2000, AJ, 120, 2513
- Prochaska et al. (2001) Prochaska, J.X., Wolfe, A.M., Tytler, D., Burles, S.M., Cooke, J., Gawiser, E., Kirkman, D., O’Meara, J.M., & Storrie-Lombardi, L. 2001, ApJS, 137, 21
- Prochaska & Wolfe (1997) Prochaska, J. X. & Wolfe, A. M. 1997, ApJ, 487, 73
- Prochaska & Wolfe (1998) Prochaska, J. X. & Wolfe, A. M. 1998, ApJ, 507, 113
- Prochaska & Wolfe (2001) Prochaska, J.X. & Wolfe, A.M. 2001, ApJ, 560, L33
- Prochaska & Wolfe (2002) Prochaska, J.X. & Wolfe, A.M. 2002, ApJ, 566, 68
- Prochaska & Herbert-Fort (2004) Prochaska, J.X. & Herbert-Fort, S. 2004, PASP, in press
- Prochaska et al. (2003a) Prochaska, J.X., Gawiser, E., Wolfe, A.M., Cooke, J., & Gelino, D. 2003a, ApJS, 147, 227
- Prochaska et al. (2003b) Prochaska, J.X., Gawiser, E., Wolfe, A.M., Castro, S., & Djorgovski, S.G. 2003b, ApJ, 595, L9
- Rao & Turnshek (2000) Rao, S., & Turnshek, D. 2000, ApJS, 130, 1 (RT00)
- Rao et al. (2004) Rao, S., Turnshek, D., & Nestor, D. 2004, in preparation
- Savage & Sembach (1991) Savage, B. D. and Sembach, K. R. 1991, ApJ, 379, 245
- Savage and Sembach (1996) Savage, B. D. and Sembach, K. R. 1996, ARA&A, 34, 279
- Steidel & Sargent (1992) Steidel, C. C., & Sargent, W. L. W. 1992, ApJS, 80, 1
- Storrie-Lombardi & Wolfe (2000) Storrie-Lombardi, L., & Wolfe, A. M. 2000, ApJ, 543, 552
- Turnshek et al. (2003) Turnshek, D. A., Rao, S. M., Ptak, A. F., Griffiths, R. E., & Monier, E. M. 2003, ApJ, 590, 730
- Turnshek et al. (2004) Turnshek, D. A., Rao, S. M., Nestor, D. B., Vanden Berk, D., Belfort-Mihaly, M., & Monier, E. M. 2004, ApJ, 609, L53
- Verner et al. (1994) Verner, D. A., Barthel, P. D., Tytler, D. 1994, A&AS, 108, 287
- Vladilo (2002) Vladilo, G. 2002, A&A, 391, 407
- Vogt et al. (1994) Vogt, S.S., Allen, S.L., Bigelow, B.C., Bresee, L., Brown, B., et al. 1994, SPIE, 2198, 362
- Wiese, Fedchak, & Lawler (2001) Wiese, L.M., Fedchak, J. A., & Lawler, J. E. 2001, ApJ, 547, 1178
- Wolfe et al. (1986) Wolfe, A. M., Turnshek, D. A., Smith, H. E., & Cohen, R. D. 1986, ApJS, 61, 249
- Wolfe & Prochaska (1998) Wolfe, A.M. & Prochaska, J.X. 1998, ApJ, 494, 15L
| Transition | Ref | ||
|---|---|---|---|
| CI 1656 | 1656.9283 | 0.1405 | 1 |
| AlII 1670 | 1670.7874 | 1.8800 | 1 |
| PbII 1682 | 1682.150 | 0.15636 | 1 |
| NiII 1741 | 1741.5531 | 0.0427 | 7 |
| NiII 1751 | 1751.9157 | 0.0277 | 7 |
| SiII 1808 | 1808.0130 | 0.00218600 | 11 |
| AlIII 1854 | 1854.7164 | 0.539 | 1 |
| AlIII 1862 | 1862.7895 | 0.268 | 1 |
| TiII 1910a | 1910.6000 | 0.202 | 12 |
| TiII 1910b | 1910.9380 | 0.098 | 12 |
| CoII 2012 | 2012.1664 | 0.03679 | 8 |
| ZnII 2026 | 2026.1360 | 0.489 | 13 |
| CrII 2026 | 2026.269 | 0.00471 | 15 |
| MgI 2026 | 2026.4768 | 0.1120 | 1 |
| CrII 2056 | 2056.2539 | 0.105 | 13 |
| CrII 2062 | 2062.2340 | 0.078 | 13 |
| ZnII 2062 | 2062.6640 | 0.256 | 13 |
| CrII 2066 | 2066.1610 | 0.0515 | 13 |
| FeII 2249 | 2249.8768 | 0.00182100 | 14 |
| FeII 2260 | 2260.7805 | 0.00244 | 14 |
| FeII 2344 | 2344.2140 | 0.114 | 3 |
| FeII 2374 | 2374.4612 | 0.0313 | 3 |
| FeII 2382 | 2382.7650 | 0.320 | 3 |
| MnII 2576 | 2576.8770 | 0.3508 | 1 |
| FeII 2586 | 2586.6500 | 0.0691 | 3 |
| MnII 2594 | 2594.4990 | 0.271 | 1 |
| FeII 2600 | 2600.1729 | 0.239 | 3 |
| MnII 2606 | 2606.462 | 0.1927 | 1 |
| MgII 2796 | 2796.3520 | 0.6123 | 15 |
| MgII 2803 | 2803.5310 | 0.3054 | 15 |
| MgI 2852 | 2852.9642 | 1.810 | 1 |
| Elm | Z | |
|---|---|---|
| H | 12.00 | 1 |
| B | 2.79 | 5 |
| Mg | 7.58 | 12 |
| Al | 6.49 | 13 |
| Si | 7.56 | 14 |
| S | 7.20 | 16 |
| Ti | 4.94 | 22 |
| Cr | 5.67 | 24 |
| Mn | 5.53 | 25 |
| Fe | 7.50 | 26 |
| Co | 4.91 | 27 |
| Ni | 6.25 | 28 |
| Zn | 4.67 | 30 |
| Ion | AODMa | [X/H] | ||
|---|---|---|---|---|
| H I | 1215.7 | |||
| C I | 1656.9 | |||
| Al II | 1670.8 | |||
| Al III | 1854.7 | |||
| Al III | 1862.8 | |||
| Si II | 1808.0 | |||
| Ti II | 1910.6 | |||
| Cr II | 2056.3 | |||
| Cr II | 2062.2 | |||
| Cr II | 2066.2 | |||
| Mn II | 2576.9 | |||
| Mn II | 2606.5 | |||
| Fe II | 2249.9 | |||
| Fe II | 2260.8 | |||
| Fe II | 2344.2 | |||
| Fe II | 2374.5 | |||
| Fe II | 2382.8 | |||
| Fe II | 2586.7 | |||
| Fe II | 2600.2 | |||
| Co II | 2012.2 | |||
| Ni II | 1741.6 | |||
| Ni II | 1751.9 | |||
| Zn II | 2026.1 | |||
| Zn II | 2062.7 | |||
| Pb II | 1682.2 |
| Ion | AODMa | [X/H] | ||
|---|---|---|---|---|
| H I | 1215.7 | |||
| Mg I | 2026.5 | |||
| Mg I | 2853.0 | |||
| Mg II | 2796.4 | |||
| Mg II | 2803.5 | |||
| Al III | 1854.7 | |||
| Al III | 1862.8 | |||
| Si II | 1808.0 | |||
| Ti II | 1910.6 | |||
| Cr II | 2056.3 | |||
| Cr II | 2066.2 | |||
| Mn II | 2576.9 | |||
| Mn II | 2594.5 | |||
| Mn II | 2606.5 | |||
| Fe II | 2249.9 | |||
| Fe II | 2260.8 | |||
| Fe II | 2344.2 | |||
| Fe II | 2374.5 | |||
| Fe II | 2382.8 | |||
| Fe II | 2586.7 | |||
| Co II | 2012.2 | |||
| Zn II | 2026.1 |
| QSO | [M/H] | aaErrors reflect statistical uncertainty. One should adopt an additional 15 systematic error for weak transitions due to continuum uncertainty.Errors reflect statistical uncertainty. One should adopt an additional 15 systematic error for weak transitions due to continuum uncertainty. | Refs. | ||
|---|---|---|---|---|---|
| Q1229021 | 0.395 | 1 | a | ||
| Q0235+164 | 0.526 | 2 | b | ||
| Q1622+238 | 0.656 | 3 | c, d | ||
| Q1122168 | 0.682 | 3 | e | ||
| Q1328+307 | 0.692 | 1 | f | ||
| Q1323-0021 | 0.716 | 1 | g,h | ||
| Q1107+0048 | 0.740 | 1 | g,h | ||
| Q0454+039 | 0.860 | 4 | i | ||
| Q1727+5302 | 0.945 | 1 | j | ||
| 1.031 | 1 | j | |||
| Q0302223 | 1.009 | 4 | i | ||
| Q0948+433 | 1.233 | 1 | k | ||
| Q0935+417 | 1.373 | 1 | f | ||
| Q1354+258 | 1.420 | 1 | i | ||
| Q0933+733 | 1.479 | 1 | k |
References. — a. Boissé et al. 1998; b. Turnshek et al. 2003; c. Churchill et al. 2000; d. RT00; e. de la Varga et al. 2000; f. Meyer et al. 1995; g. Rao, Turnshek, & Nestor 2004 [N(HI) measurements]; h. Khare et al. 2004 [N(ZnII) measurements]; i. Pettini et al. 2000; j. Turnshek et al. 2004; k. This work.

![[Uncaptioned image]](/html/astro-ph/0409695/assets/x3.png)
![[Uncaptioned image]](/html/astro-ph/0409695/assets/x6.png)