Mg ii chromospheric radiative loss rates
in cool active and quiet stars
The Mg ii k emission line is a good indicator of the level of chromospheric activity in late–type stars. We investigate the dependence of this activity indicator on fundamental stellar parameters. To this purpose we use IUE observations of the Mg ii k line in 225 late–type stars of luminosity classes I–V, with different levels of chromospheric activity. We first re–analyse the relation between Mg ii k line luminosity and stellar absolute magnitude, performing linear fits to the points. The ratio of Mg ii surface flux to total surface flux is found to be independent of stellar luminosity for evolved stars and to increase with decreasing luminosity for dwarfs. We also analyse the Mg ii k line surface flux – metallicity connection. The Mg ii k emission level turns out to be not dependent on metallicity. Finally, the Mg ii k line surface flux – temperature relation is investigated by treating separately, for the first time, a large sample of very active and normal stars. The stellar surface fluxes in the k line of normal stars are found to be strongly dependent on the temperature and slightly dependent on the gravity, thus confirming the validity of recently proposed models. In contrast, data relative to RS CVn binaries and BY Dra stars, which show very strong chromospheric activity, are not justified in the framework of a description based only on acoustic waves and uniformly distributed magnetic flux tubes so that they require more detailed models.
Key Words.:
Stars: late-type – Stars: BY Dra – Stars: RS CVn – Ultraviolet: general – Line: intensities1 Introduction
The Mg ii h and k resonance lines as well as the Ca ii H and K lines have played and continue to play an important role in the understanding of physical conditions in the chromospheres of late-type stars. In particular the Mg ii emission lines, which are formed at higher temperatures and greater heights than the Ca ii lines, are important tools for the diagnosis of chromospheric properties and, thanks to the large abundance of Magnesium, are good indicators of the total chromospheric radiative loss (Linsky & Ayres (1978)). In addition, the photospheric background around the region of 2800 Å being small or negligible compared to the chromospheric flux, the problem of photospheric background subtraction is considerably reduced with respect to Ca ii.
For all these reasons, Mg ii emission lines have been widely studied both in the Sun and in late-type stars (Basri & Linsky (1979); Cerruti-Sola et al. (1992); (Mathioudakis & Doyle (1992)); Elgarøy et al. (1997); Buchholz et al. (1998)).
The presence of resonance emission lines in late type stars is generally attributed to chromospheric temperature gradients generated by nonradiative heating (Ayres (1979)). Two different types of mechanisms have been identified as responsible for chromospheric heating: hydrodinamic (acoustic and pulsational waves) and magnetic mechanisms (Narain & Ulmschneider (1996); Buchholz et al. (1998); Ulmschneider et al. (2001); Fawzy et al. 2002a ).
The heating by acoustic waves appears to be the basic mechanism generating a basal flux strongly dependent on the colour of the star, but independent of luminosity class (Oranje & Zwaan (1985); Schrijver (1987); Rutten et al. (1991)).
The fact that stars with the same fundamental stellar parameters, like effective temperature, luminosity, and metallicity show a broad range of chromospheric activity is generally attributed to different fractions of the stellar surface covered by magnetic fields (Rutten et al. (1991); Baliunas et al. (1995)). Indeed, high-resolution observations of the Sun show considerable spatial variation in Mg ii fluxes which become larger in regions of higher magnetic activity.
Several semiempirical and theoretical models of stellar chromospheres have been proposed (see Ayres (1979); Ulmschneider et al. (2001); Fawzy et al. 2002a ). Theoretically predicted basal emission fluxes are in good agreement with minimal observed emission fluxes. On the other hand, the modeling of magnetic surface structure, which is responsible for the excess flux, roughly accounts for the observed line emission fluxes in Ca ii, but does not explain the large emission fluxes in Mg ii (Buchholz et al. (1998); Fawzy et al. 2002b ).
To test our understanding of the generation, propagation and dissipation of both mechanical and magnetical energy fluxes, it is useful to provide an empirical estimate of the amount of chromospheric heating in a large sample of stars covering a wide range of stellar properties.
In this paper we present the results of the analysis of the Mg ii k 2796.34 Å emission line of 225 stars, with spectral type F6–M6 and luminosity class I–V, as measured from a large number (more than 1400) of IUE spectra. Our sample contains stars with different level of activity, namely dwarfs, very active main sequence stars like BY Dra, giants and supergiants, and RS CVn, chromospherically active evolved stars.
The interest of our analysis mainly lies in the following points:
-
1.
The method used to measure intensities of lines is the same for a very large sample of different types of stars.
-
2.
The absolute flux scale is the same for all our stars and is accurate due to the use of high precision measurements of distances.
-
3.
The effective temperatures and bolometric corrections have been determined fron colours using unique accurate numerical relations.
The paper is organized as follows. In Sec. 2 and 3 we describe our sample of stars, the IUE observations and their reduction to absolute surface flux units. In Sec. 4 we search for trends of estimated chromospheric radiative loss rates with basic parameters of stars such as effective temperature , luminosity and metallicity. In Sec. 5 we compare our observations to avalaible theoretical models and our conclusions are given in Sec. 6.
2 Sample of stars
The data base used in the present paper was generated starting from the original sample of 230 normal stars used in a study of the Wilson–Bappu effect by Cassatella et al. (2001) (hereafter Paper I). It was a sample of stars with good quality Mg ii observations from IUE (see Section 3) and known parallaxes from HIPPARCOS with luminosity classes ranging from I to V. Since for the purpose of the present paper we need accurate determination of spectral type, colour and bolometric correction, we have further selected the original sample in order to avoid indetermined spectral classification, large errors on ( 0.1) and too large bolometric corrections ( -2.3) (see Section 3) because they are too uncertain. We obtained a final sample of 173 nominally quiet stars.
In addition to normal stars, we consider here a sample of 29 very active evolved stars of the RS CVn type. They have been selected following the criteria given in Cardini et al. (2003) (hereafter Paper II) and further selected following the criteria illustrated above.
Finally, we added a sample of BY Dra stars wich consist of both single and binary dwarf stars having strong Ca ii H and K emission lines. We have included all objects appearing as BY Dra stars in the SIMBAD data base for which IUE high resolution long-wavelength spectra and HIPPARCOS parallaxes were available. As selection criteria, we have adopted the same as Paper I and Paper II and described above. These constitute our sample of 23 chromospherically active main sequence stars with spectral types F to K.
The resulting sample (225 stars) consists of an accurately selected, uniformly reduced and homogeneously calibrated data set.
3 Observations and data processing
| HIP | Name | ref | [Fe/H] | bin | |||||
|---|---|---|---|---|---|---|---|---|---|
| 1803 | BE Cet | G4 V | 1 | 0.66 | 4.84 | 6.15 | -0.01 | ||
| 11964 | CC Eri | K7 V/M3 V | 2 | 1.39 | 8.58 | 6.35 | — | * | |
| 16537 | Eri | K2 V | 3 | 0.88 | 6.18 | 6.04 | -0.09 | ||
| 19855 | V891 Tau | G6 V | 3 | 0.68 | 5.34 | 6.28 | — | ||
| 19934 | V984 Tau | K0 V | 4 | 0.81 | 5.59 | 6.12 | — | ||
| 20237 | V986 Tau | G0 V | 4 | 0.56 | 4.20 | 6.30 | — | ||
| 20485 | V989 Tau | K5 V | 4 | 1.23 | 7.09 | 5.86 | — | ||
| 20553 | V895 Tau | G1 V | 4 | 0.60 | 4.32 | 6.36 | — | ||
| 20719 | V906 Tau | G1 V | 4 | 0.65 | 4.73 | 6.20 | — | ||
| 20815 | V993 Tau | F8 V | 4 | 0.54 | 4.11 | 6.16 | — | ||
| 20890 | V918 Tau | G8 V | 4 | 0.74 | 5.14 | 6.38 | — | ||
| 20899 | V920 Tau | G2 V | 4 | 0.61 | 4.45 | 6.23 | — | ||
| 21482 | V833 Tau | K3 IV | 3 | 1.10 | 6.84 | 6.40 | — | * | |
| 30630 | OU Gem | K3 V/K5 V | 5 | 0.94 | 5.95 | 6.32 | — | * | Both |
| 46816 | LQ Hya | K2 V | 2 | 0.93 | 6.50 | 6.31 | — | ||
| 46843 | DX Leo | G9 V | 3 | 0.78 | 5.80 | 6.28 | — | ||
| 57269 | V838 Cen | K1 V/K2 V | 2 | 0.91 | 5.47 | 6.33 | — | * | Both |
| 71631 | EK Dra | G5 V | 3 | 0.63 | 4.95 | 6.53 | — | ||
| 72659 | 37 Boo | G7 V | 3 | 0.72 | 5.41 | 6.22 | -0.15 | ||
| 81300 | V2133 Oph | K0 V | 3 | 0.83 | 5.82 | 5.90 | 0.01 | ||
| 82588 | V2292 Oph | G8 V | 3 | 0.75 | 5.51 | 6.25 | — | ||
| 83601 | V2213 Oph | F9 V | 3 | 0.58 | 4.45 | 6.07 | -0.19 | ||
| 91009 | BY Dra | K4 V/K7.5 V | 5 | 1.27 | 7.12 | 6.25 | — | * | Both |
| HIP | Name | (days) | [Fe/H] | |||||
|---|---|---|---|---|---|---|---|---|
| 4157 | CF Tuc | G0 V/K4 IV | 2.8 | 0.68 | 2.93 | 6.82 | — | Cool |
| 9630 | XX Tri | K0 III | 24.0 | 1.11 | 1.92 | 6.74 | — | |
| 10280 | TZ Tri | F5/K0 III | 14.7 | 0.77 | 0.08 | 6.36 | — | Cool |
| 13118 | VY Ari | K3-4 V-IV | 13.2 | 0.96 | 3.72 | 6.53 | — | |
| 16042 | UX Ari | G5 V/K0 IV | 6.4 | 0.88 | 2.96 | 6.78 | — | Cool |
| 16846 | V711 Tau | G5 IV/K1 IV | 2.8 | 0.88 | 3.51 | 6.84 | — | Both |
| 19431 | EI Eri | G5 IV | 1.9 | 0.71 | 3.28 | 6.73 | — | |
| 23743 | BM Cam | K0 III | 80.9 | 1.11 | -0.33 | 6.37 | — | |
| 35600 | AR Mon | G8 III/K2-3 III | 21.2 | 1.06 | 1.52 | 6.39 | — | Both |
| 37629 | Gem | K1 III | 19.6 | 1.12 | 1.36 | 6.36 | — | |
| 46159 | IL Hya | G8 V/K0 III-IV | 12.9 | 1.01 | 1.96 | 6.53 | — | Cool |
| 56851 | V829 Cen | G5 V/K1 IV | 11.7 | 0.95 | 2.44 | 6.57 | — | |
| 59600 | HU Vir | K0 IV | 10.4 | 0.97 | 3.21 | 6.63 | — | |
| 59796 | DK Dra | K1 III/K1 III | 64.4 | 1.15 | 0.59 | 6.33 | — | Both |
| 65187 | BM CVn | K1 III | 20.6 | 1.16 | 2.08 | 6.41 | — | |
| 82080 | UMi | A8-F0 V/G5 III | 39.5 | 0.90 | -0.92 | 5.99 | — | Cool |
| 84586 | V824 Ara | G5 IV/K0 V-IV | 1.7 | 0.80 | 4.38 | 6.89 | — | Both |
| 85852 | DR Dra | WD/K0-2 III | 905.9 | 1.04 | 1.54 | 6.31 | — | Cool |
| 94013 | V1762 Cyg | K1 IV-III | 28.6 | 1.09 | 1.65 | 6.40 | — | |
| 95244 | V4138 Sgr | K1 III | 13.0 | 1.03 | 2.00 | 6.39 | — | |
| 96003 | V1817 Cyg | A2 V/K2 III-II | 108.8 | 1.12 | -1.17 | 6.36 | — | Cool |
| 96467 | V1764 Cyg | F-K1 III: | 40.1 | 1.22 | 0.45 | 6.33 | — | |
| 109002 | HK Lac | F1 V/K0 III | 24.4 | 1.05 | 1.02 | 6.57 | — | Cool |
| 109303 | AR Lac | G2 IV/K0 IV | 2.0 | 0.76 | 2.99 | 6.51 | -0.70 | Both |
| 111072 | V350 Lac | K2 III | 17.7 | 1.17 | 0.97 | 6.03 | — | |
| 112997 | IM Peg | K2 III-II | 24.4 | 1.13 | 0.93 | 6.43 | — | |
| 114639 | SZ Psc | F8 IV/K1 IV | 4.0 | 0.79 | 2.67 | 6.71 | — | Cool |
| 116584 | And | G8 III-IV | 20.5 | 0.98 | 1.75 | 6.48 | -0.56 | |
| 117915 | II Peg | K2-3 V-IV | 6.7 | 1.01 | 4.38 | 6.68 | — |
Notes: Spectral types and orbital periods are from the
Catalog of Active Binary Stars (CABS) by Strassmeier et al. (1993) except for
IL Hya (see Weber & Strassmeier (1998)).
The last Column is according to CABS except for TZ Tri
and IL Hya (see Montes et al. (1995) and Fekel et al. (1999) respectively).
| HIP | [Fe/H] | HIP | [Fe/H] | |||||||||||
|---|---|---|---|---|---|---|---|---|---|---|---|---|---|---|
| 544 | K0 V | 0.75 | 5.39 | 6.10 | — | 31592 | K0 III | 1.04 | 2.46 | 5.20 | .05 | |||
| 1562 | K2 III | 1.21 | -1.18 | 4.88 | -.09 | 32768 | K0 III | 1.21 | -0.80 | 4.79 | — | |||
| 2021 | G2 IV | 0.62 | 3.45 | 5.26 | -.23 | 33817 | K1 V | 0.88 | 5.89 | 5.93 | — | |||
| 2081 | K0 III | 1.08 | 0.52 | 5.14 | — | 34622 | K0 III | 1.02 | 0.86 | 5.18 | — | |||
| 3092 | K3 III | 1.27 | 0.81 | 4.71 | .04 | 35264 | K3 I | 1.62 | -4.92 | 4.48 | — | |||
| 3093 | K0 V | 0.85 | 5.65 | 5.45 | -.17 | 35907 | K0 III | 1.25 | -1.51 | 4.96 | .06 | |||
| 3179 | K0 II | 1.17 | -1.99 | 4.96 | -.09 | 37379 | K3 III | 1.54 | -1.61 | 4.23 | -.22 | |||
| 3419 | K0 III | 1.02 | -0.30 | 5.50 | .13 | 37447 | K0 III | 1.02 | 0.71 | 4.95 | -.09 | |||
| 3765 | K2 V | 0.89 | 6.38 | 5.50 | -.29 | 37740 | G8 III | 0.93 | 0.35 | 5.13 | -.16 | |||
| 3821 | G0 V | 0.59 | 4.59 | 5.60 | -.31 | 37826 | K0 III | 0.99 | 1.09 | 5.10 | -.04 | |||
| 4422 | G8 III | 0.96 | 0.62 | 5.05 | -.51 | 38170 | G6 I | 1.22 | -4.74 | 5.31 | .24 | |||
| 5364 | K2 III | 1.16 | 0.68 | 4.88 | .04 | 40526 | K4 III | 1.48 | -1.22 | 4.38 | -.24 | |||
| 5447 | M0 III | 1.58 | -1.86 | 4.63 | -.10 | 41704 | G4 II | 0.86 | -0.40 | 5.28 | -.21 | |||
| 6537 | K0 III | 1.07 | 0.87 | 4.96 | -.22 | 41926 | K0 V | 0.78 | 5.95 | 5.58 | — | |||
| 6867 | K5 II | 1.54 | -0.87 | 4.82 | — | 42673 | K0 III | 0.96 | -0.35 | 5.57 | — | |||
| 7607 | K3 III | 1.27 | -0.04 | 4.67 | .00 | 42808 | K2 V | 0.92 | 6.35 | 6.08 | — | |||
| 7884 | K3 III | 1.35 | -0.81 | 4.48 | -.24 | 43813 | G8 III | 0.98 | -0.21 | 5.08 | .38 | |||
| 8102 | G8 V | 0.73 | 5.68 | 5.48 | -.66 | 44700 | G8 I | 1.04 | -2.03 | 5.46 | .38 | |||
| 9884 | K2 III | 1.15 | 0.48 | 4.95 | -.21 | 44897 | F9 V | 0.58 | 4.54 | 5.77 | — | |||
| 10644 | G0 V | 0.61 | 4.66 | 6.05 | -.30 | 45860 | M0 III | 1.55 | -1.02 | 4.58 | -.26 | |||
| 12114 | K3 V | 0.92 | 6.50 | 5.42 | — | 46390 | K3 III | 1.44 | -1.69 | 4.61 | -.12 | |||
| 12444 | F6 V | 0.52 | 4.12 | 5.95 | .02 | 46404 | G2 V | 0.64 | 2.91 | 5.62 | -.31 | |||
| 13701 | K1 III | 1.09 | 0.83 | 4.98 | -.23 | 47193 | K3 III | 1.49 | -3.31 | 4.64 | .09 | |||
| 14135 | M2 III | 1.63 | -1.61 | 4.26 | — | 47908 | G0 II | 0.81 | -1.46 | 5.59 | .17 | |||
| 14668 | K0 III | 0.98 | 1.11 | 5.11 | .04 | 48455 | K0 III | 1.22 | 0.83 | 4.91 | .12 | |||
| 15474 | M3 III | 1.61 | -0.79 | 4.68 | — | 50583 | K0 III | 1.13 | -0.92 | 4.43 | -.49 | |||
| 16134 | K5 V | 1.34 | 7.89 | 5.74 | — | 51172 | K4 III | 1.43 | -0.97 | 4.72 | -.39 | |||
| 17440 | K0 IV | 1.13 | 1.41 | 4.92 | — | 52727 | G5 III | 0.90 | -0.06 | 5.81 | — | |||
| 17678 | M2 III | 1.59 | -0.83 | 4.61 | — | 53229 | K0 III | 1.04 | 1.41 | 4.61 | -.20 | |||
| 18543 | M1 III | 1.59 | -1.19 | 4.52 | — | 53721 | G0 V | 0.62 | 4.29 | 5.39 | .01 | |||
| 19335 | F7 V | 0.52 | 3.87 | 6.24 | — | 53740 | K1 III | 1.08 | 0.44 | 4.98 | -.22 | |||
| 19747 | K1 III | 1.09 | 1.07 | 4.99 | — | 54539 | K1 III | 1.14 | -0.27 | 4.91 | -.13 | |||
| 19921 | K2 IV | 1.08 | 3.13 | 5.01 | — | 55282 | K0 III | 1.11 | -0.32 | 5.05 | -.48 | |||
| 20205 | G8 III | 0.98 | 0.28 | 5.44 | .13 | 57439 | G0 II | 0.89 | -1.51 | 5.57 | — | |||
| 20455 | G8 III | 0.98 | 0.41 | 5.23 | .06 | 57757 | F8 V | 0.52 | 3.40 | 5.88 | .13 | |||
| 20850 | K0 V | 0.84 | 5.66 | 6.08 | — | 58576 | K0 IV | 0.76 | 4.99 | 5.55 | .16 | |||
| 20885 | G7 III | 0.95 | 0.42 | 5.54 | .04 | 59316 | K2 III | 1.33 | -1.82 | 4.20 | -.13 | |||
| 20889 | K0 III | 1.01 | 0.14 | 5.04 | .04 | 60172 | K1 III | 1.17 | 0.26 | 5.18 | -.48 | |||
| 20917 | K7 V | 1.36 | 8.00 | 5.70 | — | 60260 | K3 III | 1.39 | -0.63 | 4.74 | — | |||
| 22263 | G3 V | 0.63 | 4.87 | 6.19 | -.13 | 61084 | M4 III | 1.60 | -0.56 | 4.62 | — | |||
| 22449 | F6 V | 0.48 | 3.67 | 6.05 | .02 | 61359 | G5 II | 0.89 | -0.51 | 5.30 | .27 | |||
| 23123 | K2 II | 1.37 | -2.86 | 4.67 | .26 | 63090 | M3 III | 1.57 | -0.57 | 4.72 | -.09 | |||
| 26366 | G8 III | 0.95 | 1.33 | 5.38 | -.53 | 64022 | K5 III | 1.48 | -0.04 | 4.43 | -.26 | |||
| 27628 | K1 III | 1.15 | 1.01 | 4.89 | .13 | 64394 | G0 V | 0.57 | 4.42 | 5.91 | .03 | |||
| 27750 | K2 II | 1.38 | -2.91 | 4.87 | -.25 | 64792 | G0 V | 0.58 | 3.92 | 6.35 | .10 | |||
| 27890 | K1 III | 1.02 | 2.47 | 4.90 | .10 | 64962 | G8 III | 0.92 | -0.05 | 5.20 | .06 | |||
| 27913 | G0 V | 0.59 | 4.70 | 6.47 | -.03 | 65721 | G5 V | 0.71 | 3.68 | 5.25 | -.11 | |||
| 29696 | G8 III | 1.02 | 0.75 | 5.15 | -.33 | 67275 | F7 V | 0.51 | 3.54 | 6.06 | .00 | |||
| 30343 | M3 III | 1.62 | -1.39 | 4.43 | — | 67457 | M5 III | 1.52 | 0.51 | 4.96 | — | |||
| 31205 | K0 III | 1.10 | 0.88 | 5.34 | -.42 | 68815 | M6 III | 1.24 | 0.68 | 4.47 | — |
Table 3. (continued)
| HIP | [Fe/H] | HIP | [Fe/H] | |||||||||||
|---|---|---|---|---|---|---|---|---|---|---|---|---|---|---|
| 68933 | K0 III | 1.01 | 0.70 | 5.05 | .03 | 90496 | K1 III | 1.02 | 0.95 | 5.11 | -.20 | |||
| 70692 | K4 III | 1.43 | -0.87 | 4.72 | -.16 | 91117 | K2 III | 1.32 | 0.21 | 4.62 | -.18 | |||
| 71053 | K4 III | 1.30 | 0.27 | 4.88 | -.17 | 92043 | F6 V | 0.48 | 2.79 | 5.97 | -.11 | |||
| 71681 | K1 V | 0.90 | 5.70 | 5.59 | .26 | 92761 | K1 II | 1.41 | -3.91 | 5.06 | — | |||
| 71683 | G2 V | 0.71 | 4.34 | 5.37 | .15 | 92791 | M4 III | 1.58 | -2.98 | 4.79 | — | |||
| 72010 | K3 III | 1.36 | 0.07 | 4.70 | — | 92862 | M5 III | 1.40 | -1.07 | 5.25 | — | |||
| 72370 | K5 III | 1.43 | -1.67 | 4.46 | — | 93864 | K1 III | 1.17 | 0.48 | 5.02 | -.23 | |||
| 73184 | K4 V | 1.02 | 6.86 | 5.64 | .01 | 94376 | G9 III | 0.99 | 0.63 | 5.09 | -.27 | |||
| 74395 | G8 III | 0.92 | 0.65 | 5.09 | — | 94713 | K0 II | 1.26 | -2.51 | 4.92 | .28 | |||
| 74666 | G8 III | 0.96 | 0.69 | 5.23 | -.26 | 95822 | K0 III | 1.05 | 0.85 | 4.89 | -.08 | |||
| 76423 | M5 II | 1.20 | 0.50 | 5.56 | — | 97433 | G8 III | 0.89 | 0.59 | 5.23 | -.18 | |||
| 77070 | K2 III | 1.17 | 0.87 | 4.70 | -.05 | 98110 | K0 II | 1.02 | 0.74 | 5.09 | -.09 | |||
| 79882 | G8 III | 0.97 | 0.64 | 5.05 | -.01 | 99461 | K2 V | 0.87 | 6.41 | 5.50 | -.58 | |||
| 80331 | G8 III | 0.91 | 0.58 | 5.20 | -.21 | 100437 | K0 II | 1.08 | 0.06 | 5.25 | .00 | |||
| 80704 | M6 III | 1.29 | -0.39 | 5.14 | .02 | 101474 | K2 I | 1.59 | -2.66 | 4.60 | — | |||
| 80816 | G8 III | 0.95 | -0.50 | 4.41 | -.27 | 101772 | K0 III | 1.00 | 0.65 | 5.03 | .03 | |||
| 81065 | G9 IV | 0.92 | 0.41 | 5.62 | -.05 | 102422 | K0 IV | 0.91 | 2.63 | 5.27 | -.32 | |||
| 81833 | G8 III | 0.92 | 0.80 | 5.45 | -.18 | 102488 | K0 III | 1.02 | 0.76 | 5.06 | -.18 | |||
| 82273 | K2 II | 1.45 | -3.62 | 4.89 | -.06 | 103227 | K0 III | 1.25 | -2.66 | 5.15 | -.06 | |||
| 82396 | K2 III | 1.14 | 0.78 | 4.92 | -.17 | 104060 | K5 I | 1.61 | -4.07 | 4.54 | -.45 | |||
| 84345 | M5 II | 1.16 | -2.57 | 5.55 | — | 105090 | K7 V | 1.40 | 8.71 | 5.49 | — | |||
| 84380 | K3 II | 1.44 | -2.10 | 4.62 | -.18 | 105406 | F8 V | 0.53 | 4.27 | 6.25 | -.13 | |||
| 85068 | G8 III | 0.99 | 0.27 | 5.37 | — | 106642 | M4 III | 1.34 | -0.43 | 4.21 | — | |||
| 85258 | K3 I | 1.48 | -3.49 | 5.02 | .50 | 107089 | K0 III | 1.01 | 2.10 | 5.21 | — | |||
| 85670 | G2 II | 0.95 | -2.43 | 5.98 | .14 | 107119 | K0 III | 1.11 | 0.89 | 4.90 | .04 | |||
| 86742 | K2 III | 1.17 | 0.76 | 4.84 | .00 | 107472 | K0 I | 1.38 | -2.41 | 5.46 | .06 | |||
| 87158 | G5 IV | 0.94 | 1.27 | 5.68 | — | 108870 | K5 V | 1.06 | 6.89 | 5.79 | -.23 | |||
| 87261 | K0 III | 1.19 | 0.24 | 4.87 | — | 109492 | K1 I | 1.56 | -3.35 | 4.81 | .22 | |||
| 87585 | K2 III | 1.18 | 1.06 | 4.92 | -.09 | 109937 | K3 III | 1.45 | -2.28 | 4.48 | -.12 | |||
| 87808 | K1 II | 1.35 | -2.70 | 4.96 | -.24 | 110130 | K3 III | 1.39 | -1.05 | 4.63 | — | |||
| 87933 | G8 III | 0.94 | 0.61 | 5.62 | -.10 | 112724 | K0 III | 1.05 | 0.76 | 5.03 | .02 | |||
| 88048 | G9 III | 0.99 | -0.03 | 4.93 | .16 | 112748 | G8 III | 0.93 | 0.74 | 5.07 | -.03 | |||
| 88601 | K0 V | 0.86 | 5.50 | 5.96 | -.05 | 112961 | M2 III | 1.63 | -1.67 | 4.53 | — | |||
| 88839 | G7 III | 0.94 | -0.59 | 5.13 | — | 113881 | M2 II | 1.65 | -1.49 | 4.25 | -.11 | |||
| 88972 | K2 V | 0.88 | 6.15 | 5.54 | -.20 | 114971 | G7 III | 0.92 | 0.68 | 5.20 | -.44 | |||
| 89962 | K0 III | 0.94 | 1.84 | 5.18 | -.42 | 116727 | K1 IV | 1.03 | 2.51 | 5.20 | .04 | |||
| 90139 | K2 III | 1.17 | 0.87 | 4.93 | -.16 |
Units for the Mg ii surface fluxes are in .
The spectroscopic Mg ii observations have been obtained with the IUE high resolution long wavelength camera. The calibrated spectra have been analysed and processed in order to obtain the Mg ii k emission line strength using the method described in Paper II, which consists of a direct integration of the observed profiles, as measured above the photospheric flux level. As stars in our sample all have parallaxes measured astrometrically, they all are nearby stars. This makes us confident that the interstellar absorbtion can be neglected. On the other hand the evaluation of the interstellar absorbtion requires information which is usually lacking. The estimated relative uncertainty in the derivations of the apparent flux from observations is . In the case of binaries with two emitting stars (three known objects between BY Dra and five between RS CVn) we have not deblended both contributions. Indeed AR Lac is the only target in our sample in which the individual contribution from the two stars is evident as a consequence of their similar Mg ii luminosity and of the favorable inclination angle of the system. Due to the statistical character of the present investigation, we have not considered it necessary to perform a detailed analysis of these spectra so that the integrated flux of both componets is considered.
In our data sample there are stars that have been observed two or more times. Some active stars have been observed hundreds of times. In all these cases a mean value of the flux was computed.
The apparent visual magnitudes of all stars along with their luminosity class, , trigonometric parallaxes and the relative errors were obtained mostly from the HIPPARCOS catalogue. In a few cases, mainly regarding RS CVn and BY Dra stars, information on colour and luminosity class was taken from the Strasbourgh Data Center (SIMBAD) or from the recent literature. We have assumed a typical error of mag on visual magnitudes.
To convert fluxes at Earth, , into stellar surface fluxes, , we have used the following relation:
| (1) |
where is the effective temperature and BC the bolometric correction both derived from colour using the coefficients to the polinomial fits given by Flower (1996); is the apparent visual magnitude. The constant 0.350 is derived from the solar values given by Allen (1983). The uncertainty on the chromospheric surface fluxes resulting from this conversion is hardly evaluable and the cooler the stars the larger the uncertainty. For binaries, we used combined values of ; in this way a further error in the calculation of surface fluxes is introduced. To prevent too large uncertainties in BC we have limited our sample to which corresponds to .
4 Discussion of the observations
In this Section we investigate the dependence, if any, of the chromospheric radiative loss rates on fundamental stellar parameters such as luminosity, metallicity, and temperature.
4.1 Line intensity–luminosity relation
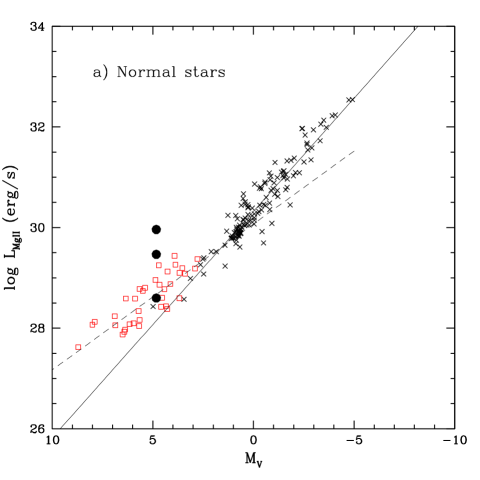
In Fig. 1 we have plotted the logarithm of the Mg ii k line absolute luminosity against absolute magnitude for normal stars (Fig. 1a) and active stars (Fig. 1b). Also indicated are the linear fits to the data for, separately, evolved (crosses) and main sequence (open squares) normal stars. To simplify the figures, error bars are not reported. In the figure are also drawn, for comparison, the ”average” Mg ii k luminosity for quiet solar regions, the ”average” Mg ii k luminosity for plage areas and the Mg ii k luminosity in the flare of September 5, 1973, as reported by Cerruti–Sola et al. (1992) (filled circles).
Fig. 1a clearly shows that the dependence of the line intensity on the stellar luminosity is different for evolved and dwarf normal stars. A least–squares fit to the data of normal evolved stars (class I–IV) provides:
| (2) |
with a correlation coefficient of 0.95. The slope coefficient of about -0.4 in equation (2) suggests that for giants and supergiants the Mg ii line intensity is directly proportional to stellar luminosity.
A similar fitting procedure applied to normal dwarf stars gives:
| (3) |
with a correlation coefficient of 0.82. The slope coefficient smaller than in Eq. (2) indicates that dwarf stars have an excess of Mg ii k luminosity which increases with increasing magnitude.
Eq. (2) is in very good agreement with the result of Weiler & Oegerle (1979) based on stars brighter than = 4 but it is quite different from our fit in Paper II because this last was performed on the whole sample of dwarfs and giants together. Other authors (e.g. Linsky & Ayres (1978); Weiler & Oegerle (1979); Basri & Linsky (1979)) report, on the basis of a sample mainly containing giant and supergiant stars and only few dwarfs, that the ratio of the Mg ii flux rate to stellar luminosity is not dependent on stellar luminosity. On the basis of the present analysis, we confirm that this is true only for evolved stars but is not true for main sequence stars.
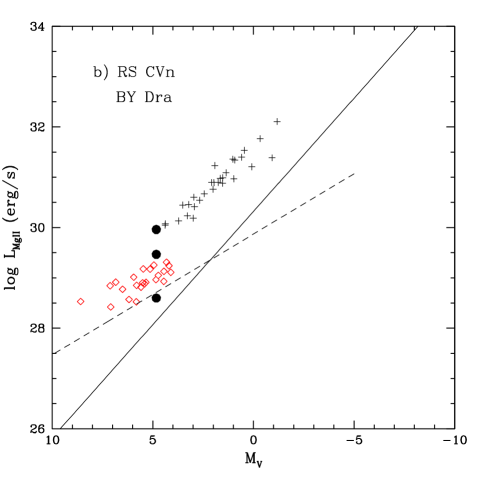
As far as very active stars are concerned, we show in Fig. 1b the location of RS CVn + BY Dra in the (, ) diagram. We can notice that there is a good correlation between the logarithmic Mg ii k line intensity and for RS CVn stars (pluses). A fit to these data gives:
| (4) |
with r=0.94.
Fig. 1b also shows that BY Dra stars (diamonds) have a slope similar to that of normal main sequence stars. However, the coefficients of the fit are not reported here given the quite low data correlation (r=0.74).
The mean activity level of RS CVn stars is comparable to that of an intense solar flare (about 1.3 dex greater than the level of quiet Sun) and that the activity level of BY Dra stars may be as large as that of solar plages (the mean run exceeds by 0.6 dex the quiet Sun).
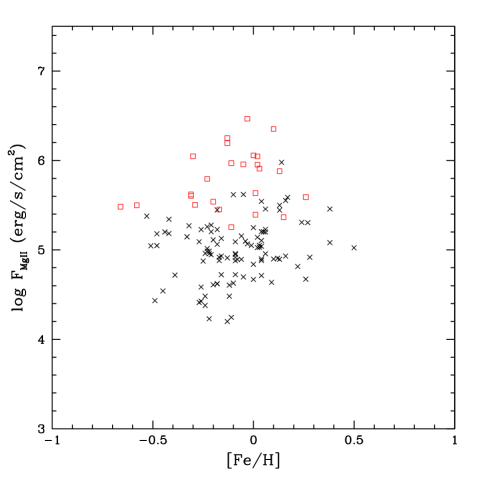
4.2 Flux–metallicity relation
In Fig. 2 is plotted the logarithm of the Mg ii k surface flux as a function of metallicity, for the 130 stars for which this latter parameter is known. The figure shows clearly that, in spite of the large range of metallicity covered, the radiative losses from the Mg ii k line do not show any correlation with chemical abundance. This is true also considering evolved (crosses) and main sequence stars (open squares) separately. The figure shows also that main sequence stars have greater surface fluxes than evolved stars with the same metallicity, thus confirming the higher level of activity of these stars as already pointed out in Sec. 4.1.
Due to the scarcity of the metallicity data available (see table 1 and table 2), a similar analysis has not been attempted for BY Dra and RS CVn stars.
4.3 Flux–colour relation
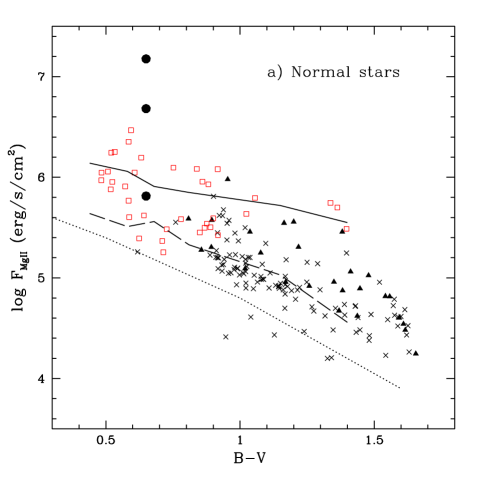
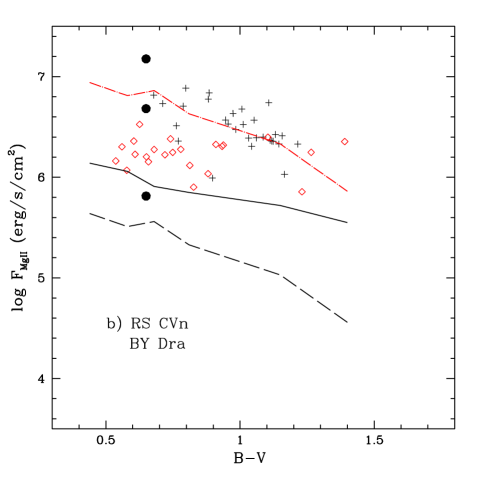
In Fig. 3 we have plotted the observed surface fluxes in the Mg ii k line versus for normal stars (Fig. 3a) and active stars (Fig. 3b).
In Fig. 3a we notice that:
-
•
The observed minimum fluxes of giant (crosses) and supergiant (triangles) stars decrease with decreasing temperature.
-
•
The observed minimum flux level of supergiants (class I–II) is a factor of two larger in compared to giant stars of the same colour.
-
•
Surface fluxes of luminosity class V stars (open squares) are only weakly dependent on temperature, if not all. It is difficult for these stars to identify a line of minimum fluxes as they are sparsely distributed with a spread of about one order of magnitude at high temperatures.
As for stars with known very active chromospheres shown in Fig. 3b we observe that:
-
•
RS CVn binaries (pluses) lie far above typical stars as seen before (Sec. 4.1). Minimum fluxes for these stars are well represented by the line of minimum fluxes defined by giants enhanced by a factor as large as 20.
-
•
BY Dra stars (diamonds) lie 0.6 dex above normal main squence stars. Their observed fluxes do not show any dependence on temperature.
5 Interpretation of the results
In Fig. 3 we compare our observational determination of Mg ii k line fluxes at stellar surfaces with the simulated estimates of the same quantities computed by Fawzy et al. (2002b) using two–component models of stellar chromospheres for late–type main sequence stars. The dashed line refers to fluxes computed taking into account pure acustic wave heating only (basal fluxes). In addition to this mechanism the models predict an increase in Mg ii emission due to magnetic tube waves proportional to the fraction of the stellar surface covered by magnetic fields (filling factor) (Fawzy et al. 2002a ). The solid curve in Fig. 3 refers to a magnetic filling factor of 0.4 which corresponds to maximum efficiency in magnetic wave heating and then determines the upper boundary of the chromospheric activity. Fig. 3a also shows the observational minimum limits from Rutten et al. (1991) (dotted line). All the quoted curves have been decreased by a factor of two to consider the k line only.
Buchholz et al. (1998) have simulated chromospheric Mg ii minimum emission fluxes both for main sequence stars and giants concluding that they are essentially the same. Thus, minimum fluxes computed by Fawzy et al. (2002b) for dwarf stars can be considered valid also for giants. The existence of such a common lower boundary in the surface flux versus colour is strongly supported by the observations of the Ca ii and Mg ii lines (Schrijver (1987); Mathioudakis & Doyle (1992); Rutten et al. (1991); Fawzy et al. 2002b ).
The Ca ii theoretical low and upper emission boundaries agree with the observations within a factor of two, which is justified given the inaccuracies in the model and/or by uncertainties in observed flux determinations. For Mg ii, Fawzy et al. (2002b), comparing their theoretical emission fluxes with observational fluxes given by Rutten et al. (1991), concluded that the modeled minimum flux limit was within a factor of two compatible with observations, but, even taking a factor of two uncertainty into account, the upper limit obtained was persistently lower than the maximum observed emission.
Looking at our data in Fig. 3a we see that our observational minimum limit is well defined in the range of between 0.85 and 1.5, where numerous giant stars (class III) are present. This limit is in good agreement with the line of acoustic wave heating of Fawzy et al. (2002b) (dashed line in Fig. 3), both in absolute magnitude (within a factor of about 1.5) and in terms of temperature dependence. At higher temperatures, where only main sequence stars are present, the minimum flux levels are less well defined, but they are still compatible with the theoretical lower limit. Note that the present minimum fluxes lie above the limit given by Rutten et al. (1991). Class I–II stars emission fluxes are greater than that of class III stars. This fact, not caused by magnetic heating, is probably due to their lower surface gravity.
In our sample of ”normal” stars, the maximum values of Mg ii fluxes are observed in main sequence stars. If, as said before, dwarf and giant stars have the same lower boundary, then the spread of Mg ii fluxes in the vertical direction is larger for dwarfs than for giants stars (not considering supergiants). This means that dwarfs may have a range of activity levels greater than giants of the same spectral type. We can see that 60% of normal main sequence stars lie below the theoretical magnetic wave heating line and all but one lie below the theoretical upper limit if a factor of two uncertainty is taken into account. Evidently a large fraction of the atmosphere of dwarfs may be dominated by magnetic heating but their emission can be accounted for by present models.
On the contrary the cited two–component models seem to be inadequate to explain the observed chromospheric radiative loss rates of BY Dra and RS CVn stars.
Fawzy et al. (2002a) models describe correctly the chromospheres of solar–type stars with low and moderate levels of activity. In addition their models are based on uniformly distributed magnetic flux tubes. BY Dra stars are generally attributed deep convection zones and fast rotation rates that enhance magnetic activity and it is known that BY Dra stars have large spotted regions (Stewart et al. (1988); Baliunas & Vaughan (1985); Saar et al. (1992)).
In our data shown in Fig. 3b, the BY Dra stars have Mg ii fluxes which show no dependence on temperature, and they all lie above the line of magnetic wave heating (full line) with a mean value of (see also Sec. 4.1). Looking at the data relative to the Sun reported in Fig. 3, the value of 6.3 corresponds, following an empirical computation, to a fraction of stellar surface covered by plages of about 32%, if the brightness of typical solar plages is assumed (it is not excluded however that the intrinsic brightness of the plage regions exceeds that of typical solar plages) (Cerruti-Sola et al. (1992)). Perhaps stronger magnetic fields and a modeling different from magnetic flux tubes are necessary to account for the peculiarities of this kind of star.
Fig. 3b also shows that RS CVn stars lie far above normal-chromosphere stars (see also Fig.1b). They seem to have a dependence on the effective temperature which follows the slope of the basal flux enhanced by a factor as large as 20 (dash–dotted line in Fig.3b). However this feature may be simulated by different orbital periods. These chromospherically active stars are members of binary systems and interactions between the two components could produce excess heating by completely non-magnetic processes such as mass transfer and accretion, tidal interactions and resonances. These other physical processes could affect chromospheric activity in addition to magnetic field strength (see for example Glebocki & Stawikowski (1988)).
6 Conclusion
In this paper we have addressed the still unsolved problem of identifying the possible physical processes responsible for chromospheric heating. To this purpose we have measured intensities of the Mg ii k line in a large number of IUE spectra and we have carried out an analytical study for different types of stars. The results obtained can be summarized as follows:
-
•
Metallicity does not affect the emission flux level of the Mg ii k line.
-
•
The logarithm of the total k line emission luminosity is linearly related to the absolute visual magnitude. For evolved stars, both normal and RS CVn, the correlation is very strong and allows the linear relationships in Eq. (2) and (4) to be defined. Main sequence stars, both normal and BY Dra, are less correlated in the (, ) plane and show a smaller slope.
-
•
There are indications that the Mg ii k flux increases slowly with decreasing stellar gravity (supergiants).
-
•
The observed range of chromospheric activity in the Mg ii k line in normal stars is fully accounted for by current models based on acoustic and magnetic wave heating in the form of magnetic flux tubes.
-
•
Peculiar objects, like BY Dra and RS CVn, for which current models are inadequate to explain the very large strength of the Mg ii k line, require that additional heating processes be taken into account.
Acknowledgements.
The author is grateful to Dr. A. Cassatella for providing measurements of Mg ii k line intensities and for critically reading the manuscript. I thank the referee for useful comments and suggestions.References
- Allen (1983) Allen, C. W. Astrophysical Quantities, London, Athlone Press, 1983
- Ayres (1979) Ayres, T. R. 1979, ApJ, 228, 509
- Baliunas & Vaughan (1985) Baliunas, S. L., Vaughan, A. H. 1985, ARA&A, 23, 379
- Baliunas et al. (1995) Baliunas, S. L., et al. 1995, ApJ, 438, 269
- Basri & Linsky (1979) Basry, G. S., Linsky, J. L. 1979, ApJ, 234, 1023
- Buchholz et al. (1998) Buchholz, B., Ulmschneider, P., Cunz, M. 1998, ApJ, 494, 700
- Cardini et al. (2003) Cardini, D., Cassatella, A., Badiali, M., Altamore, A., Fernández–Figueroa, M. J. 2003, A&A, 408, 337
- Carney et al. (1994) Carney, B. W., Latham, D. W., Laird, J. B., Aguilar, L. A. 1994, AJ, 107, 2240
- Cassatella et al. (2001) Cassatella, A., Altamore, A., Badiali, M., Cardini. D. 2001, A&A, 374, 1085
- Cayrel et al. (1997) Cayrel de Strobel, G., Soubiran, C., Friel, E.D., Ralite, N., Francois, P. 1997, A&AS, 124, 299
- Cerruti-Sola et al. (1992) Cerruti-Sola, M., Cheng, C.–C., Pallavicini, R. 1992, A&AS, 256, 185
- Cutispoto (1998) Cutispoto, G. 1998, A&AS, 131, 321
- Cutispoto et al. (2003) Cutispoto, G., Messina, S., Rodonò, M. 2003, A&A, 400, 659
- Elgarøy et al. (1997) Elgarøy, Ø., Engvold, O., Jorås, P. 1997, A&A, 326, 165
- (15) Fawzy, D., Rammacher, W., Ulmschneider, P., Musielak, Z. E., Stepień, K. 2002a, A&A, 386,971
- (16) Fawzy, D., Ulmschneider, P., Stepień, K., Musielak, Z. E., Rammacher, W. 2002b, A&A, 386,983
- Fekel et al. (1999) Fekel, F. C., Strassmeier, K. G., Weber M., Washuettl, A. 1999, A&AS, 137, 369
- Flower (1996) Flower, P. J. 1996, ApJ, 469, 355
- Glebocki & Stawikowski (1988) Glebocki, R., Stawikowski, A. 1988, A&A, 189, 199
- Gray et al. (2003) Gray, R. O., Corbally, C. J., Garrison, R. F., McFadden, M. T., Robinson, P. E. 2003, AJ, 126, 2048
- Linsky & Ayres (1978) Linsky, J. L., Ayres, T. R. 1978, ApJ, 220,619
- Mathioudakis & Doyle (1992) Mathioudakis, M., Doyle, J.G. 1992, A&A, 262, 523
- Montes et al. (1995) Montes, D., De Castro, E., Fernández–Figueroa, M. J., Cornide, M. 1995, A&AS, 114, 287
- Narain & Ulmschneider (1996) Narain, U., Ulmschneider, P. 1996, Space Sci. Rev., 75, 453
- Oranje & Zwaan (1985) Oranje, B. J., Zwaan, C. 1985, A&A, 147,265
- Rutten et al. (1991) Rutten, R. G. M., Schrijver, C. J., Lemmens, A. F. P., Zwaan, C. 1991, A&A, 252,203
- Saar et al. (1992) Saar, S. H., Piskunov, N. E., Tuominen, I. 1992, in Cool Stars, Stellar Systems, and the Sun, ASP Conf. Ser. 26, ed. M. S. Giampapa & J. A. Bookbinder, 255
- Schrijver (1987) Schrijver, C. J. 1987, A&A, 172,111
- Stewart et al. (1988) Stewart, R. T., Innis, J. L., Slee, O. B., Nelson, G. J., Wright, A. E. 1988, AJ, 96, 371
- Strassmeier et al. (1993) Strassmeier, K. G., Rice, C. B., Fekel, F. C., Scheck, M. 1993, A&AS, 100, 173
- Ulmschneider et al. (2001) Ulmschneider, P., Fawzy, D., Musielak, Z. E., Stepień, K. 2001, ApJ, 559, L167
- Weber & Strassmeier (1998) Weber, M., Strassmeier, K. G. 1998, A&A, 330, 1029
- Weiler & Oegerle (1979) Weiler, E. J., Oegerle, W. R. 1979, ApJS, 39, 537