Quiescent X-ray Emission from an evolved Brown Dwarf ?
Abstract
I report on the X-ray detection of Gl 569 Bab. During a ksec Chandra observation the binary brown dwarf is for the first time spatially separated in X-rays from the flare star primary Gl 569 A. Companionship to Gl 569 A constrains the age of the brown dwarf pair to Myr. The observation presented here is only the second X-ray detection of an evolved brown dwarf. About half of the observing time is dominated by a large flare on Gl 569 Bab, the remainder is characterized by weak and non-variable emission just above the detection limit. This emission – if not related to the afterglow of the flare – represents the first detection of a quiescent corona on a brown dwarf, representing an important piece in the puzzle of dynamos in the sub-stellar regime.
1 Introduction
Late-type stars have long been known to display signatures of magnetic activity evidencing solar-like dynamo action (Rosner, Golub, & Vaiana, 1985). The picture is less clear for the coolest dwarf stars at the bottom of the main-sequence (MS) and in the substellar regime. These objects are fully convective and can not drive a solar-like -dynamo. The efficiency of alternative field generating mechanisms, e.g. an -dynamo (Rädler et al., 1990) or a turbulent dynamo (Durney, De Young, & Roxburgh, 1993), are both difficult to predict and observationally poorly constrained. Systematic investigations of chromospheric H activity in very low-mass (VLM) stars and brown dwarfs (BDs) in the solar neighborhood (Gizis et al., 2000; Mohanty & Basri, 2003) have shown that H emission reaches a maximum at spectral type M7, and fades off for the latest M dwarfs suggesting a change in the driving dynamo mechanism. X-ray emission is a complementary activity indicator, probing the effects of the magnetic processes in the outermost and hottest part of the atmosphere, the corona. Beyond spectral type M6 the X-ray regime is widely unexplored. Only few late M dwarfs have been observed with Chandra and/or XMM-Newton: APMPM2354 (Scholz et al., 2004), vB 10 (Fleming, Giampapa, & Garza, 2003), LP944-20 (Rutledge et al., 2000). With the exception of vB 10 all X-ray detections of M dwarfs cooler than spectral type M7 are ascribed to flares, i.e. outbursts on a time-scale of hours that arise from reconnection of magnetic field lines. It is unclear to date whether ultra-cool dwarfs can sustain persistent X-ray emission, as is typically observed on higher-mass stars. In particular, a ‘quiescent’ corona could not be established for any BD so far.
While the observational material on X-ray activity of evolved ultra-cool dwarf stars and BDs is scarce, X-ray emission has lately been revealed from a substantial number of Myr-old VLM pre-MS stars and BDs in various star forming regions (Neuhäuser & Comerón, 1998; Preibisch & Zinnecker, 2002; Mokler & Stelzer, 2002; Feigelson et al., 2002; Stelzer, Micela, & Neuhäuser, 2004), for one BD in the Myr-old TW Hya association (Tsuboi et al., 2003), one member of Upper Sco (Bouy, 2004), and one BD in the Pleiades (Briggs & Pye, 2004). BDs are not able to fuse hydrogen and subsequently must cool down and become fainter as they age. Therefore, their detection at young ages but non-detection in more evolved stages could be due to: (A) a drop of the X-ray luminosity as a result of the decreased bolometric luminosity. A decline of with age is expected if the correlation typical for the higher-mass late-type stars holds also in the sub-stellar regime; (B) an effect of the atmospheric temperature. Based on the absence or low level of H emission seen in most field L dwarfs Mohanty et al. (2002) have argued that the dynamo may shut off below a critical temperature because the atmosphere becomes too neutral to provide substantial coupling between matter and magnetic field. But due to a lack of systematic observations this hypothesis has not been tested so far in the X-ray regime, nor has a firm relation between X-ray and H emission been established.
For a study of the evolution of X-ray activity on sub-stellar objects as they evolve away from the youngest ages BD companions to MS stars are favorable targets. The age determination in the coolest part of the HR diagram is subject to considerable uncertainty because of a degeneracy in the mass-age plot and a uncertainty of theoretical evolutionary models for VLM stars and BDs. But ages of MS stars can be estimated by a number of methods (Lachaume et al., 1999), and companions are expected to be coeval.
A low-mass companion to the nearby ( pc; Dahn et al. 2002) dM2e star Gl 569 was identified and confirmed as a common proper motion pair by Forrest, Skrutskie, & Shure (1988). Martín et al. (2000) found that the companion itself is a binary of separation. Various methods have been used to constrain the age of Gl 569 A: H and X-ray activity (Henry & Kirkpatrick, 1990; Pallavicini, Tagliaferri, & Stella, 1990), the non-detection of Lithium absorption (Magazzù, Martín, & Rebolo, 1993), and its space velocity suggesting membership to the UMa association or a new super-cluster (Chereul, Crézé, & Bienaymé, 1999). All these methods place it at an age between Myr, consistent with the position of the Gl 569 Bab binary in the HR diagram (Lane et al., 2001). The dynamical masses of Gl 569 Ba and Gl 569 Bb were derived by Zapatero Osorio et al. (2004) from a combination of radial velocity measurements and astrometry, yielding 99 % confidence intervals of and . The lower-mass component is thus the first object confirmed as substellar independent of models. In this Letter I present the Chandra detection of Gl 569 Bab, including a large flare and probably the first detection of quiescent X-ray emission from an evolved BD.
2 Observations
The Gl 569 system was observed with the Advanced CCD Imaging Spectrometer (ACIS),
using the S3 chip in imaging mode for a total exposure time of ks.
The data analysis was carried out using the CIAO software
package111CIAO is made available by the CXC and can be downloaded
from
http://cxc.harvard.edu/ciao/download-ciao-reg.html version 2.3
in combination with the calibration database (CALDB) version 2.21.
I started the analysis with the level 1 events file provided by the
pipeline processing at the Chandra X-ray Center (CXC).
In the process of converting the level 1 events file to a level 2 events file
for each of the observations the following steps were performed:
Charge transfer inefficiency (CTI) correction,
removal of the pixel randomization,
filtering for event grades (retaining the standard ASCA grades , , , , and ),
and application of the standard good time interval (GTI) file.
The events file was also checked for any systematic aspect offsets using
CIAO software, but none were present.
3 Data Analysis and Results
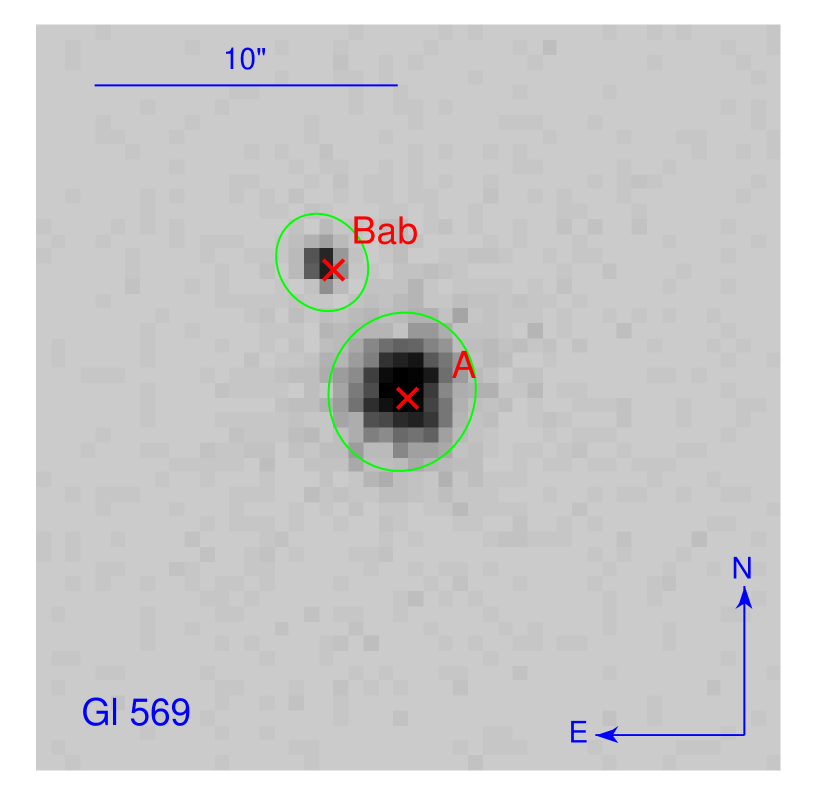
The expected position of Gl 569 A was found by translating its Hipparcos position to the time of the Chandra observation with help of the proper motion given by King et al. (2003). The position of Gl 568 Bab relative to the primary was obtained using the separation and P.A. of Lane et al. (2001). Source detection was carried out with the wavdetect algorithm on an image of pixels length ( pixel = ) centered on the computed position of the primary using wavelet scales between and in steps of . Two X-ray sources are found which are unambiguously identified with Gl 569 A (offset between optical and X-ray position ) and Gl 569 Bab (), respectively; see Fig. 1. Using the position of the X-ray source corresponding to Gl 569 A as the reference, the second X-ray source is characterized by an angular separation of and a position angle of . These values are in reasonable agreement with those published by Lane et al. (2001) based on near-IR images, the difference possibly being due to orbital motion of the BD pair around the primary in the time interval of yr.
I extracted the source photons of Gl 569 Bab from a circular area of radius centered on the position of the corresponding X-ray source. According to a simulation of the point spread function (PSF) with mkpsf this area contains about % of the source photons assuming a photon energy of keV. To eliminate contamination by counts from the wings of the PSF of the X-ray bright primary the background was computed within an annulus centered on Gl 569 A and at the distance of the BD binary, but excluding the source extraction area of Gl 569 Bab. After correcting for the missing % of photons the total number of source counts is .
The primary Gl569 A suffers from pile-up, such that the flux is underestimated and the shape of the lightcurve and the spectrum are distorted when source photons are extracted from a circular area centered on the X-ray source. At the expense of reduced statistics the negative effects of pile-up can be avoided if photons from the core of the PSF are ignored. To determine the optimum inner radius for an annular source extraction region I extracted events from a series of annuli with . The outer radius was fixed at to exclude photons from the BD pair. With help of the ChaRT222Information on the usage of the Chandra Ray Tracer (ChaRT) can be found at http://cxc.harvard.edu/chart/ and MARX333The Model of AXAF Response to X-rays (MARX) is provided by the MIT/CXC (see http://space.mit.edu/CXC/MARX/) simulators an individual arf was constructed for each of the annuli to correct the effective area for the missing part of the PSF444see http://www.astro.psu.edu/users/tsujimot/arfcorr.html for more information on the procedure. Then I examined how the observed luminosity, derived from the photon spectrum, changes depending on . The optimized extraction area was then defined as the annulus where reaches a plateau, .
The X-ray lightcurves of Gl 569 Bab and Gl 569 A are shown in Fig. 2. Both the BD pair and the M2 star underwent a spectacular flare. Note that the relative amplitude of the two lightcurves does not reflect the actual strength of the outbursts because – as explained above – for Gl569 A photons from only a small fraction of the PSF ( % for photon energy of keV) could be considered in the source extraction region. The strength of pileup depends on the changing incident photon flux. Therefore the exact time evolution of the intensity of Gl569 A is difficult to reconstruct. The X-ray emission of Gl 569 A is not the main scope of this Letter, and will be discussed elsewhere. In the following I focus on Gl 569 Bab.
4 X-ray Properties of Gl 569 Bab
The beginning of the observation is dominated by a strong flare on the BD binary, with % of all source photons being concentrated in the first ksec of the observation. In the remainder of the observing time a total of photons were collected in the source area, of which about are expected to be background events, mostly contaminants from Gl 569 A. This corresponds to a ‘quiescent’ source count rate of cps. Assuming a 1-T plasma without absorption yields erg/s. This value is insensitive to temperature within a typical range of keV. The peak count rate during the flare is cps, amounting to a peak luminosity of erg/s using the same assumptions for the spectral shape as for the estimate of the ‘post-flare’ luminosity. A more reliable estimate for the X-ray luminosity can be obtained from an analysis of the X-ray spectrum. It provides information on the time-averaged luminosity, which is dominated by the flare. A statistically acceptable interpretation in terms of thermal emission requires a model with a minimum of two temperatures ( keV, keV, ). Discrepancies between model and data suggest that absorption may not be negligible (see Fig. 3). However, if an absorption term is added, the fit results in very high emission measure for the soft component. A correlation in the parameter space between and is typical for low-sensitivity, low-resolution spectra. The model without absorption seems to be more realistic, because (i) no visual extinction has been reported for Gl 569, and (ii) a dominant soft component is unexpected in flares.
| Quies | Peak | Average | ||
|---|---|---|---|---|
| [erg/s] | ||||
A widespread used measure for coronal activity is the fraction of X-ray luminosity relative to the bolometric luminosity. The two components in the BD binary have and (Gorlova et al., 2003). Table 1 presents a summary of X-ray luminosities and ratios for Gl 569 Bab derived from this Chandra observation. was evaluated attributing all observed X-rays to either of the unresolved components. Recall that, ‘Quies’ and ‘Peak’ values are estimated from count rates using model assumptions. ‘Average’ denotes the luminosity derived from the analysis of the time averaged spectrum.
5 Discussion
I report on a huge X-ray flare and the possible detection of quiescent emission on Gl569 Bab. The present limits on the individual masses do not exclude that the higher-mass component is a star at the borderline to the substellar regime, but most evidence points at a BD-BD binary (see discussion in Zapatero Osorio et al. 2004). Independent of whether the X-ray source is substellar or not, the emitter is one of only two ultra-cool dwarfs older than Myr for which X-ray emission could be detected so far. Therefore, Gl 569 Bab constitutes an important link between activity in star forming regions, associations, and open clusters, and the more evolved field stars and BDs. Gl 569 Bab are spectroscopically confirmed companions to a MS star. This eliminates two important parameters (the effective temperature and the age) from the list of unknowns, whose influence on the efficiency of (sub-)stellar dynamos has remained elusive so far.
Fig. 4 shows the vs. spectral type diagram for VLM field dwarfs. Gl 569 Bab adds to a handful of late-M type objects that have shown flares, with emission levels near or above the canonical ‘saturation level’ of . In the second half of the Chandra observation, after the flare decayed, Gl 569 Bab is detected as a weak X-ray source. If the interpretation of this emission as representative for the quiescent corona is correct it constitutes the first detection of persistent X-ray activity on a presumed BD. The sharp decline in the quiescent coronal activity for ultra-cool dwarfs conjectured by Fleming, Giampapa, & Garza (2003) must then be questioned. As seen from the upper limits in Fig. 4, indeed, most previous observations of late M dwarfs were not sensitive enough to sample the range expected from an extrapolation of the values of the M0…M6 dwarfs. However, the non-detection of any photon from Gl 569 Bab in the ks before the flare casts some doubt on this view. It is observed occasionally that stars do not go back into their pre-flare quiescent state immediately after an outburst, thus we may see some kind of ‘afterglow’ of the flare rather than true quiescent emission. On the other hand, based on the post-flare emission level a total of source photons are expected prior to the flare, consistent with the observation of zero photons at the limit.
The detection of a strong X-ray flare on a comparatively evolved BD demonstrates that coronae of VLM objects can remain powerful beyond the youngest ages. Fig. 5 puts the Chandra observation of Gl 569 Bab in context with observations of younger BDs, and the only previous X-ray detection of a field BD, LP 944-20. A factor of more photons have been collected for Gl 569 Bab with respect to all other late M dwarfs, allowing for the first time a meaningful spectral analysis of such an object. The spectrum shows significant emission above keV, but a similarly strong cool component of MK. Low coronal temperatures seem to be characteristic for all but the youngest BDs. This is all the more remarkable as temperatures are known to rise in stellar flares. The flare temperatures of the evolved BDs (Gl 569 Bab and LP 944-20) are similar to the quiescent temperature of the middle-aged BD TWA-5B on the one hand and to the quiescent temperature of the evolved star vB 10 on the other hand. Upcoming observations with Chandra sampling the age and temperature space shall constrain the influence of these parameters on coronal emission.
References
- Bouy (2004) Bouy, H. 2004, A&A, 424, 619 (B04)
- Briggs & Pye (2004) Briggs, K. R., & Pye, J. P. 2004, MNRAS, 353, 673 (BP04)
- Chereul, Crézé, & Bienaymé (1999) Chereul, E., Crézé, M., & Bienaymé, O. 1999, A&AS, 135, 5
- Dahn et al. (2002) Dahn, C. C., Harris, H. C., Vrba, F. J., et al. 2002, AJ, 124, 1170
- Durney, De Young, & Roxburgh (1993) Durney, B. R., De Young, D. S., & Roxburgh, I. W. 1993, Sol.Phys., 145, 207
- Feigelson et al. (2002) Feigelson, E. D., Broos, P., Gaffney, J. A. III, et al. 2002, ApJ, 574, 258
- Fleming et al. (1993) Fleming, T. A., Giampapa, M. S., Schmitt, J. H. M. M., & Bookbinder, J. A. 1993, ApJ, 410, 387 (F93)
- Fleming, Schmitt, & Giampapa (1995) Fleming, T. A., Schmitt, J. H. M. M., & Giampapa, M. S. 1995, ApJ, 450, 401 (F95)
- Fleming, Schmitt, & Giampapa (2000) Fleming, T. A., Giampapa, M. S., & Schmitt, J. H. M. M. 2000, ApJ, 533, 372 (F00)
- Fleming, Giampapa, & Garza (2003) Fleming, T. A., Giampapa M. S., & Garza, D. 2003, ApJ, 594, 982 (F03)
- Forrest, Skrutskie, & Shure (1988) Forrest, W. J., Skrutskie, M. F., & Shure, M. 1988, ApJ, 330, L119
- Gizis & Bharat (2004) Gizis, J. E., & Bharat, R. 2004, ApJ, 608, L113 (GB04)
- Gizis et al. (2000) Gizis, J. E., Monet, D. G., Reid, I. N., et al. 2000, AJ, 120, 1085
- Gorlova et al. (2003) Gorlova, N. I., Meyer, M. R., Rieke, G. H., & Liebert, J. 2003, ApJ, 593, 1074
- Hambaryan et al. (2004) Hambaryan V., Staude, A., Schwope, A. D., et al. 2004, A&A, 415, 265 (H04)
- Hawley, Gizis, & Reid (1996) Hawley, S. L., Gizis, J. E., & Reid, I. N. 1996, AJ, 112, 2799
- Henry & Kirkpatrick (1990) Henry, T. J., & Kirkpatrick, J. D. 1990, ApJ, 354, L29
- Hünsch et al. (1999) Hünsch, M., Schmitt, J. H. M. M., Sterzik, M. F., & Voges, W. 1999, A&AS, 135, 319
- Imanishi, Tsujimoto, & Koyama (2001) Imanishi, K., Tsujimoto, M., & Koyama, K. 2001, ApJ, 563, 361 (I01)
- King et al. (2003) King J. R., Villarreal, A. R., Soderblom, D. R., Gulliver, A. F., & Adelman, S. J. 2003, AJ, 125, 1980
- Lachaume et al. (1999) Lachaume, R., Dominik, C., Lanz, T., & Habing, H. J. 1999, A&A, 348, 897
- Lane et al. (2001) Lane B. F., Zapatero Osorio, M. R., Britton, M. C., Martin, E. L., & Kulkarni, S. R. ApJ, 560, 390
- Magazzù, Martín, & Rebolo (1993) Magazzù, A., Martín, E. L., & Rebolo, R. 1993, ApJ, 404, L17
- Martín et al. (2000) Martín, E. L., Koresko, C. D., Kulkarni, S. R., et al. 2000, ApJ, 529, L37
- Martín & Bouy (2002) Martín, E. L., & Bouy, H. 2002, New Astron, 7, 595
- Mohanty & Basri (2003) Mohanty, S., & Basri, G. 2003, ApJ, 583, 451
- Mohanty et al. (2002) Mohanty, S., Basri, G., Shu, F., Allard, F., & Chabrier, G. 2002, ApJ, 571, 469
- Mokler & Stelzer (2002) Mokler, F., & Stelzer, B. 2002, A&A, 391, 1025
- Neuhäuser & Comerón (1998) Neuhäuser, R., & Comerón, F. 1998, Science, 282, 83
- Neuhäuser et al. (1999) Neuhäuser, R., Briceño, C., Comerón, F., et al. 1999, A&A, 343, 883 (N99)
- Pallavicini, Tagliaferri, & Stella (1990) Pallavicini, R., Tagliaferri, G. & Stella, L. 1990, A&A, 228, 403
- Preibisch & Zinnecker (2002) Preibisch, T., & Zinnecker, H. 2002, AJ, 123, 1613 (PZ02)
- Rädler et al. (1990) Rädler, K.-H., Wiedemann, E., Meinel, R., et al. 1990, A&A, 239, 413
- Rosner, Golub, & Vaiana (1985) Rosner, R., Golub, L., & Vaiana, G. S. 1985, ARA&A, 23, 413
- Rutledge et al. (2000) Rutledge, R. E., Basri, G., Martín, E. L., & Bildsten, L. 2000, ApJ, 538, L141 (R00)
- Schmitt & Liefke (2002) Schmitt, J. H. M. M., & Liefke, C. 2002, A&A, 382, L9 (SL02)
- Scholz et al. (2004) Scholz, R.-D., Lodieu, N., Ibata, R., et al. 2004, MNRAS ,347, 685 (S04)
- Stelzer, Micela, & Neuhäuser (2004) Stelzer, B., Micela, G., & Neuhäuser, R. 2004, A&A, in press (St04)
- Tsuboi et al. (2003) Tsuboi, Y., Maeda, Y., Feigelson, E. D., et al. 2003, ApJ, 587, L51 (T03)
- Zapatero Osorio et al. (2004) Zapatero Osorio, M. R., Lane, B. L., Pavlenko, Y., et al. 2004, ApJ, in press