Galaxy Evolution and Cosmology with the Square Kilometre Array
Abstract
The present-day Universe is seemingly dominated by dark energy and dark matter, but mapping the normal (baryonic) content remains vital for both astrophysics – understanding how galaxies form – and astro-particle physics – inferring properties of the dark components.
The Square Kilometre Array (SKA) will provide the only means of studying the cosmic evolution of neutral Hydrogen (HI) which, alongside information on star formation from the radio continuum, is needed to understand how stars formed from gas within dark-matter over-densities and the rôles of gas accretion and galaxy merging.
‘All hemisphere’ HI redshift surveys to are feasible with wide-field-of-view realizations of the SKA and, by measuring the galaxy power spectrum in exquisite detail, will allow the first precise studies of the equation-of-state of dark energy. The SKA will be capable of other uniquely powerful cosmological studies including the measurement of the dark-matter power spectrum using weak gravitational lensing, and the precise measurement of using extragalactic water masers.
The SKA is likely to become the premier dark-energy-measuring machine, bringing breakthroughs in cosmology beyond those likely to be made possible by combining CMB (e.g. Planck), optical (e.g. LSST, SNAP) and other early-21st-century datasets.
1 Introduction
As detailed by Blake et al. (2004; hereafter BABR), the ‘era of precision cosmology’ has been ushered in by the measurement of many of the key cosmological parameters. We can now seemingly adopt a fiducial model consisting of a spatially-flat () Universe with cosmological parameters , , , and (values broadly consistent with the most recent CMB results, Spergel et al. 2003). The big surprise of this ‘concordance cosmology’ has been the compelling evidence for a smoothly distributed dark energy (with a density parameter ). The dark energy model is commonly characterized by its equation-of-state relating its pressure to its energy density (in units where the speed-of-light ). For consistency with BABR we adopt a fiducial dark energy model characterized by where .111 This has been chosen to illustrate the accuracy with which the SKA will be able to discriminate a general dark energy model from one in which the dark energy is Einstein’s cosmological constant for which .
Results from a combination of early-21st-century experiments will be essential in transitioning from the 10-per-cent accuracy currently achieved by current ‘precision’ cosmology to the 1-per-cent accuracy needed, for example, to make the first serious study of the properties of dark energy. This leap in precision will be essential in making progress towards answering at least four of the eleven questions raised in “Connecting Quarks with the Cosmos: Eleven Science Questions for the New Century” (ref. 10).
Alongside this revolution in cosmology there has also been great progress in understanding how galaxies and larger-scale structures form. Galaxies are visible because of their normal (baryonic) content, and our understanding of the complex physics describing the rôle of baryonic material in galaxy formation is growing but incomplete. ‘Semi-analytic’ models (e.g. Cole et al. 2000; Baugh et al. 2004a, hereafter B2004) have become the primary mode of investigating these complex issues. B2004 outline one recipe (GALFORM) for galaxy formation, comprising nine physical ingredients. A measure of the uncertainties involved is that just one of these ingredients, the hierarchical growth of dark-matter halos, is relatively uncontroversial. However, for example, even ingredient (ii) from the Baugh et al. recipe – the virialization by shocks of gas within gravitational potential wells – is now the subject of intense debate (e.g. Binney 2004; Keres et al. 2004).
A suite of surveys for neutral Hydrogen (HI) emission will be possible with the SKA (van der Hulst et al. 2004, hereafter V2004). In Sec. 2 we discuss the number of galaxies expected in these surveys, and the uncertainties involved. In Sec. 3 we explain how measurements of HI will tell us new things about how galaxies form and evolve. We also briefly discuss ways other than HI surveys in which the SKA will improve our physical understanding of galaxy formation. In Sec. 4 we show that, regardless of differences between predictions and the eventual measurements, moderate resolution ( arcsec) HI surveys with the SKA will help revolutionize cosmology providing the SKA realization has sufficient instantaneous field of view. We emphasise the importance of two other cosmological experiments with the SKA: (i) a weak gravitational lensing survey, also requiring large field of view, but higher ( arcsec) spatial resolution; and (ii) accurate measurement of the Hubble constant using water masers, requiring high frequency and very-high-resolution capabilities. We briefly contrast the impact of the SKA on measurements of dark energy with those of other planned early-21st-century experiments.
2 HI surveys with the SKA
Neutral atomic Hydrogen (HI) is the most abundant element in the Universe, the main fuel for star formation, and a very powerful tracer of galaxies in various stages of their evolution and in a variety of environments. The best way to detect the presence of HI is by its 21-cm emission line, so only radio telescopes are capable of imaging the distribution and kinematics of HI in the Universe. Although telescopes at other wavelengths will continue to probe the history of star formation, we will never have a complete picture until we probe the the state of the component from which the stars formed – the neutral Hydrogen. The SKA will be the ultimate HI imaging machine which will map out where the HI resides over a large range in cosmic time and galactic environments, from clusters to filaments to voids.
One very-wide-area (‘all hemisphere’) survey of HI has already been performed (the HIPASS survey; Meyer et al. 2004) but because of its limited sensitivity it reaches only to redshift . Although this survey has demonstrated that most HI is associated with galaxies, we do not yet have any meaningful measurement of the redshift distribution of these HI-emitting galaxies, and we must rely on models. Abdalla & Rawlings (2004; hereafter AR2004) investigated a range of evolutionary scenarios for HI-emitting galaxies, comparing a ‘no evolution’ benchmark with models obeying the integral constraint coming from the inferred rise with redshift of the total density of HI (derived from the statistics of HI absorption lines in the optical spectra of distant quasars; Peroux et al. 2001). In Fig. 1 the range in evolutions in the HI mass function from AR2004 are shown and in Fig. 2 their preferred Model ‘C’ is compared to those arising from two versions of GALFORM (B2004).
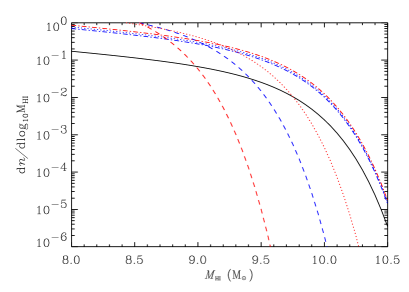
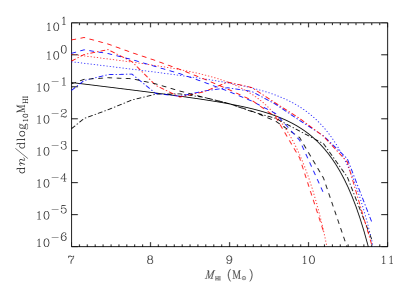
It is gratifying, if unsurprising, that at modest redshifts () there is good agreement between the (preferred) ‘Model C’ of AR2004 and the results of the ‘superwind’ semi-analytic model (B2004). The AR2004 Model C is implicitly hard-wired to reproduce the local HI mass function and has an evolutionary behaviour which tracks ‘blue’ (quiescently) star-forming blue galaxies, many properties of which are now well established at (see AR2004). The superwind semi-analytic model is effectively hard-wired to produce reasonable low-redshift HI results because its adjustable parameters have been set to values capable of reproducing the optical luminosity function of galaxies, and, for blue star-forming galaxies at least, the ratio of HI mass to blue luminosity is fairly constant. The ‘standard’ semi-analytic model fails to predict the HI mass function and, like Model B of AR2004, is disfavoured by the properties of blue galaxies at (AR2004); its evolutionary behaviour is probably ruled out by its poor fit to modern datasets (B2004). The superwind model fits available datasets well and will score a notable success if its prediction of the HI mass function at proves to be in accord with data obtained with the SKA.
Until such data are available, however, we show, in Fig. 3, the variation in the redshift distribution predicted by the full set of models considered by AR2004. As well as obvious variations in the redshift distributions, there are factor variations in the total number of objects expected. However, in all cases, we can be confident of large numbers222 This is vital for cosmological applications (Sec. 4) where the uncertainties in the galaxy power spectrum need to be dominated by cosmic variance not shot noise (Fig. 3; AR2004).() of intermediate redshift () HI-emitting galaxies in an SKA survey of the depth considered.
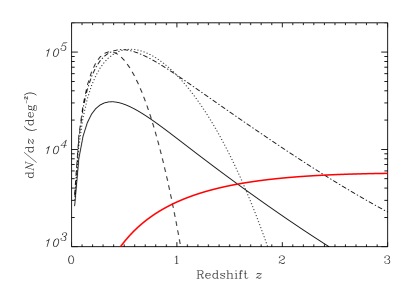
Measurements of with the SKA will obviously remove the uncertainties obvious in Fig. 3 and will, together with other SKA-based experiments, provide crucial new information on galaxy formation and evolution (Sec. 3). Deep-field observations with the SKA will push these studies to very high redshift (; V2004).
Reproducing Equation 6 of AR2004, for a given time of survey per square degree, the limiting HI mass that the SKA will be able to see is
| (1) |
where is a known333 Note that varies with the SKA realization. AR2004 argue that any realization will need to have a sizeable fraction ( per cent) of its collecting area in a compact (5-km diameter) core to avoid losing sensitivity to extended HI emission. constant (AR2004), is the luminosity distance, is defined by the field of view changing with frequency as (i.e. for the simple diffraction-limited case); is the fraction of the sensitivity relative to the SKA, is the line-of-sight width corresponding to the projected circular velocity of the galaxy (assumed to evolve systematically with ), is the SKA channel width, is the signal-to-noise level of detections; is the noise for an eight-hour integration (per channel) for each of two polarizations, its value increasingly weakly with declining frequency and hence increasing redshift); and is the integration time in hours for a given value of .444 We emphasise that is defined to be the usable field-of-view at an observed frequency of 1.4 GHz.
By definition, for the SKA. Indeed, from Fig. 3, it is clear that this value of is sufficient and necessary555 As the time to survey a given sky area to a given limiting flux density (the ‘mapping speed’) scales as , achieving at least is clearly crucial. to detect (and measure redshifts for) large numbers of HI galaxies out to in a few hours of SKA exposure. For large-sky-area surveys, the value of is crucial. AR2004 consider the case where the pointing centres of a survey are ‘tiled’ such that there is only a small overlap in the fields imaged at good (and roughly uniform) sensitivity at 1.4 GHz. In SKA designs with , the sky area over which surveys pick up HI-emitting objects increases with increasing redshift, and useful data at (say) is obtained from several different pointing positions. SKA designs with large values of (and a dependence) are therefore far more efficient at covering sky area, and hence cosmic volume. AR2004 demonstrate that ‘all hemisphere’ surveys become feasible provided,
| (2) |
where is the ratio of the instantaneous SKA bandwidth to the bandwidth required by the survey, and is the total duration of the survey in years. The case for the widest sky coverage possible is made in Sec. 4, so must be as large as possible and needs to allow for the coverage of the key GHz range in the fewest possible settings.
The properties of the HI-emitting galaxies also influence their detectability with the SKA. AR2004 consider these effects in detail (their assumptions have been adopted for Fig. 3), taking intrinsic disk sizes that scale and velocities that scale .
3 Galaxy evolution with the SKA
3.1 Context
Although we eagerly await proof by direct detection of a dark-matter particle, there is now a broad consensus that, after dark energy, the second most important contributor to the present-day energy budget of the Universe is Cold Dark Matter (CDM). In the context of the CDM model, the gravitational collapse of dark-matter halos has proved a compelling model for the formation of structure in the Universe. Robust numerical (‘N-body’) calculations are available for CDM (e.g. Jenkins et al. 2001) which are in quantitative agreement with conceptually simple analytic approximations based on the Press-Schechter formalism. The growth of structure is hierarchical with more massive structures forming, over time, from the merging of less massive precursors. The mass function of dark-matter halos can be calculated by simply evolving the tiny fluctuations in the density field at recombination, as measured by CMB experiments at , to the present-day () Universe.
We show in Fig. 4 the near-infrared (band) luminosity function of galaxies which would be inferred from the mass function of dark-matter halos if we adopted a universal mass-to-light ratio . We chose so that galaxies have roughly twice the space density of dark-matter halos of mass . This is line with the observation that a typical galaxy is grouped with other galaxy (Eke et al. 2004). The value adopted () is also in line with direct measurements of mass-to-light ratios in systems dominated by binary galaxies. It is obvious from Fig. 4 that a close mapping between the dark-matter mass function and the galaxy luminosity function occurs only at this specific mass scale, with a clear lack of starlight in both more and less massive halos. A complicated mapping is, of course, expected because galaxies are made up of baryonic material which, by radiating away or absorbing energy, or by participation in bulk flows, can achieve very different spatial distributions to the CDM.
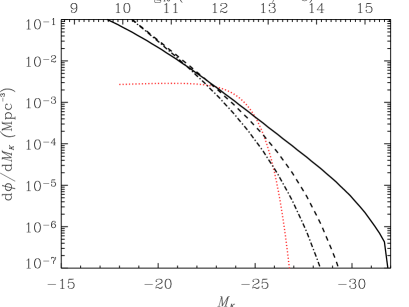
There have been many attempts to understand the complicated behaviour of baryons in the context of galaxy formation based, typically, on semi-analytic techniques (e.g. Benson et al. 2003; B2004). The lack of low-mass galaxies is explained by baryons being heated to high enough temperatures that they have difficulty in becoming bound to low-velocity-dispersion halos. It is not clear whether this heating is a ‘universal’ process like reionization (in which case, perhaps, the only low-mass galaxies to form were those which formed before reionization in protoclusters) or is the result of more localised and recent feedback effects due, e.g., to supernovae-driven winds resulting from the first bursts of star formation (Dekel & Silk 1986). The lack of high-mass galaxies is linked to the very long cooling times of the low-density gas which is associated with these halos (White & Rees 1978), with the low densities being the inevitable result of these halos collapsing only recently in an expanding Universe. However, this process alone cannot explain the exponential decline in the number density of the most massive galaxies (e.g. Benson et al. 2003), and additional physical feedback mechanisms are invoked. These range from the fairly weak (but common) feedback events associated with starburst-driven winds (e.g. Silk 2003), through quasar-driven winds (Silk & Rees 1998) to ultra-powerful (but rare) bow shocks associated with radio galaxies, the latter carrying sufficient power to influence hundreds of galaxies in protoclusters (Rawlings & Jarvis 2004).
With such a bewildering range of physical processes, and of course many adjustable parameters in their semi-analytic manifestation, there are great challenges in developing semi-analytic models with any serious predictive power. Modellers are responding to these challenges by extending, as increasing computer power allows, the use of direct numerical simulations of baryon-related physics, and also by confronting their models with data collected across all the available wavebands (B2004; Baugh et al. 2004b). Alongside these efforts there is a clear imperative to obtain the best datasets possible in the realistic hope that models and data will eventually converge on a coherent description of galaxy formation and evolution.
3.2 The SKA rôle
We consider first HI surveys with the SKA (Sec. 2; AR2004, V2004). Assuming a wide-field-of-view solution for the SKA (Eqn. 2), an ‘all hemisphere’ HI SKA survey would contain galaxies out to (AR2004). This redshift survey would increase the cosmic volume, and also the number of objects surveyed, by a factor over current state-of-the-art optical surveys like the 2-degree-Field Galaxy Redshift Survey (2dFGRS) and the Sloan Digital Sky Survey (SDSS). The HI properties of more distant galaxies will be probed by deep pointed SKA surveys (sometimes targeted on massive rich clusters to exploit the benefits of amplification by gravitational lensing). Although sensitivity considerations will limit studies of HI emission to (see Kanekar & Briggs 2004 for methods of probing higher redshift with HI absorption), if we, once again, assume a wide-field-of-view SKA realization, very large samples of distant galaxies can be studied in HI. A single-pointing SKA ultra-deep field totalling days exposure would reach a 5- HI mass limit (Fig. 1 of AR2004; V2004) and hence should (Sec. 2) get close to the break in the HI mass function at . Assuming and , the survey would have an effective field of view of and detect high-redshift () galaxies. The surface density of these objects would therefore be up to -times higher than objects detected currently by the optical Lyman-break technique, but again the key breakthrough would come by virtue of the huge field of view, generating a high- redshift survey outnumbering current samples by a factor .
Regardless of the unique information provided by HI, statistical studies of galaxies in the range , will be revolutionised by the SKA. In Sec. 4 we focus on the cosmological applications of measuring the galaxy power spectrum, but essentially all the investigations made possible by the 2dFGRS and SDSS programmes (i.e. the dependence of galaxy properties on internal and dark-matter halo properties, as well as larger-scale clustering properties), could be pursued by the SKA across a much larger range of redshifts, and with errors bars on many of the critical calculated quantities reduced by factors . This, together with weak-lensing measurements of the dark matter (Sec. 4.4), will yield a detailed picture of how galaxies, of all masses and in all environments, trace the underlying dark-matter fluctuations. It has become clear from the 2dFGRS and SDSS results that this so-called ‘galaxy bias’ is likely to be stochastic, scale-dependent, non-local and non-linear (e.g. Wild et al. 2004). Galaxy surveys of the size generated by the SKA will be needed to obtain a full understanding of galaxy bias which lies at the very heart of understanding how galaxies form and evolve.
To focus now on the new information provided by HI, we note first that the presence of a galaxy in an SKA redshift survey will be determined by the cold gas mass () rather than the complicated mix of stellar mass and star-formation rate familiar from, e.g. optical Lyman-limit surveys. It should therefore be possible to make much cleaner tests of specific models for galaxy formation and evolution. For example, recent debate concerning galaxy evolution has highlighted uncertainties due to the variation of the timescale for star formation with epoch and halo (dark-matter) mass. Different assumptions about this timescale (defined by , where is the star formation rate) are the main reason for the huge difference between the predictions of the two semi-analytic models shown in Fig. 2 (B2004). SKA surveys will measure via HI and estimate via non-thermal and thermal radio emission (with spatial and spectral separation of these components available to refine these estimates; V2004). Gas and star formation properties can be studied as a function of dark-matter properties through measurement of internal (‘Tully Fisher’) HI velocity dispersions and cluster velocity dispersions.
In addition to the gas trapped in galaxy potential wells, where the star formation takes place, SKA will also chart the HI environments and hence give a handle on the mechanism triggering star formation and the process of gas and/or satellite galaxy accretion. An obvious illustration of the diagnostic power of HI imaging is the nearby Andromeda group (Yun et al. 1994). Without the HI information, which clearly shows that the galaxies are “communicating”, our interpretation of the star-formation activity in, e.g. M82, would not be as solid as it is now.
SKA surveys should make clear how spiral galaxies formed and evolved. They will show where and when the gas is converted into stars and whether galaxy formation is dominated by gas accretion or the process of galaxy merging. The HI mass function at low redshift is dominated by such late-type systems, and as discussed in Sec. 2, we have some confidence in extrapolating their ‘quiescent’ mode of star formation at least as far as redshifts . However, as should be clear from Fig. 2, current models make very different predictions as to the precursors of these galaxies at even moderate redshifts . Indirect evidence from HI absorption (Kanekar & Briggs 2004; AR2004) suggests that, at , most of these systems are not the well-formed disc systems we see today, but smaller precursor objects. The SKA will directly map the way in which these objects merge to form the local population of spiral galaxies.
SKA surveys should also map out how giant elliptical galaxies formed and evolved. A persistent debate in astrophysics has been whether these objects formed their stars during a ‘monolithic’ collapse, or were built up hierarchically. This debate is sometimes couched as a fundamental test of CDM models, but this is rather misleading. From Fig. 4, we can see that the addition of feedback mechanisms to the standard hierarchical picture can explain the origin of the exponential decline in the galaxy luminosity function as the result of ‘monolithic’ creation events associated with dramatic feedback episodes. This debate is once more intimately related to assumed timescales. On one hand, Granato et al. (2004) argue that is small for the most massive protogalaxies, which are then expected to be the first to form in dramatic star bursts at high redshift. On the other hand Baugh et al. (2004b) get good fits to current observational data with their superwind semi-analytic model, in which high constant values of are associated with quiescent (disk) star formation so that most of the stellar mass in giant ellipticals is built up within disks, and simply rearranged into spheroids during mergers. Deep HI and continuum666 Continuum surveys to an rms depth ‘come for free’ alongside the HI surveys. Note, however, that scientific exploitation of the continuum surveys typically needs the full ( arcsec at 1.4 GHz) angular resolution of the SKA (e.g. for the weak lensing experiment described in Sec. 4.4), whereas most of the power of the HI survey comes from low-resolution data from the ‘SKA core’. It is plausible that the core will be surveying the sky before significant numbers of long baselines are available. surveys with the SKA will determine the true situation. Further crucial physical information on distant proto-elliptical galaxies will accrue from SKA HI absorption studies, both of ‘typical’ systems and systems observed during feedback events (Kaneker & Briggs 2004; Jarvis & Rawlings, 2004).
The origin of dwarf galaxies will also be open to direct investigation with the SKA. The lack of dwarf galaxies relative to dark matter in Fig. 4 is normally ascribed, at least in part, to the suppression of their formation after the epoch of reionization (e.g. Benson et al. 2003). The SKA will have the sensitivity to detect the star-formation signature of these objects to (V2004) and hence can look for direct evidence that the energy input into baryons during reionization has a profound impact on the formation of these objects.
4 Cosmology with the SKA
4.1 Context
Probing the nature of dark energy represents the new frontier in cosmology. The spirit here (and BABR) is to use the measurement of as an example of how improving the precision of cosmological parameter estimation from the -per-cent level to the -per-cent level is likely to yield fundamental advances in physics.777 Some physicists have a firm belief that the dark energy is Einstein’s , and hence that at all times and places. We caution that only a decade or so ago many physicists had an equally firm belief that and that dark energy didn’t exist at all! We illustrate this with a series of specific experiments which represent our ‘best guess’ as to the key techniques to pursue with the SKA. In Sec. 4.6 we make some more speculative remarks concerning other potential cosmological discoveries with the SKA.
4.2 Why CMB studies are limited
There has been amazing progress in measuring cosmological parameters using observations of the CMB, but a few caveats are important to bear in mind. Although the WMAP CMB results are extremely impressive, the CMB tells us a complicated mixture of information on all of the cosmological parameters. Therefore the majority of the key results on individual cosmological parameters using the WMAP data have actually come from combining it with other information, such as that from galaxy redshift surveys (e.g. Spergel et al. 2003). The significance of ‘orthogonal’ constraints in the key slices of parameter space are best illustrated by the combination of current CMB constraints (measuring spatial flatness, i.e. ), with independent measurements using high-redshift supernovae (measuring a very different combination of and ). This gain over ‘CMB only’ results, together with the importance of targeted measurement of key parameters such as (e.g. the HST Cepheid variable Key Project; Freedman et al. 2001), is emphasised by Greenhill (2004). There is now a satisfying agreement between constraints from CMB observations, galaxy redshift surveys, supernovae, cluster abundances and measurements of (e.g. Spergel et al. 2003). This is why most cosmologists now believe in a dark energy component which does not cluster with the galaxies and which is now causing an acceleration in the expansion of the Universe .
Another important lesson to be learnt from current CMB-based studies is the danger of ‘hidden theoretical priors’. It is widely believed that CMB observations have proven that the Universe is spatially flat, whereas, as emphasised by Efstathiou (2003), there is not yet adequate precision to rule out a Universe with very significant spatial curvature; precise spatial flatness remains an assumption made on the basis of a theoretical belief in cosmic inflation. Relaxation of this assumption considerably increases uncertainties on all the other cosmological parameters.
After its launch in 2007, the Planck satellite will provide the next observational step forward in CMB astronomy. However, there are good reasons to believe that it will not on its own yield great breakthroughs in studies of dark energy. This is because the direct influence of dark energy becomes apparent only in the older Universe. Its influence on the CMB is subtle, e.g. the precise angular positions of features through the angular-diameter distance , and secondary anisotropies like the late-time Integrated Sachs Wolfe (ISW) effect. Also, error bars on measurements of the CMB temperature power spectrum will only be significantly improved on relatively small angular scales since existing data on large scales (i.e. multipoles ) are already limited by cosmic variance.888 For angular (CMB) measurements the cosmic variance scales as the reciprocal of , where is the fraction of sky covered. CMB temperature data can only be significantly improved in the regime () currently covered by small-sky-area, ground-based experiments.
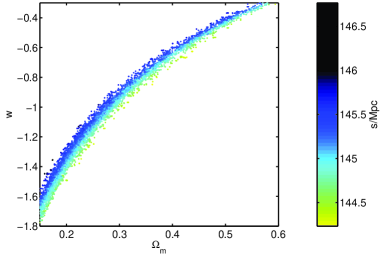
In Fig. 5 we show the results from simulated measurements with Planck. The value of the combination of parameters will be fixed to 1 per cent accuracy, but the wide range in allowable values of results from the well known difficulty, with CMB data alone, of breaking the degeneracy between these parameters. Let’s assume for now that this degeneracy has been broken by an extremely accurate (1 per cent) measurement of (Sec. 4.5), meaning is then known to few-percent accuracy. Even then, it is clear from Fig. 5 that the dark energy parameter cannot be measured to any better accuracy than , which is not that far from the accuracy of current measurements. The reasons for this are easy to understand when we look at the simulated points in Fig. 5, colour-coded according to the physical size (in comoving Mpc) of the sound horizon at recombination. Even assuming exact spatial flatness, irreducible uncertainties result from the fact that this ‘standard ruler’, represented by the value of , is ‘squashable/extendable’ at the few-per-cent level. It is impossible to tell the difference between an intrinsically smaller (slightly squashed) standard ruler and a greater angular diameter distance to recombination resulting from, at any , a more negative value of .
As has already been shown by the improvements obtained by combining existing CMB data and galaxy redshift surveys of the local Universe (e.g. the 2dFGRS; Percival et al. 2002), the Planck CMB data would benefit enormously from being combined with a very high precision measurement of the galaxy power spectrum . By measuring redshifts for all galaxies in the sky to , one covers a cosmic volume times larger than the 2dFGRS, and it will be possible to drastically reduce error bars on the power spectrum at all wavenumbers . It will also be possible to measure the large-scale (small ) modes for which ‘nuisance’ effects such as non-linear growth, peculiar velocity and galaxy bias are minimised (Fig. 2 of BABR). In Sec. 4.3 we argue that an ‘all hemisphere’ HI survey with the SKA would deliver the accurate measurement of required for the measurement of .
4.3 Experiment I: wiggles in the galaxy power spectrum
This experiment (Sec. 3 of BABR) aims to map out the acoustic oscillations, or wiggles, in the power spectrum as a function of redshift. These wiggles are seen in the CMB temperature power spectrum but have yet to be detected in any redshift survey of discrete objects. One way of seeing why this is such a powerful technique comes from the following crude argument (see e.g. Hu & Haiman 2003 for a thorough discussion). Imagine rods of fixed (comoving) physical size (the sound horizon at recombination; see Sec. 4.2) arranged to be perpendicular to the line of sight. Measurement of the angular size of these rods, via an SKA redshift survey, will give a measurement of at some effective redshift . Together with the measurement of from the CMB (Sec. 4.2), there are now two equations which can be combined to cancel , and make accurate measurements of using the ratio . Extra information comes from rods arranged with significant radial components since radial lengths are dependent on the dependent Hubble constant and, on large scales, isotropy can be assumed just as in the classic Alcock-Paczynski test. Once has been fixed, can then also be accurately measured yielding, finally, an accurate standard ruler in cosmology. The redshift range is key for these experiments because dark energy probably affects only at low to intermediate , but one must reach a redshift to both accrue a sufficiently huge cosmic volume and to ensure that not too many of the wiggles have been erased by non-linear gravitational clustering (Fig. 4 of BABR).
This ‘wiggles’ experiment can, of course, be performed by redshift surveys with optical/near-infrared telescopes and these are being planned (e.g. Blake & Glazebrook 2003). The key advantage for at least of some realizations of the SKA is the capability of a very wide field of view, making ‘all hemisphere’ surveys a realistic possibility.999 There are physical limits on the field of view of for multi-object spectrometers on large optical/near-infrared telescopes, making ‘all hemisphere’ optical/near-infrared redshift surveys impracticable. As, roughly speaking, error bars on scale as the square root of the cosmic volume surveyed (noting from Fig. 3 that cosmic variance dominates over shot noise due to the high surface density of HI-emitting galaxies), only the SKA looks capable of delivering the accuracy on required to make a stringent test of the cosmological constant ‘model’ for dark energy (Fig. 5 of BABR).
AR2004 have demonstrated that ‘all hemisphere’ SKA surveys are needed because one gains cosmic volume linearly with time as one covers sky area. However, once this survey is completed, it will clearly be worth going deeper in redshift because, although the volume gains are slower, and the power of the tests on may decline, this will be the only way of beating down cosmic variance still further. Assuming, as in Sec. 3 , and hence a field of view for HI-emitting galaxies of (assuming ), it would take 10 years to survey the whole hemisphere to . This suggests once more (c.f. Eqn. 2) that is the bare minimum requirement for most cosmological studies with the SKA.
What is the competition? Rather than measuring wiggles and using a ‘standard ruler’ approach, the proposed JDEM(SNAP) satellite will use high-redshift supernovae as ‘standardized candles’ to make measurements of the luminosity distance as a function of redshift (Aldering et al. 2004). As , and are all simply related, this will produce confidence contours in the plane which are very closely aligned with those of the SKA wiggles experiment. However, there are worries about whether systematic effects (e.g. changes of properties of supernovae with epoch-dependent galaxy environments) will limit the SNAP supernova experiment well before the theoretical limits are reached. No serious systematic problems with the SKA wiggles experiment are expected (BABR).
4.4 Experiment II: weak gravitational lensing
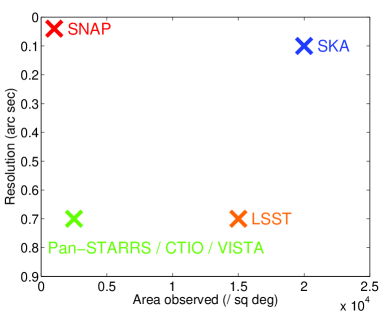
We highlighted in Sec. 4.2 the power of obtaining ‘orthogonal’ constraints on cosmological parameters, and for dark energy the two parameters often focused upon are and , the present day value and epoch (redshift) variation of the dark energy parameter . This is also the philosophy behind dark energy experiments with SNAP, hence the SNAP team proposal of a weak gravitational lensing experiment alongside their supernova experiment (Refregier et al. 2004). This would yield significantly different constraints on and because as well as measuring the geometrical effects of dark energy, the cosmic evolution of the dark matter power spectrum (as measured by weak lensing) reflects the competing effects of gravity/dark energy on the growth/dispersion of large-scale structure. However, as illustrated by Fig. 6, it is the small fields of view delivered by the SNAP weak lensing surveys that is the critical limitation. It is worth emphasising here (Fig. 6 of BABR) that achieving very wide fields of view for weak lensing is important not only for beating down cosmic-variance-dominated101010 Cosmic-variance-limited measurements of the dark-matter power spectrum, like those of , have error bars scaling as cosmic volume , and hence as . error bars, but also for making precise measurements at scales much larger than those at which strong, non-linear gravitational clustering effects are important (and difficult to account for).
Although there are uncertainties in how well SKA surveys will measure cosmic shear (due largely to the, as yet, unknown shapes of objects in the faint radio population), it seems very likely (BABR) that there will be a more-than-adequate surface density of suitably shaped background sources for measuring shear. The well behaved point spread function of a synthesis array like the SKA should ensure superb image quality, and the extra leverage supplied by ‘lensing tomography’ (Hu 1999) should accrue from the redshift information available from HI surveys.
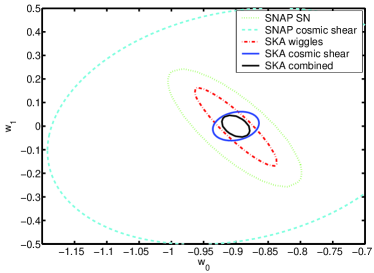
Cosmic shear experiments likely to happen before those performed by the SKA are represented in Fig. 6. An increased sky area is essential for small random errors on the dark energy parameters, hence the plans for the large optical telescope (the LSST; http://www.lsst.org/lsst_home.shtml) which will image large sky areas optically. However it is unknown at what point ground based optical experiments will be hampered by systematic effects associated with the measurement of galaxy shears using ground-based (seeing-limited) optical data. This is of course why the SNAP (space-based) weak lensing experiment is judged worthwhile, but note here how, assuming a wide field of view realization for the SKA, SNAP efforts on lensing may be quickly trumped by surveys with the SKA. The improvements on measurements of dark energy with the SKA are illustrated in Fig. 7.
4.5 Experiment III: from water masers
In the early 21st century, the combination of CMB (Planck) and galaxy redshift survey (SKA) data will make measurements of and its time variation with unprecedented levels of accuracy (see BABR). The ‘nuisance parameter’ will be measured along the way, but learning the lessons of Sec. 4.2, the conclusions concerning dark energy will be particularly compelling if is also measured independently to high (1-per-cent) accuracy. Current 10-per-cent-accuracy estimates of are obtained via measurements of ‘Standard Candles’ that are limited by intrinsic scatter and systematic errors. Even the best estimate is calibrated using the controversial distance to a single and possibly unrepresentative (metal-poor) galaxy, the LMC. The SKA is likely to play a central rôle in improving on this situation (Greenhill, 2004).
Moving to a 1-per-cent level of accuracy for the measurement of will require a new method which, to overcome systematics, measures reliable geometric distances to galaxies, and which, to overcome peculiarities in the local Hubble expansion rate, reaches to reasonable redshifts. This can be achieved by using the SKA to find, map, and monitor water maser sources111111The rest-frame frequency of the water maser line is , so this requires high-frequency capability for the SKA. within (roughly edge on) accretion disks at sub-parsec radii (from supermassive black holes) out to distances of a few hundred Mpc. Although only a fraction of masers turn out to be relatively simple dynamical systems suited to detailed modelling, a very large number of masers will be discovered and the absolute number of suitable systems will be orders of magnitude greater than today. The result will be systems with well measured black hole masses, disk geometries, orientations, and mappings between angular and physical sizes.
Amongst the compelling features of this method are: (i) evidence from the remarkable study of NGC4258 (Herrnstein et al. 1999; Humphreys et al. 2004) that the method works well in practice; (ii) relatively few sources of systematic uncertainty given highly constrained models for the most suitable systems; and (iii) the expectation of uncorrelated uncertainties in individual distance measurements that should ensure that accuracy on increases as , where, to get to the required 1-per-cent level of accuracy, need only be a few hundred out of the many thousands of extragalactic water maser systems that will be discovered by the SKA.
4.6 Cosmology beyond dark energy
We have demonstrated that the exquisite galaxy power spectrum measured by the SKA will, together with data from Planck and other CMB experiments, provide the basis for major advances in cosmology. We have used studies of the dark energy parameter to illustrate this. Here, we assume instead that, with much improved accuracy on measuring , dark energy still appears to behave like Einstein’s cosmological constant. In this case, what would the SKA generate in the way of important new results? Here, in rough order of the wildness of the speculation, are a few possibilities.
-
•
Can we detect the effects of dark energy through the late-time ISW effect? Gravitational potential wells decay rather than grow under the influence of dark energy, and there have been claims of a detection of the predicted correlation between large-scale () CMB anisotropies and the low-redshift matter distribution (e.g. Boughn & Crittenden 2002). The combination of Planck and SKA data will establish the reality of the ISW signal, and can be used to establish the clustering properties of dark energy (e.g. Weller & Lewis 2003).
-
•
Can we tie down the physics of inflation? Combining CMB and SKA measurements will allow new measurements of the scalar spectral index of the power spectrum of fluctuations. The value of this parameter, if it is indeed a single parameter, or, as is more likely, its function of scale (the so-called running scalar spectral index) are predicted outputs from specific inflationary models. The CMB power spectrum is also influenced by tensor (gravitational wave) modes whereas the SKA is not. Analysis of combined CMB/SKA datasets will have great power in measuring the running scalar spectral index and isolating the tensor component in the CMB.
-
•
Are the primordial fluctuations purely adiabatic? It is commonly assumed that the primordial perturbations are in energy density (adiabatic), but more general models add in perturbations in entropy density (isocurvature) which, being spatially homogeneous in energy density, leave no perturbation in spatial curvature. Bucher et al. (2004) have shown that the existence of such modes cannot be ruled out by current datasets, implying that the power of the combined CMB/SKA dataset will be needed to make significant progress. Again, such measurements allow sensitive tests of models for inflation.
-
•
Are the primordial fluctuations Gaussian? Searches for evidence of non-Gaussianity in the statistics of the primordial fluctuation spectrum have, from CMB data alone, so far proved negative (Komatsu et al. 2003). The SKA ‘all hemisphere’ survey will detect large numbers of superclusters, the evolved counterparts of rare fluctuations in the quasi-linear regime, with which to make sensitive independent tests.
-
•
Do the values of the physical constants change with time? As reviewed by Curran et al. (2004), there have been recent claims that the value of the fine structure constant varies with cosmic epoch. Curran et al. demonstrate that SKA observations of redshifted radio absorption lines hold the key to confirming this remarkable result and to discovering changes in other physical constant (e.g. the ratio of electron and proton masses). Many theories for unifying gravity with other fundamental forces predict such variations, and the SKA may measure them.
-
•
Are there sharp features in and are they a signature of ‘transPlanckian’ physics? The binned power spectrum derived from CMB results has some ‘glitches’ that have been interpreted as the results of new physics on scales smaller than the Planck length which were imprinted on during inflation (e.g. Martin & Ringeval 2004). Precision large-scale measurements of with the SKA will establish the reality and location of any glitches, and look for evidence of such new physics.
-
•
Is the Universe precisely spatially flat? Recalling the discussion of hidden theoretical priors in Sec. 4.2, we note that one explanation of the low quadrapole signal in the CMB is that the Universe has a small, but positive, curvature and a which cuts off on this curvature scale (e.g. Efstathiou 2003). Precision cosmology led by the SKA could, for example, confirm that , and that the Universe is closed.
-
•
Can we see the copies of our own Local Group predicted in a small Universe? Another explanation of the low CMB quadrapole is that the Universe is small but has a weird topology, being small but multiply connected (e.g. Cornish et al. 2004). If the length scale of its fundamental domain is smaller than the particle horizon, then it should be possible to see a ‘ghost’ of our local environment at an earlier epoch. A great triumph of a semi-analytic model for galaxy formation would be a prediction of the past properties of the Local Group that was so precise that a recognisable ghost pattern of the Local Group could be seen at high redshift. With its huge sensitivity (e.g. to the young, starbursting precursors of the Milky Way and Andromeda) and sky coverage, the SKA would be the premier instrument to search for such effects.
5 Concluding remarks
Studies of galaxy evolution and dark energy can be revolutionised by the SKA but are demanding on the design parameters of its realization.
The HI surveys are obviously a ‘unique selling point’ for the SKA, and through the necessity of detecting galaxies out to at least redshift , provide a simple justification for the raw sensitivity needed. We have argued that cosmological applications, illustrated mainly here by the acoustic oscillations (‘wiggles’) experiment, requires the ability to do ‘all hemisphere’ surveys mapping galaxies to , and hence wide instantaneous fields of view (Eqn 2).
Continuum surveys are vital for galaxy evolution studies as they can detect star-forming galaxies of all types out to extreme redshifts. In cosmology, weak gravitational lensing experiments with these continuum surveys are likely to be revolutionary given the unique SKA combination of wide field of view and stable point spread function.
We have also argued that a high-frequency capability121212 Experiment III (Sec. 4.5; Greenhill 2004) requires the SKA frequency range reaches GHz to observe water masers, and requires long (intercontinental) baselines with high spectral-line sensitivity. for the SKA may be vital for cosmological studies because of the great promise shown by extragalactic water masers as the future method of choice for measuring to 1-per-cent accuracy.
This combination of experiments proposed with the SKA will be essential in transitioning from the 10-per-cent accuracy currently achieved by ‘precision’ cosmology to the 1-per-cent accuracy needed, for example, to make the first precision study of the properties of dark energy. The SKA datasets will revolutionise studies of galaxy formation and evolution by measuring the way in which galaxies trace dark-matter structures (i.e. bias) and by determining the physical processes that generated all types of galaxies from low-luminosity dwarves to the most massive ellipticals.
In galaxy evolution studies, the SKA will add unique information from the radio band to data to be obtained by other upcoming facilities like ALMA, JWST, giant optical telescopes and high-energy satellite missions. In cosmological studies, a wide-field-of-view realization of the SKA can easily outperform projects like LSST and JDEM(SNAP) which are largely being designed to answer questions concerned with dark energy. The SKA will replace optical telescopes as the machine for delivering the huge redshift surveys needed to push forward cosmological research beyond what is possible with CMB-dominated datasets. The SKA should aim, like the Planck satellite for CMB studies, to provide results limited by cosmic variance rather than sky area coverage.
ACKNOWLEDGEMENTS
SR is grateful to the UK PPARC for a Senior Research Fellowship, and for financial support from the Australia Telescope National Facility. FBA thanks PPARC for a Gemini Research Studentship and the SKA Project Office for financial support. SB and CMB are supported by the Royal Society. CB acknowledges Karl Glazebrook for a valuable collaboration developing simulations of acoustic oscillations and also the SKA Project Office for financial support. We thank Chris Carilli, Jo Dunkley, Phil Marshall and Richard Massey for useful discussions.
References
- [1] Abdalla, F. B., Rawlings S., 2004, MNRAS, in press
- [2] Aldering, G., et al., 2002, Proceedings of the SPIE, 4836, 61
- [3] Aldering, G., et al., 2004, PASP, submitted (astro-ph/0405232)
- [4] Baugh, C. M., et al., 2004a, (this volume)
- [5] Baugh, C. M., et al., 2004b, MNRAS, in press, astro-ph/0406069
- [6] Benson A. J., et al., 2003, ApJ, 599, 38
- [7] Binney, J. 2004, MNRAS, 347, 1093
- [8] Blake, C. A., Abdalla, F. B., Bridle, S. L., Rawlings, S., 2004, (this volume)
- [9] Blake C.A., Glazebrook K., 2003, ApJ, 594, 665
- [10] “Board on Physics and Astronomy”, 2003, Connecting Quarks with the Cosmos: Eleven Science Questions for the New Century, Washington: The National Academies Press
- [11] Boughn S. P., Crittenden R. G., 2002, PhRvL, 88b1302
- [12] Bucher M., et al., 2004, PhRvL, submitted, astro-ph/0401417
- [13] Cole S., et al., 2001, MNRAS, 326, 255
- [14] Cole S., Lacey C. G., Baugh C. M., Frenk C. S., 2000, MNRAS, 319, 168
- [15] Cornish N. J., Spergel D. N, Starkman, G. D., Komatsu E., 2004, PhRvL, 92t1302C
- [16] Curran S.J., Kanekar N., Darling J.K., 2004, (this volume)
- [17] Dekel A., Silk J., 1986, ApJ, 303, 39
- [18] Efstathiou G., 2003, MNRAS, 343L, 95
- [19] Eke V. R., et al., 2004, MNRAS, 348, 866
- [20] Freedman, W. L., et al., 2001, ApJ, 553, 47
- [21] Granato, G. L. et al., 2004, ApJ, 600, 580
- [22] Greenhill, L. J., 2004, (this volume)
- [23] Herrnstein, J. R., et al., 1999, Nature, 400, 539
- [24] Humphreys, E.M.L., et al., 2004, ASP Conference Series, in press, astro-ph/0308334
- [25] Hu, W., 1999, ApJ, L21-L24
- [26] Hu, W., Haiman, Z., 2003, PhRvD, 68f3004H
- [27] Jarvis M. J., Rawlings S., 2004, (this volume)
- [28] Jenkins A., et al., 2001, MNRAS, 321, 372
- [29] Kanekar N., Briggs F.H., 2004, (this volume)
- [30] Keres D., et al., 2004, MNRAS, submitted, astro-ph/0407095
- [31] Komatsu E., et al., 2003, ApJS, 148, 119
- [32] Martin J., Ringeval C., 2004, PhRvD, 69, 83515
- [33] Meyer M. J., et al., 2004, MNRAS, 350, 1195
- [34] Percival W.J. et al., 2002, MNRAS, 337, 1068
- [35] Peroux C., et al., 2001, ApSSS, 277, 551P
- [36] Rawlings S., Jarvis M. J., 2004, MNRAS, in press
- [37] Refregier A., et al., 2004, AJ, 127, 3102
- [38] Silk J., 2003, MNRAS, 343, 249
- [39] Silk J., Rees M. J., 1998, A&A, 331, 1
- [40] Spergel, D. N., et al. 2003, ApJS, 148. 175
- [41] van der Hulst, J. M. et al., 2004, (this volume)
- [42] Weller J., Lewis A. M., 2003, MNRAS, 346, 987
- [43] White S. D. M., Rees M., 1978, MNRAS, 183, 341.
- [44] Wild V., et al., 2004, MNRAS, in press, astro-ph/0404275
- [45] Yun, M. S., Ho, P. T. P., Lo, K. Y. 1994, Nature, 372, 530
- [46] Zwaan, M. A., et al. 2003, AJ, 125, 2842