Obscuration of Active Galactic Nuclei by Circumnuclear Starbursts
Abstract
We examine the possibility of the active galactic nucleus (AGN) obscuration by dusty gas clouds that spurt out from circumnuclear starburst regions. For the purpose, the dynamical evolution of gas clouds is pursued, including the effects of radiation forces by an AGN as well as a starburst. Here, we solve the radiative transfer equations for clouds, taking into consideration the growth of clouds by inelastic cloud-cloud collisions and the resultant change in optical depth. As a result, it is shown that if the starburst is more luminous than the AGN, gas clouds are distributed extensively above a galactic disk with the assistance of radiation pressure from the starburst. The total covering factor of gas clouds reaches a maximum of around 20%. After several yr, gas clouds with larger optical depth form by cloud-cloud collisions and thereafter the clouds fall back due to weakened radiation pressure. The larger clouds undergo runaway growth and are eventually distributed around the equatorial plane on the inner sides of circumnuclear starburst regions. These clouds have an optical depth of several tens. The result is qualitatively consistent with the putative tendency that Seyfert 2 galaxies appear more frequently associated with starbursts than Seyfert 1s. On the other hand, if the AGN luminosity overwhelms that of the starburst, almost all clouds are ejected from the galaxy due to the radiation pressure from the AGN, resulting in the formation of a quasar-like object. The origin of obscuration of AGNs is discussed with relevant observations.
1 INTRODUCTION
The origin of the active galactic nucleus (AGN) obscuration is a key issue for a thorough understanding of AGNs. In the context of the unified model, an obscuring torus has been thought to be responsible for the AGN obscuration, and the dichotomy of AGN types has been attributed to the viewing angle toward the AGN (see Antonucci 1993 for a review). However, recent observations on circumnuclear regions of AGNs have gradually revealed that Seyfert 2 galaxies appear to be more frequently associated with starbursts than Seyfert 1s (Heckman et al. 1989; Maiolino et al. 1997, 1998a; Perez-Olea & Colina 1996; Hunt et al. 1997; Malkan, Gorjian, & Tam 1998; Schmitt, Storchi-Bergmann, & Fernandes 1999; Storchi-Bergmann et al. 2000; Gonzalez Delgado, Heckman, & Leithere 2001). Furthermore, quasars are mostly observed as type 1 AGNs, regardless of the star formation activity in host galaxies (Barvainis, Antonucci, & Coleman 1992; Ohta et al. 1996; Omont et al. 1996; Schinnerer, Eckart, & Tacconi 1998; Brotherton et al. 1999; Canalizo & Stockton 2000a, 2000b; Dietrich & Wilhelm-Erkens 2000; Solomon et al. 2004). In addition, Ueda et al. (2003) have recently found from the hard X-ray luminosity function of AGNs that the fraction of X-ray absorbed AGNs decreases with the AGN luminosity. These recent findings seem beyond understanding in the context the unified model.
The frequent association of circumnuclear starbursts with Seyfert 2 galaxies suggests that the obscuring of AGNs could be physically related to the starburst events. Ohsuga & Umemura (1999, 2001) have considered a physical mechanism to link the AGN type to the circumnuclear starburst, where an obscuring wall composed of dusty gas can form with the assistance of the radiation pressure from circumnuclear starbursts. More recently, Wada & Norman (2002) have performed three-dimensional hydrodynamic simulations on the nuclear starburst regions, and found that the gas blown out from a galactic disk due to multiple supernova explosions in a starburst builds up a torus-like structure in a highly inhomogeneous and turbulent manner. Both models may provide potential mechanisms to relate the starburst events with the obscuring of AGNs. But, Ohsuga & Umemura focused just on the equilibrium configuration of dusty gas, and Wada & Norman did not include radiation forces, which are likely to play an important role in the early phase of starbursts. Hence, in order to construct a more realistic model, the dynamical evolution of obscuring materials should be solved, including radiation forces. This requires a radiation-hydrodynamic (RHD) simulation in three-dimensional space. However, a full RHD simulation is extremely time consuming even using the state-of-the-art computational facilities. In this paper, we solve the dynamics of discrete clouds under the adhesion approximation, where the growth of clouds is brought by inelastic cloud-cloud collisions. Simultaneously, to properly include the radiation forces, we solve the radiation transfer equation for clouds, taking the change in optical depth due to the cloud growth into account. In §2, the circumnuclear regions and gas clouds are modeled. In §3, we formulate the equation of motion for gas clouds including radiation forces. In §4, the numerical results are shown, and the distribution of gas clouds and the obscuration of AGN are analyzed. In §5, based on the present results, we discuss the origin of AGN obscuration and the relation to narrow line regions. §6 is devoted to the conclusions.
2 MODEL
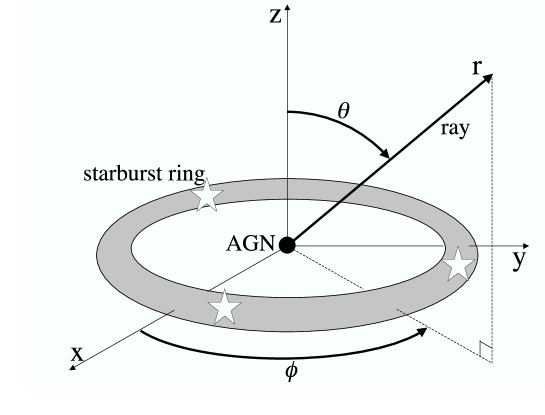
Recent high-resolution observations have revealed circumnuclear starburst regions with a radial extension of 10 pc up to 1 kpc, which frequently exhibit a ring-like feature (Pogge 1989; Wilson et al. 1991; Forbes et al. 1994; Marconi et al. 1994; Mauder et al. 1994; Buta, Purcell, & Crocker 1995; Barth et al. 1995; Leitherer et al. 1996; Maoz et al. 1996; Storchi-Bergmann, Wilson, & Baldmin 1996; Elmouttie et al. 1998). In this paper, we suppose a starburst region in ring configuration with a radius of 200 pc and the total mass of starburst ring is assumed to be , similar to the model by Ohsuga & Umemura (2001). Also, we settle a galactic bulge component with the mass of and the radius of kpc.
In some galaxies, a galactic bulge solely cannot explain the observed rotation curve. For instance, in the circumnuclear regions of the Circinus galaxy, the rotation velocity requires an additional component with within a starburst ring (Elmouttie et al. 1998). Also, the stellar velocity dispersion suggests that the Circinus galaxy has a spread component within a radius of several 100 pc (Maiolino et al. 1998a). In this paper, with taking such mass distributions into consideration, we also assume an inner bulge component with the mass of and the radius of pc. As for a central supermassive black hole (SMBH), the mass is assessed in terms of the recently inferred black hole-to-bulge mass relation, that is, (Richstone et al. 1998; Marconi & Hunt 2003, and references therein). Here, the SMBH mass is set to be .
We assume the energy spectrum of AGN to be in the form of between 0.01 and 100 keV (Blandford et al. 1990). The bolometric luminosity, , is set to be constant for a period of yr, which is a typical age of AGN (basically Eddington timescale). In the starburst regions, we assume a Salpeter-type stellar initial mass function (IMF) for a mass range of [];
| (1) |
where and is the stellar mass. Although and in starburst regions are under debate, some authors argue that the IMF in a starburst is deficient in low-mass stars, where is derived. The upper limit is inferred to be (Doyon, Puxley, & Joseph 1992; Charlot et al. 1993; Doane & Mathews 1993; Hill et al. 1994; Blandle et al. 1996). We assume these values for and . The star formation rate, , is controlled by , where is the elapsed time after the initial starburst and is the duration of star formation, which is assumed to be yr (e.g. Efstathiou, Rowan-Robinson, & Siebenmorgen 2000). We employ a stellar mass-to-luminosity relation as with , and a stellar mass-to-age relation as with (Lang 1974). All stars are assumed to emit the radiation in the blackbody.
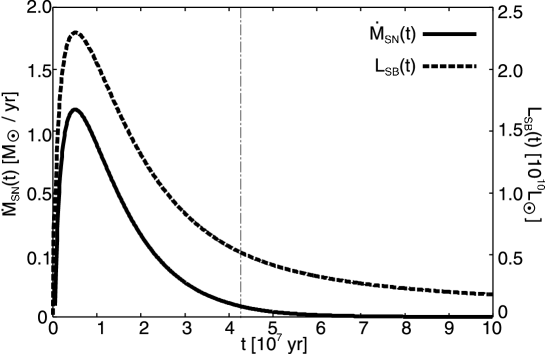
Next, we model the mass ejection from the starburst regions. The mass ejection is driven by multiple supernova (SN) explosions in a starburst. Stars heavier than are destined to undergo Type II SN explosions. The SNe restore almost all the mass into interstellar space and release the energy with a conversion efficiency to the rest mass energy as . Thus, the rate of mass restoration by SNe is assessed by , where is the total mass of SNe that explode by time and is the total supernova luminosity that is temporally averaged. The energy input by multiple SN explosions leads to the formation of an elongated hot cavity (superbubble), and consequently the shock-heated interstellar gas spurts out from the starburst regions (Shapiro & Field 1976; Tomisaka & Ikeuchi 1986; Norman & Ikeuchi 1989). A recent simulation by Wada & Norman (2002) have shown that the shock-heated gas eventually fragments into cold, dense gas clouds owing to the cooling. Hence, we simply suppose that gas clouds spurt from the starburst regions with the mass restoration rate estimated above. (It is noted that a part of preexisting interstellar gas could be also accelerated by the superbubble and therefore participate in the mass ejection from a starburst. Hence, the present mass ejection rate is regarded as a minimum rate.) On the basis of Wada & Norman’s results, we set the initial cloud radius and mass to be pc and as a fiducial model. Then, the hydrogen density in a cloud is . We also examine the effect of a different initial size of clouds by setting pc or pc. The cloud velocity is assumed to be km/s, which is on the order of escape velocity. Figure 1 shows the evolution of mass ejection rate (solid line) and luminosity (dashed line) in the starburst regions. Before yr, the starburst is super-Eddington luminous for gas clouds of initial size. As for the effects of photoionization and photodissociation by the radiation from a starburst as well as an AGN, Ohsuga & Umemura (2001) have analyzed the inner structure of an optically-thick gas slab by solving the force balance and the energy equation. They found that the dust cooling is still effective for a gas slab located at several hundred parsecs from the galactic center, and the resultant gas temperature becomes on the order of 100 K. Hence, we assume the cloud temperature to be 100 K and the optical depths of clouds to be determined by the dust opacity.
The spurted clouds can collide with each other in the space above the galactic disk. Here, we simply assume that an inelastic collision occurs if the distance between cloud centers is less than the sum of cloud radii. Also, it is assumed that the density of clouds does not alter after the collision, so that a cloud of larger size is generated by the collision. Taking into account the resultant change in optical depth of clouds, we calculate the dilution of the radiation from a starburst and an AGN. It should be noted that this assumption on the collision is quite naive. Nagasawa & Miyama (1987) have simulated the head-on collisions of isothermal clouds, using a 3D hydrodynamic code, and have found that the cloud-cloud collisions are very inelastic even for the Mach number of 10, and they result in the coalescence without disruption. However, in our simulation, the Mach number can be up to several 10 or 100. Also, the off-center collisions can frequently occur. In this case, the cloud-cloud collision may result in not only the coalescence but also the disruption of clouds or the induction of star formation. These effects seem worth incorporating in the future simulations.
The self-gravity of clouds is of the external gravity in the model galaxy. Hence, the self-gravity of clouds can be neglected. But, the growth of clouds induced by collisions can lead to the gravitational instability, if the cloud radii exceed the Jeans scale, which is 10.8 pc for the assumed cloud temperature of 100 K. In the present simulation, we treat a cloud above the Jeans scale as a collapsing cloud which contributes no more to the obscuration.
3 BASIC EQUATIONS
The equation of motion is given by
| (2) |
where is the position vector of a cloud from the galactic center, and , , and are the gravitational forces from the starburst ring, the central SMBH, and the bulges, respectively. The radiation pressure force from the starburst, , is given by
| (3) |
where is the mass extinction coefficient, which is averaged over the spectrum of the starburst; , where is the mass extinction coefficient and is the spectrum. Since the mass density is dominated by gas with little contribution of dust and the Thomson scattering is negligible in the opacity (Umemura, Fukue, & Mineshige 1997, 1998), is given by , where is the opacity by dust grains per unit volume and is the gas density in a cloud. is the cloud optical depth estimated by , is the luminosity density in the starburst region, and is the position vector of a cloud from a volume element in the starburst region. We suppose the dust-to-gas mass ratio to be , which is three times as high as that observed in the solar neighborhood, because the metallicity in QSOs is found to be several to ten times higher than the solar metallicity (e.g. Hamann & Ferland 1993). Here, we employ a grain size distribution of a power-law as in the range of 0.01-1 , which is found in the interstellar matter (Mathis, Rumpl, & Nordsieck 1977), and the absorption cross section is determined by , where is the grain radius. The density of solid material within a grain is assumed to be 1.0 g (e.g. Spitzer 1978). We find the resultant optical depth of a gas cloud to be .
Similarly to the starburst case, the radiation pressure force from the AGN, , is calculated by
| (4) |
where is the mass extinction coefficient, which is averaged over the spectrum of the AGN, is the optical depth estimated by . Here, we neglect the radiation force from SNe, because the average luminosity of SNe in the assumed IMF is less than 10 of the total stellar luminosity of starbursts.
4 NUMERICAL RESULTS
Here, we show the numerical results for a starburst-dominant case and an AGN-dominant case. In each case, the time variations of the spatial distributions of gas clouds are presented, and the obscuration of AGN by the clouds is analyzed.
4.1 Starburst-Dominant Case
We consider a case with . Then the AGN luminosity is lower than the starburst luminosity until yr. To show the cloud distributions, we use the coordinates depicted in Figure 2. The resultant cloud distributions projected onto the and the plane are shown in the left panels in Figure 3. The colors of points stand for the cloud radii, where blue points are 3.5 pc, which corresponds to the clouds missing collisions, and red ones are the maximum radius of 10.8 pc, which is the Jeans radius. Using the resultant cloud distributions, we calculate the optical depth, , toward the direction with and . Taking the impact parameter into account, is given by
| (5) |
where denotes each gas cloud, is the impact parameter (the distance from the cloud center to the line-of-sight), is the optical depth of the cloud along the diameter, and is the cloud radius. If , the clouds contribute to the optical depth. The right panels in Figure 3 show for the each direction , using the Mollweide’s projection for the all-sky plot. The colors represent the levels of , ranging from 0 (white) to 50 (red).
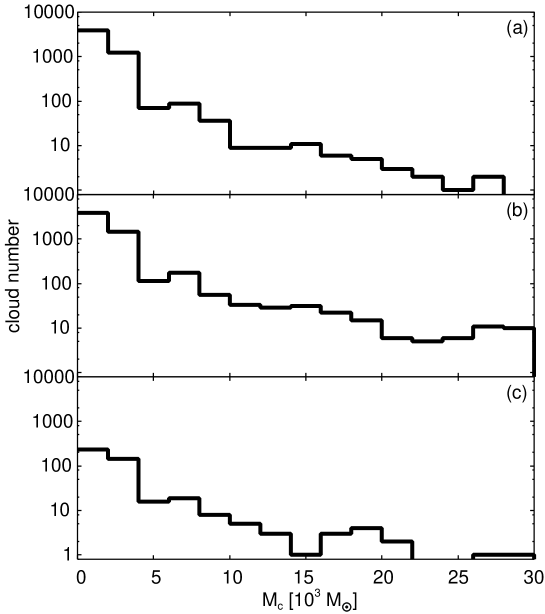
As shown in Figure 3, gas clouds are distributed extensively above the starburst ring at the stage of yr. The radiation pressure from the starburst works to accelerate clouds, because the starburst is super-Eddington luminous until yr for gas clouds of initial size. But, clouds are not distributed around the polar regions. This is because clouds are ejected from the rotating starburst ring and thus possess angular momenta. At this stage, the formation of larger clouds by cloud-cloud collisions is not promoted to a great extent. At yr, clouds with large optical depths increase by repetitive cloud-cloud collisions and they fall back due to the reduced radiation pressure per unit mass. The larger clouds undergo runaway growth and are eventually distributed around the equatorial plane on the inner sides of circumnuclear starburst regions. These clouds have an optical depth of several tens. The angular momentum transfer by cloud collisions near the equatorial plane is not so efficient to allow the effective mass accretion on to the AGN. Therefore, the large clouds stay there and can contribute to the obscuration of the AGN. At yr, the starburst luminosity becomes sub-Eddington for all clouds, and therefore gas clouds fall back one after another. In this stage, a lot of clouds exceed the Jeans size, and thus the number of obscuring clouds decreases rapidly. In Figure 4, the transition of the mass spectrum of the clouds is shown. This figure demonstrates the collision-induced growth of clouds and the decrease of obscuring clouds by the Jeans instability.
Next, we evaluate the covering factor of obscuring clouds. Figure 5 shows the time variations of the covering factor, which is defined by the fraction in the all sky of the area with the optical depth () larger than an optical depth given in the abscissa. If we see the covering factor of , it changes from 13 at yr to a maximum of at yr. This result shows that the starburst-origin dusty clouds can contribute to the obscuration of AGN to a notable extent. After that, the covering factor lessens due to the fall back of clouds.
To see the effect by a different choice of the initial size of gas clouds, we also calculate the models with the initial cloud radius of or 4.5 pc without changing the cloud mass. In Figure 6, we show the resultant covering factor against the optical depth. If the spatial distribution is the same, the shrink of clouds would result in the reduction of covering factor due to the smaller geometrical cross section of clouds. The reduction of covering factor would be a factor of , if pc is assumed. But, as seen in Figure 6, the actual reduction of peak covering factor is . This can be understood by the effect of radiation pressure. If the initial cloud size is smaller, the optical depth of a cloud becomes larger. Hence, the radiation pressure on a cloud is weakened, so that clouds are distributed in more compact space. This effect tends to enlarge the covering factor. On the other hand, for the case of pc, the peak covering factor increases by just a small factor of , although the geometrical cross section would lead to the increase of covering factor by . There is again the radiation pressure effect. Expanded clouds can be distributed more sparsely by less diluted radiation pressure, so that the covering factor is reduced. In addition, larger clouds more frequently collide with each other. This effect also reduces the covering factor. As a result, it turns out that the peak covering factor is not so sensitive to the initial size of clouds.
4.2 AGN-Dominant Case
Here, we show the results in an AGN-dominant case, where is assumed. In this case, the AGN luminosity is higher than the starburst luminosity all the time. Figures 7 and 8 show the results by the same quantities as Figures 3 and 5, respectively. The assumed AGN luminosity is close to the Eddington luminosity for the total mass of the galaxy. Hence, gas clouds are vigorously accelerated. Even at the early stage of yr, clouds are already distributed over kpc, as shown in Figure 7. Very few collisions occur, because the radiation pressure from the AGN drives a spreading outflow of clouds. At yr, a large fraction of clouds escape from the galaxy, so that most of gas clouds cannot contribute to the obscuration of AGN. At yr, a small number of collision-induced large clouds are left.
Due to the cloud motion driven by the AGN luminosity, the covering factor of obscuring clouds cannot reach a higher level. The maximum covering factor is at yr, as shown in Figure 8. Hence, the AGN is likely to be observed as a type 1 with high probability. Such an AGN-dominant case may correspond to quasar events. The relation between AGN type and luminosity is discussed below in the context of the obscuration.
5 DISCUSSION
5.1 Origin of Obscuration
In the previous section, it is shown that the covering factor by starburst-origin dusty clouds increases in a luminous phase of the circumnuclear starburst. This can provide a qualitative explanation for the fact that Seyfert 2 galaxies are more frequently associated with starbursts than Seyfert 1s. On the other hand, obscuring clouds are not distributed around polar regions, as shown in Figure 3. Thus, in the face-on view, the AGN is likely to be identified as a type 1 even in a luminous phase of starburst, if there is no obscuring materials other than starburst-origin dusty clouds. In that sense, Seyfert 1s may be coupled with starburst events. Interestingly, hidden starbursts have been found in Seyfert 1 galaxies (Imanishi & Dudley 2000; Rodriguez-Ardila & Viegas 2003), and also there is an example of Seyfert 1 galaxies accompanied by circumnuclear starbursts, that is, NGC 7469 (Genzel et al. 1995). In the present simulation, if we see the starburst ring at face-on view, starburst-origin dusty clouds obscure 30% of the starburst ring at maximum. This covering factor is not sufficient to produce perfectly hidden starbursts. However, further effects can change the covering factor. In the present simulation, we have ignored collapsing clouds above the Jeans scale. But, the collapsing clouds are likely to result in the star formation. Hence, the re-ejection of matter by supernovae in the collapsed object may also contribute to the obscuring. Furthermore, in the light of the tight correlation between SMBHs and galactic bulges (Richstone et al. 1998; Marconi & Hunt 2003; Kawakatu & Umemura 2004), a starburst in a bulge may contribute to the obscuration of nuclear regions (e.g. Umemura 2001; Kawakatu, Umemura, & Mori 2003).
As for the ratio of Seyfert 2s to 1s, Maiolino & Rieke (1995) concluded that Seyfert 2s appear to be four times more numerous than Seyfert 1s. This implies that the total covering factor of obscuring materials is likely to be of order 80%. In the present simulation, the maximum covering factor is around 20%. A hydrodynamic simulation by Wada & Norman (2002) also shows the covering factor to be 40% at an early phase (1.6Myr) of starburst. Hence, it seems that additional obscuring materials are required to account for the number ratio between Seyfert 1s and 2s. Recently, we have some significant pieces of observational information about the obscuring materials. The of the nuclear or circumnuclear regions is estimated to be between a few and several magnitudes by IR and optical observations (Rix et al. 1990; Roche et al. 1991; Goodrich, Veilleux, & Hill 1994; McLeod & Rieke 1995; Oliva, Marconi, & Moorwood 1999). On the other hand, X-ray observations have shown that most Seyfert 2 nuclei are heavily obscured along the line of sight with at least mag and sometimes mag (Matt et al. 1996, 1999; Maiolino et al. 1998b; Bassani et al. 1999; Risaliti, Maiolino, & Salvati 1999). Also, it is argued that a component of obscuring materials must be extended up to pc in addition to a compact component confined to subparsec scales (Rudy, Cohen, & Ake 1988; Miller, Goodrich, & Mathews 1991; Goodrich 1995; McLeod & Rieke 1995; Maiolino et al. 1995; Maiolino & Rieke 1995; Malkan et al. 1998). These findings suggest that the distributions of dusty gas around an AGN are much more diverse than previously considered. The dusty clouds ejected from starbursts may be the origin of the extended obscuring matter. In addition, inner obscuring materials (possibly a dusty torus) may cooperatively work to obscure the nucleus. The combination of outer and inner obscuring materials will be an important issue to be scrutinized.
For the case that the AGN luminosity is predominant, dusty clouds are blown out from a galaxy by the AGN radiation pressure, and therefore cannot contribute much to the obscuration. This result matches the fact that quasars are mostly observed as type 1 AGNs, regardless of the star formation activity in host galaxies (Barvainis, Antonucci, & Coleman 1992; Ohta et al. 1996; Omont et al. 1996; Schinnerer, Eckart, & Tacconi 1998; Brotherton et al. 1999; Canalizo & Stockton 2000a, 2000b; Dietrich & Wilhelm-Erkens 2000; Solomon et al. 2004). Also, based on the hard X-ray luminosity function of AGNs, Ueda et al. (2003) have found that the fraction of X-ray absorbed AGNs decreases with the AGN luminosity. This trend is also consistent with the present picture of the radiation pressure-induced outflow.
5.2 Relation to Narrow Line Regions
It may be intriguing to consider the possible relation between dusty clouds and narrow line regions (NLRs) in AGNs, because the velocity dispersion of starburst-origin clouds, a few 100 km s-1, is just on the order of that found in NLRs.
One of common properties of NLRs is a fairly constant ionization parameter, i.e., , where is the ionizing photon flux and is the density at irradiated cloud surfaces. Recently, Dopita et al. (2002) argued that the ionization parameter of NLRs is successfully accounted for by radiation pressure-dominated dusty photoablating clouds. This picture seems quite consistent with the present model. In addition, it is reported that Seyfert 1 galaxies have a smaller number of narrow-line clouds than Seyfert 2s (Schmitt 1998), and also the extension of NLRs in AGNs is roughly proportional to the square root of the [O III] luminosity (Bennert et al. 2002). These trends are qualitatively compatible with the present results that the number of dusty clouds decreases with a dimming starburst, and the spatial extent of dusty clouds augments with increasing AGN luminosity.
6 CONCLUSIONS
We have investigated the dynamics of gas clouds that spurt out from circumnuclear starburst regions, including radiation forces from a starburst as well as an AGN. The results are summarized as follows:
(1) In a case where the starburst luminosity is higher than the AGN luminosity, gas clouds are distributed at several hundred pc above the galactic disk, due to the radiation pressure from the starburst. The covering factor of these clouds reaches around 20% at the maximum. According as the starburst dims, gas clouds with large optical depth are formed by cloud-cloud collisions and fall back due to the reduced radiation pressure by starburst. The larger gas clouds which have optical depth of several tens are eventually distributed near to the equatorial plane. This starburst-dominant case is qualitatively consistent with the fact that Seyfert 2 galaxies appear to be more frequently associated with starbursts than Seyfert 1s.
(2) In a case where the AGN luminosity is dominant and super-Eddington, most gas clouds are blown out by the radiation pressure from the AGN. Resultantly, starburst-origin gas clouds can hardly contribute to the obscuration of the AGN. Hence, the AGN is likely to be observed as type 1 with high probability. This AGN-dominant case corresponds to a quasar-like object. Furthermore, it is predicted that the fraction of obscured AGNs decreases with increasing AGN luminosity. This prediction matches the fraction of X-ray absorbed AGNs found by Ueda et al. (2003).
(3) The velocity dispersion of gas clouds is several 100 km/s, which is just comparable to that found in NLRs. The observations for the ionization parameter of NLRs and the extension of NLRs depending on AGN luminosity are consistent with the present picture.
In the present analysis, we have found that starburst-origin gas clouds can contribute to the obscuration especially in large scales. Also, it has turned out that there is still something missing to account for all the properties of the AGN obscuration. It may be significant to consider further effects such as the combination of inner and outer obscuring materials.
ACKNOWLEDGMENTS
We are grateful to N. Kawakatsu and K. Ohsuga for helpful discussion. We also thank the anonymous referee for valuable comments. This work was carried out with computational facilities at the Center for Computational Science, University of Tsukuba. MU acknowledges Grants-in-Aid for Scientific Research from MEXT, 16002003.
References
- (1) Antonucci, R. 1993, ARA&A, 31, 473
- (2) Barth, A. J., Ho, L. C., Filippenko, A. V., & Sargent, W. L. W. 1995, AJ, 110, 1009
- (3) Barvainis, R., Antonucci, R., & Coleman, Paul. 1992, ApJ, 399, L19
- (4) Bassani, L., Dadina, M., Maiolino, R., Salvati, M., Risaliti, G., della Ceca, R., Matt, G., & Zamorani, G. 1999, ApJS, 121, 473
- (5) Bennert, N., Falcke, H., Schulz, H., Wilson, A. S., Wills, B. J. 2002, ApJ, 574, L105
- (6) Blandford, R. D., Netzer, H., Woltjer, L., Courvoisier, T., & Mayor, M. 1990, Active Galactic Nuclei (Berlin:Springer)
- (7) Blandle, B., Sams, B. J., Bertoldi, F., Eckart, A., Genzel, R., Drapatz, S., Hofmann, R., Loewe, M., & Quirrenbach, A. 1996, ApJ, 466, 254
- (8) Brotherton, M. S., et al. 1999, ApJ, 520, L87
- (9) Buta, R., Purcell, G. B., & Crocker, D. A. 1995, AJ, 110, 1588
- (10) Canalizo, G., & Stockton, A. 2000a, ApJ, 528, 201
- (11) Canalizo, G., & Stockton, A. 2000b, AJ, 120, 1750
- (12) Charlot, S., Ferrari, F., Mathews, G. J., & Silk, J. 1993, ApJ, 419, L57
- (13) Dietrich, M., & Wilhelm-Erkens, U. 2000, A&A, 354, 17
- (14) Doane, J. S. & Mathews,W. G. 1993, ApJ, 419, 573
- (15) Dopita, M. A., Groves, B. A., Sutherland, R. S., Binette, L., Cecil, G. 2002, ApJ, 572, 753
- (16) Doyon, R., Puxley, P. J., & Joseph, R. D. 1992, ApJ, 397, 117
- (17) Efstahiou, A., Rowan-Robinson, M., & Siebenmorgen, R. 2000, MNRAS, 313, 734
- (18) Elmouttie, M. Koribalski, B. Gordon, S. Taylor, K. Houghton, S. Lavezzi, T. Haynes, R. & Jones, K. 1998a, MNRAS, 297, 49
- (19) Forbes, D. A., Norris, R. P., Williger, G. M., & Smith, R. C. 1994, AJ, 107, 984
- (20) Genzel, R., Weitzel, L., Tacconi-Garman, L. E., Blietz, M. Cameron, M., Krabbe, A., Lutz, D., & Sternberg, A. 1995, ApJ, 444, 129
- (21) Gonzalez Delgado, R. M., Heckman, T., & Leitherer, C. 2001, ApJ, 546, 845
- (22) Goodrich, R. W. 1995, ApJ, 440, 141
- (23) Goodrich, R. W., Veilleux, S., & Hill, G. J. 1994, ApJ, 422, 521
- (24) Hamann, F., & Ferland, G. 1993, ApJ, 418, 11
- (25) Heckman, T. M., Blitz, L., Wilson, A. S., & Armus, L. 1989, ApJ, 342, 735
- (26) Hill, J. K., Isensee, J. E., Cornett, R. H., Bohlin, R. C., O’Connell, R. W., Roberts, M. S., Smith, A. M., & Stecher, T. P. 1994, ApJ, 425, 122
- (27) Hunt, L. K., Malkan, M. A., Salvati, M., Mandolesi, N., Palazzi, E., & Wada, R. 1997, ApJS, 108, 229
- (28) Imanishi, M. & Dudley, C. C. 2000, ApJ, 545, 701
- (29) Kawakatu, N., & Umemura, M. 2004, ApJ, 601, L21
- (30) Kawakatu, N., Umemura, M., & Mori, M. 2003, ApJ, 583, 85
- (31) Lang, K. R. 1974, Astrophysical Data: Planets and Stars. (Springer-Verlag, Berlin)
- (32) Leitherer, C., Vacca, W. D., Conti, P. S., Filippenko, A. V., Robert, C., & Sargent, W. L. W. 1996, ApJ, 465, 717
- (33) Maiolino, R., Krabbe, A., Thatte, N., & Genzel, R., 1998a, ApJ, 493, 650
- (34) Maiolino, R., Ruiz, M., Rieke, G. H., & Keller, L. D. 1995, ApJ, 446, 561
- (35) Maiolino, R., Ruiz, M., Rieke, G. H., & Papadopoulos, P. 1997, ApJ, 485, 552
- (36) Maiolino, R., & Rieke, G. H. 1995, ApJ, 454, 95
- (37) Maiolino, R., Salvati, M., Bassani, L., Dadina, M., della Ceca, R., Matt, G., Risaliti, G., & Zamorani, G. 1998b, A&A, 338, 781
- (38) Malkan, M. A., Gorjian, V., & Tam, R. 1998, ApJS, 117, 25
- (39) Maoz, D., Barth, A. J., Sternberg, A., Filippenko, A. V., Ho, L. C., Macchetto, F. D., Rix, H. W., & Schneider, D. P. 1996, AJ, 111, 2248
- (40) Marconi, A. & Hunt, L. K., 2003, ApJ, 589, L21
- (41) Marconi, A. Moorwood, A. F. M., Origlia, L., & Oliva, E. 1994, Messenger, 78, 20
- (42) Mathis, J. S., Rumpl, W., & Nordsieck, K. H. 1977, ApJ, 217, 425
- (43) Matt, G., Fiore, F., Perola, G. C., Piro, L., Fink, H. H., Grandi, P., Matsuoka, M., Oliva, E., & Salvati, M. 1996, MNRAS, 281, L69
- (44) Matt, G., Guainazzi, M., Maiolino, R., Molendi, S., Perola, G. C., Antonelli, L. A., Bassani, L., Brandt, W. N., Fabian, A. C., Fiore, F., Iwasawa, K., Malaguti, G., Marconi, A., & Poutanen, J. 1999, A&A, 341, L39
- (45) Mauder, W., Weight, G., Appenzeller, I., & Wagner, S. J. 1994, A&A, 285, 44
- (46) McLeod, K. K., & Rieke, G. H. 1995, ApJ, 441, 96
- (47) Miller, J. S., Goodrich, R. W., & Mathews, W. G. 1991, ApJ, 378, 47
- (48) Nagasawa, M. & Miyama, S. M. 1987, Progress of Theoretical Physics, 78, 1250
- (49) Norman, C. A., & Ikeuchi, S. 1989, ApJ, 345, 372
- (50) Ohsuga, K., & Umemura, M. 1999, ApJ, 521, L13
- (51) Ohsuga, K., & Umemura, M. 2001, ApJ, 559, 157
- (52) Ohta, K., Yamada, T., Nakanishi, K., Kohno, K., Akiyama, M., & Kawabe, R. 1996, Nature, 382, 426
- (53) Oliva, E., Marconi, A., & Moorwood, A. F. M. 1999, A&A, 342, 87
- (54) Omont, A., Petitjean, P., Guilloteau, S., McMahon, R. G., Solomon,P. M., & Pecontal, E. 1996, Nature, 382, 428
- (55) Perez-Olea, D. E., & Colina, L. 1996, ApJ, 468, 191
- (56) Pogge, R. W., 1989, ApJ, 345, 730
- (57) Richstone D. et al., 1998, Nature, 395A, 14
- (58) Risaliti, G., Maiolino, R., & Salvati, M. 1999, ApJ, 522, 157
- (59) Rix, H.-W., Rieke, G., Rieke, M., & Carleton, N. P. 1990, ApJ, 363, 480
- (60) Roche, P. F., Aitken, D. K., Smith, C. H., & Ward, M. J. 1991, MNRAS, 248, 606
- (61) Rodriguez-Ardila, A., & Viegas, S. M. 2003, MNRAS, 340, L33
- (62) Rudy, R. J., Cohen, R. D., & Ake, T. B. 1988, ApJ, 332, 172
- (63) Schinnerer, E., Eckart, A., & Tacconi, L. J. 1998, ApJ, 500, 147
- (64) Schmitt, H. R. 1998, ApJ, 506, 647
- (65) Schmitt, H. R., Storchi-Bergmann, T., & Fernandes, R. C. 1999, MNRAS, 303, 173
- (66) Shapiro, P. S., & Field, G. B. 1976, ApJ, 205, 762
- (67) Solomon, P., Vanden Bout P., Carille C., & Guelin, M. 2004, Nature, 426, 636
- (68) Spizer, L., Jr, 1978, Physical Processes in the Interstellar Medium. John Wiley & Sons
- (69) Storchi-Bergmann, T., Raimann, D., Bica, E. L. D., & Fraquelli, H. A. 2000, ApJ, 544, 747
- (70) Storchi-Bergmann, T., Wilson, A. S., & Baldwin, J. A. 1996, ApJ, 460, 252
- (71) Tomisaka, K., & Ikeuchi, S. 1986, PASJ, 38, 697
- (72) Ueda, Y., Akiyama, M., Ohta, K., & Miyaji, T. 2003, ApJ, 598, 886
- (73) Umemura, M. 2001, ApJL, 560, L29
- (74) Umemura, M., Fukue, J., & Mineshige, S. 1997, ApJ, 479, L97
- (75) Umemura, M., Fukue, J., & Mineshige, S. 1998, MNRAS, 299, 1123
- (76) Wada, K., & Norman, C. A. 2002, ApJ, 547, 172
- (77) Wilson A. S., Helfer, T. T. Haniff, C. A., & Ward, M. J. 1991, ApJ, 381, 79
http://www.rccp.tsukuba.ac.jp/Astro/watabe/


http://www.rccp.tsukuba.ac.jp/Astro/watabe/
