An Upper Bound on the Flux Ratio of CrB’s Companion at 1.6
Abstract
We use high resolution infrared spectroscopy to investigate the 2001 report by Gatewood and colleagues that CrB’s candidate extrasolar planet companion is really a low-mass star with mass . We do not detect evidence of such a companion; the upper bounds on the (companion/primary) flux ratio at 1.6 are less than 0.0024 and 0.005 at the 90 and 99% confidence levels, respectively. Using the -band mass-luminosity relationship calculated by Baraffe and colleagues, the corresponding upper limits on the companion mass are 0.11 and 0.15. Our results indicate that the infrared spectroscopic technique can detect companions in binaries with flux ratios as low as 0.01 to 0.02.
1 Introduction
Coronae Borealis ( CrB, HIP 78459), a well-studied G0V star with an estimated mass of 1.0 and an age of 10 Gyr, was among the first stars identified with an extrasolar planet (ESP) candidate (Noyes et al., 1997, hereafter N97). If the mass of the companion, , is small relative to CrB, the system’s mass function indicates that , where is the orbital inclination. For a random distribution of orbital plane inclinations, the expectation value of is , justifying the interpretation that CrB’s companion is an ESP.
Subsequently, Gatewood, Han, & Black (2001, hereafter GHB) used data from Hipparcos and the ground-based Multichannel Astrometric Photometer (Gatewood, 1987) to measure the astrometric signature of the reflex motion of CrB. They derived an astrometric orbit with a semi-major axis of mas and an inclination of , indicating that the companion is a late type M-dwarf star with mass . In a large sample of ESP candidates, only a few systems seen at low inclinations are expected. It was therefore surprising that, in a companion paper, Han, Black, & Gatewood (2001, hereafter HBG) found, by combining Hipparcos data with the spectroscopic orbital elements of 30 ESP candidates, that a significant fraction may have small inclinations. The semi-major axes of the orbits that HBG derived are, however, at the limits of the precision of Hipparcos measurements. Pourbaix & Arenou (2001) and Zucker & Mazeh (2001) demonstrated that in these circumstances the small ’s were an artifact of HBG’s analysis. Indeed, McGrath et al.’s (2002) HST astrometric observation of Cnc (55 Cnc), a star estimated by HBG to have a particularly low inclination orbit, placed an upper limit on its reflex motion, confirming that its companion is sub-stellar.
We have been using high-resolution infrared (IR) spectroscopy to detect low-mass companions in spectroscopic binaries first identified in visible light (Mazeh et al. 2002, hereafter M02; Prato et al. 2002, hereafter P02). If CrB’s companion had the mass of a late M spectral type main-sequence star, we expected it to lie within the sensitivity limits of the technique (e.g. Mazeh et al., 2003). We describe here our search for the companion in the CrB system by IR spectroscopy. §2 details extension of the IR technique to CrB, our observations, and data reduction. In §3 we describe our analysis and the measurements of CrB. In §4 we set an upper bound on the 1.6 flux of CrB’s companion. We calculate an upper limit on the companion mass using theoretical models and comment on the significance of our result in §5.
2 Observations and Data Reduction
We observed CrB during four runs in the spring of 2001 (see Table 1) with the W. M. Keck Observatory’s cross-dispersed echelle IR spectrometer NIRSPEC (McLean et al., 1998, 2000) on the Keck II telescope with and without adaptive optics (AO). We used NIRSPEC in its high resolution mode centered at 1.555. This provided 9 spectral orders, 45 – 53, from 1.450 – 1.705 with resolutions of 28,000 and 35,000 in non-AO and AO modes respectively, for a 2 pixel slit width. Further details of the instrument setup and observation procedure are given in P02. We extracted the spectra using the REDSPEC111http://www2.keck.hawaii.edu/inst/nirspec/redspec/index.html. software package, and determined the dispersion solution using OH emission lines of the night sky, recorded simultaneously with the observations and identified from the catalog of Rousselot et al. (2000), and arc lamp spectra.
Application of the IR spectroscopic technique to the detection of low mass secondaries requires good templates for the primary and the secondary. Observations of these templates took place during 2000 and 2001 (P02). Prior to this work (e.g., P02, M02), we used spectra in only NIRSPEC order 49 because it is nearly completely free of terrestrial absorption. However, the sensitivity of our analysis depends on the number of stellar spectral lines available and hence on the spectral range of the data. To reach the low flux levels expected for CrB’s companion we used additional spectral orders. Figure 1 shows the spectrum of the A0 star HD 13372 in orders 45 – 53. The stellar spectrum contains only weak, broad lines of the hydrogen Brackett series; all other absorption shown in the figure is terrestrial. The absence of terrestrial absorption in order 49 is apparent. Order 46 contains terrestrial absorption in the P and Q branches of a band; orders 47 and 48 contain absorption lines. Orders 51 – 53, and to a lesser extent order 50, are contaminated by many terrestrial absorption lines. In order 45, with our choice of central wavelength, starlight illuminated the array in only one of the two telescope nod positions. We concentrated, therefore, on trying to correct atmospheric absorption only in the spectra of orders 46, 47, and 48.
Terrestrial absorption lines are usually removed by dividing the target spectrum by a featureless stellar spectrum observed nearly simultaneously at the same airmass. We took a different approach because we had to correct many template spectra obtained in different observing sessions. We expect that the and absorption bands are independent of weather and vary only with airmass. We therefore obtained NIRSPEC spectra of five A0 stars on July 17, 2002, over the range of airmasses of our CrB and template spectra. We removed the Brackett lines by fitting them with Lorentzian profiles and used the terrestrial absorption lines in orders 46, 47, and 48 to register each observation on a sub-pixel scale. For each of the terrestrial lines, we fitted the dependence of the absorption on airmass, and were thus able to calculate terrestrial absorption spectra at the exact airmasses of the CrB and template spectra. This procedure worked well for order 47 and less well in orders 46 and 48, probably because their telluric lines are deeper and have more complex structure than those in order 47. The residuals in orders 46 and 48 appear in only a few percent or less of free spectral range of these orders so we considered them negligible. Figure 2 shows the order 46 – 49 CrB spectra measured on June 2, 2001, with orders 46, 47, and 48 corrected for telluric absorption.
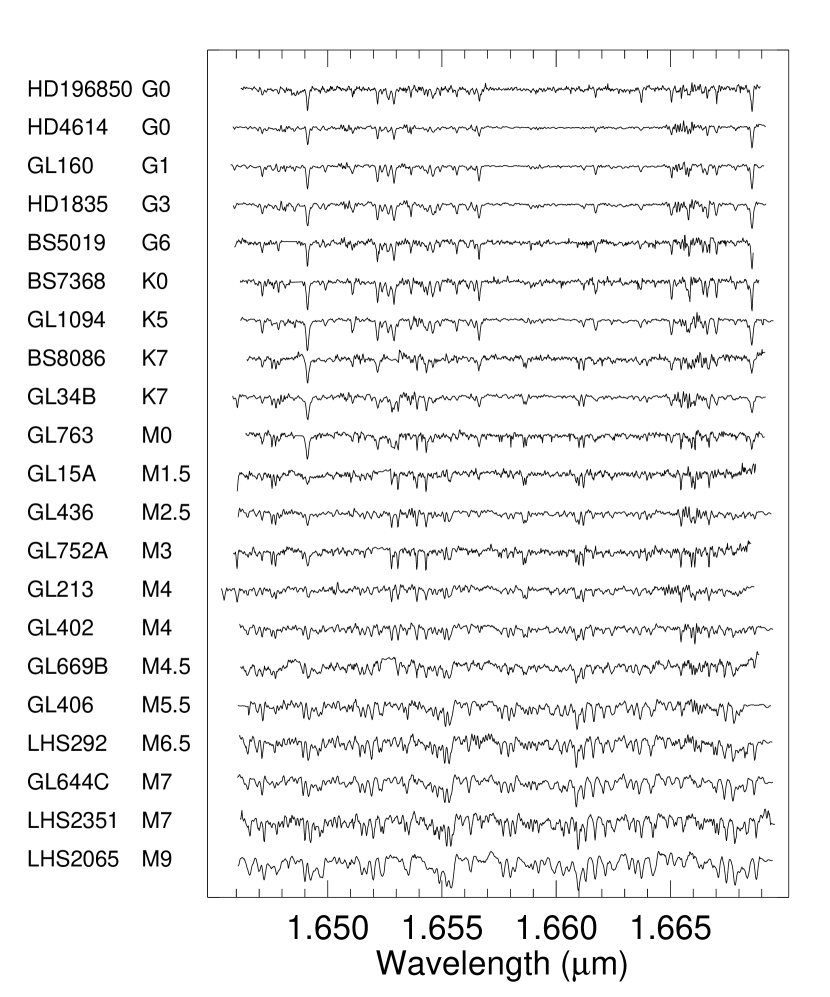
To ensure consistent results, we reextracted orders 46 – 49 for the entire template set, calculated the dispersion solution using the OH lines of the night sky, corrected the spectra for terrestrial absorption, and rederived the stellar radial velocities following the technique described in P02. Figures 3 – 6 show the template spectra for orders 46 – 49 in the laboratory reference frame, with the terrestrial absorption lines removed from orders 46, 47, and 48.
3 The Companion/Primary Flux Ratio of CrB
Our procedure to search for evidence of CrB’s companion is similar to that described by M02 for spectroscopic binaries using the two-dimensional cross-correlation routine TODCOR (Zucker & Mazeh, 1994). The analysis identifies the templates that provide the best matching primary and secondary, the ratio of the secondary and primary fluxes, , and the radial velocities of the components. The measured amplitude of CrB’s reflex velocity is 67 (N97). If its companion had the 0.14 mass reported by GHB, the maximum velocity difference of the primary and secondary would be 0.4. This is less than the 1 velocity precision of our technique (P02), so we did not expect to detect a velocity difference. To obtain a velocity difference large enough for us to detect reliably, , would require that the companion have mass ; the flux of such a substellar object blended with a G star would be too small for us to detect spectroscopically. We therefore regarded the velocity difference of the components as fixed at 0 and focused on measuring the system’s flux ratio.
We wrote a routine to model binaries from pairs of templates at prescribed flux ratios, to cross-correlate them with our CrB spectra, and to identify the model most closely matching CrB. With this, we analyzed separately the CrB spectra in orders 46 – 49 for each of the four observing sessions using a wide selection of templates. The highest correlation values resulted from using HD 4614 or GL 160 for the primary template, depending on the particular CrB spectrum, and the late M-type templates for the secondary. Changing the secondary spectral type by a few subclasses resulted in negligible changes in the correlation, and we concluded that we could only discriminate between early and late type M-star secondaries. Based on this, we averaged the ’s resulting from the late type secondaries GL 406, LHS 292, GL 644C, LHS 2351, and LHS 2065 for each CrB spectrum. These averaged values are our measured flux ratios and are listed in Table 2. The arithmetic mean of the measured flux ratios in Table 2 is 0.0034. This small value, and the large scatter around it, from 0.0260 to 0.0164, suggest that the observations have not detected the companion. The primary and secondary templates are not likely to match exactly the effective temperature and metallicity of the CrB primary and companion. The fact that the average flux ratio is essentially zero indicates that any such mismatch is not causing a systematic error.
To interpret the apparent non-detection we must derive an upper bound, at a specified level of significance, on the flux ratio. The conventional approach would be to calculate the mean of the measured flux ratios in Table 2, to assume they follow a Gaussian distribution and derive the standard deviation of the mean, and to use this to place confidence limits on an upper bound. The measured flux ratios, however, do not necessarily follow a Gaussian distribution, and the number of measurements, 16, is too few to test the assumption reliably. We chose, therefore, to take a different approach, using the data itself to model a large number of observations, and from these directly measure the probabilities of a detection at a certain flux ratio, independent of underlying statistical assumptions. §4 describes this approach.
4 Estimate of the Flux Ratio Upper Bound
4.1 Model Binaries
In this section, we estimate the upper bound on the ratio of the companion’s flux to that of CrB that follows from the measurements in Table 2. Our approach starts by analyzing sets of model binaries. To ensure the models closely represented the original observations, we used the observed CrB spectra as the basis for the model primaries. We subdivided each observed CrB spectrum at wavelengths where there are no lines, into smaller sections with lengths from 10 to 60 Å. We reassembled these sections in random sequences to create a set of 500 unique model primaries for each observation, with absorption lines, noise characteristics, and free spectral range identical to the original CrB spectrum. Figure 7 shows examples of reassembled model primaries derived from the January 2001 CrB spectra. We used the M7 spectral type star LHS 2351 for the secondary in all of the models, and combined it, unmodified, with the randomized primaries at eight flux ratio values, from 0.001 – 0.020, to create the model binary spectra. This provided us with 128 sets (4 observations 4 orders 8 flux ratios) of 500 model binaries each, with which to evaluate the measured flux ratios in Table 2.
We analyzed the model binaries in the same way as the original CrB spectra (§3). For each set of models, we cut and reassembled a matching set of primary templates from either HD 4614 or GL 160, depending on which was used in the corresponding CrB analysis. We restricted the analysis to only the M6.5 spectral type star LHS 292 for the secondary template because the correlation value is insensitive to small changes in the secondary spectral type (§3).
The analysis produced 500 “measured” flux ratios for each of the 128 sets of models. For a given set of models, the measured flux ratios scattered around the input value. Figure 8 shows two of these distributions from January 2001, order 49, , along with the corresponding measured value of 0.0046 from Table 2.
4.2 Flux Ratio Upper Bound
From each of our model distributions we can determine the probability that the corresponding CrB observation returns a flux ratio as small as the one measured. Consider, for example, the results for January 2001, order 49. If the actual flux ratio were 0.010, the probability that the observation and its analysis produces a flux ratio as small as the one measured, 0.0046, is given by the number of model binaries that returned flux ratios of equal value or smaller. Figure 8a shows the model distribution derived for this case; 24 out of 500 models (probability=0.048) produced an smaller than 0.0046. If, then, the true were 0.010, the probability of a measurement producing a value as low as or lower than 0.0046 is unlikely, and we could consider 0.010 an upper bound with 95% confidence . Suppose that instead the true were smaller, 0.005. In this case, a larger number of models, now 76 out of 500, or 15%, give an as small as the measured one (Figure 8b). We would therefore consider 0.005 as an upper bound with only 85% confidence.
For each of the 16 modeled observations, we calculated, at the eight input model flux ratios, the probability of measuring a flux ratio as low as or lower than the measured value in Table 2. To combine those probability values into one value, we use Fisher’s method to combine independent -values (Fisher, 1932). In this method, one first calculates the product of probabilities. This value, according to Fisher (1932), is distributed in a known way, and we can use its known distribution to infer the new probability. The product value, , is
| (1) |
Fisher (1932) showed that the statistic has a distribution with degrees of freedom. Following Fisher’s recipe222See also http://www.loujost.com, we use this known distribution to calculate , the combined -value from the 16 probabilities. Figure 9 shows as a function of input flux ratio. The combined probability curve intersects the 99% confidence level at . Similarly, the flux ratio 0.0024 can be ruled out with 90% confidence.
5 Discussion
We consider the flux ratio from 1.55 to 1.65 as equivalent to that in the -band because spectra of late M dwarfs between 1.4 and 1.7 are not marked by the very deep H2O absorption characteristic of L spectral type dwarfs (e.g. Leggett et al., 2001). The 2MASS -band magnitude of CrB is 3.99. This is in excellent agreement with its Hipparcos V magnitude, 5.39 (HIP 78459), and the color, 1.36, for a GOV spectral type star (Tokunaga, 2000). With the Hipparcos distance of pc, CrB’s absolute H-band magnitude is . The flux ratio upper bound (§4.2) therefore corresponds to an -band brightness limit for the companion of at the 99% confidence level and at the 90% confidence level.
Figure 10 shows the absolute H magnitude versus mass, 10 Gyr isochrone calculated by Baraffe et al. (1998) for low mass stars and brown dwarfs, with the model values for masses less than 0.1 updated from Baraffe et al. (2003). At the scale of the figure, the 5 Gyr isochrone is indistinguishable from the one for 10 Gyr. We also plot the locations of main-sequence dwarfs whose masses have been measured dynamically; the references are cited in the figure caption. For reference, the figure shows the (companion/primary) flux ratio upper bounds calculated in §4. The flux ratio upper bound at the 99% confidence level, , falls at , close to GHB’s reported mass of the companion, . Similarly, sets an upper bound on the mass of with 90% confidence. While these mass upper bounds do not provide either a definitive confirmation or rejection of GHB’s reported mass of the companion, they do suggest strongly that its mass is smaller than their value.
The analysis described in §3 and §4, and illustrated by the histograms in Figure 8 shows that, by increasing the spectral range through the use of several orders, the IR spectroscopic technique can detect binaries with 1.6 flux ratios in the range of 0.01 to 0.02. This is a significant advance over our previous detections at flux ratios of 0.04 to 0.05 (Mazeh et al. 2003).
6 Summary
1) Our measurements set upper limits of 0.0024 and 0.005 on the ratio of the flux of CrB’s companion to CrB, at the and confidence levels, respectively.
2) Using Baraffe et al.’s (1998, 2003) calculations of the -band mass-luminosity relation, these flux limits correspond to mass upper bounds of 0.11 and 0.15 at the 90 and 99% confidence limits, respectively.
3) Our analysis of the model binaries tested the sensitivity of our technique when using multiple orders. The results indicate that binaries with 1.6 flux ratios as low as 0.01 to 0.02 are detectable by high spectral resolution IR spectroscopy.
We thank the referee for useful comments that improved the manuscript. MS thanks D. Black for the chance conversation that started this project. We thank the staff of the W.M. Keck Observatory for their thorough support and C. Koehn for help with extraction of the template spectra. The work of CB and MS was supported in part by NSF grant AST 02-05427. TM was supported in part by the Israeli Science Foundation grant 233/03. SZ is grateful for partial support from the Jacob and Riva Damm Foundation. Data presented herein were obtained at the W.M. Keck Observatory which is operated as a scientific partnership between the California Institute of Technology, the University of California, and NASA. The Observatory was made possible by the generous financial support of the W.M. Keck Foundation. We extend our thanks to those of Hawaiian ancestry on whose sacred mountain we are privileged to be guests. This publication makes use of data products from the Two Micron All Sky Survey, which is a joint project of the University of Massachusetts and the Infrared Processing and Analysis Center/California Institute of Technology, funded by the National Aeronautics and Space Administration and the National Science Foundation. This research has also made use of the SIMBAD database, operated at CDS, Strasbourg, France.
References
- Baraffe et al. (1998) Baraffe, I., Chabrier, G., Allard, F., & Hauschildt, P. H. 1998, A&A, 337, 403
- Baraffe et al. (2003) Baraffe, I., Chabrier, G., Barman, T. S., Allard, F., & Hauschildt, P. H. 2003, A&A, 402, 701
- Delfosse et al. (2000) Delfosse, X., Forveille, T., Ségransan, D., Beuzit, J.-L, Udry, S., Perrier, C., & Mayor, M. 2000, A&A, 364, 217
- Fisher (1932) Fisher, R. A., 1932, Statistical Methods for Research Workers, (4th ed.; Edinburgh: Oliver & Boyd)
- Forveille et al. (1999) Forveille, T., Beuzit, J.-L, Delfosse, X., Ségransan, D., Beck, F., Mayor, M., Perrier, C., Tokovinin, A., & Udry, S. 1999, A&A, 351, 619
- Gatewood (1987) Gatewood, G. 1987, AJ, 94, 213
- Gatewood, Han, & Black (2001) Gatewood, G., Han, I., & Black, D. C. 2001, ApJ, 548, L61
- Han, Black, & Gatewood (2001) Han, I., Black, D. C., & Gatewood, G. 2001, ApJ, 548, L57
- Henry et al. (1999) Henry, T. J., Franz, O. G., Wasserman, L. H., Benedict, G. F., Shelus, P. J., Ianna, P. A., Kirkpatrick, J. D., & McCarthy, Jr., D. W. 1999, ApJ, 512, 864
- Henry & McCarthy (1993) Henry, T. J., & McCarthy, Jr., D. W. 1993, AJ, 106, 773
- Leggett (1992) Leggett, S. K. 1992, ApJS, 82, 351
- Leggett et al. (2001) Leggett, S. K., Allard, F., Geballe, T. R., Hauschildt, P. H., & Schweitzer, A. 2001, AJ, 548, 908
- Leggett et al. (2002) Leggett, S. K., et al. 2002, ApJ, 564, 452
- Martin et al. (1998) Martin, C., Mignard, F., Hartkopf, W. I.,& McAlister, H. A. 1998, A&AS, 133, 149
- Mazeh et al. (2002) Mazeh, T., Prato, L., Simon, M., Goldberg, E., Norman, D., & Zucker, S. 2002, ApJ, 564, 1007
- Mazeh et al. (2003) Mazeh, T., Simon, M., Prato, L., Markus, B., & Zucker, S. 2003, ApJ, 599, 1344
- McGrath et al.’s (2002) McGrath, M. A., Nelan, E., Black, D. C., Gatewood, G., Noll, K., Schultz, A., Lubow, S., Han, I., Stepinski, T. F., Targett, T. 2002, ApJ, 564, L27
- McLean et al. (2000) McLean, I. S., Graham, J. R., Becklin, E. E., Figer, D. F., Larkin, J. E., Levenson, N. A., & Teplitz, H. I. 2000, Proc. SPIE, 4008, 1048
- McLean et al. (1998) McLean, I. S., et al. 1998, Proc. SPIE, 3354, 566.
- Noyes et al. (1997) Noyes, R. W., Jha, S., Korzennik, S. G., Krockenberger, M., Nisenson, P., Brown, T. M., Kennelly, E. J., & Horner, S. D. 1997, ApJ, 483, L111
- Pourbaix & Arenou (2001) Pourbaix, D., & Arenou, F. 2001, A&A, 372, 935
- Prato et al. (2002) Prato, L., Simon, M., Mazeh, T., McLean, I.S., Norman, D., & Zucker, S. 2002, ApJ, 569, 863
- Rousselot et al. (2000) Rousselot, P., Lidman, C., Cuby, J.-G., Moreels, G., & Monnet, G. 2000, A&A, 354, 1134
- Ségransan et al. (2000) Ségransan, D., Delfosse, X., Forveille, T., Beuzit, J.-L, Udry, S., Perrier, C., & Mayor, M. 2000, A&A, 364, 665
- Tokunaga (2000) Tokunaga, A.T. 2000, in Allen’s Astrophysical Quantities, ed. A.N. Cox, (New York: Springer-Verlag), Ch. 7
- Torres et al. (1999) Torres, G., Henry, T. J., Franz, O. G., Wasserman, L. H. 1999, AJ, 117, 562
- Zucker & Mazeh (1994) Zucker, S., & Mazeh, T. 1994, ApJ, 420, 806
- Zucker & Mazeh (2001) Zucker, S., & Mazeh, T. 2001, ApJ, 562, 569


| UT Date | Obs Mode | Total Exp. Time (s) |
|---|---|---|
| 2001 Jan 7 | AO | 640 |
| 2001 Feb 2 | non-AO | 960 |
| 2001 May 3 | non-AO | 840 |
| 2001 Jun 2 | non-AO | 840 |
| Observation | NIRSPEC | |
|---|---|---|
| Date | Order | |
| 2001 Jan 7 | 46 | |
| 47 | ||
| 48 | ||
| 49 | ||
| 2001 Feb 2 | 46 | |
| 47 | ||
| 48 | ||
| 49 | ||
| 2001 May 3 | 46 | |
| 47 | ||
| 48 | ||
| 49 | ||
| 2001 Jun 2 | 46 | |
| 47 | ||
| 48 | ||
| 49 |