Abstract
The frequencies of kHz Quasi-Periodic Oscillations in the bright Low-Mass X-ray Binary Sco X-1 have been reported to appear preferentially in a 3:2 ratio. We show that a proper statistical analysis of those RXTE data upon which the claim is based indicated a 2.4 deviation from a constant distribution in ratios. The analysis of a much larger RXTE/PCA dataset shows that there is no sharp concentration around a 3:2 ratio, but that the ratios are broadly distributed over the range 820–1150 Hz.
keywords:
X-ray binaries, oscillationsThe distribution of kHz QPO frequencies in Sco X-1
Introduction
Recently, Abramowicz et al. (2003, hereafter A03) reported that the ratio of the frequencies in the kHz Quasi-Periodic Oscillations (QPO) from the brightest LMXB in the sky, Sco X-1, tend to cluster around a value of 1.5, which they interpret as evidence for a resonance. A mathematical approach to the resonance model was presented by Rebusco (2004) in order to explain the Sco X-1 results; the discrepancies of the data with a pure 3:2 ratio were attributed to the action of an additional ad-hoc force. Here, we present a statistically correct method to establish the presence of such a ratio and analyze a larger RXTE dataset from Sco X-1.
1 The analysis of kHz QPO ratios
It is known that the kHz QPOs in bright LMXBs change frequencies while keeping their difference approximately constant (see van der Klis 2004 for a review). This implies a roughly linear relation between them, by definition not compatible with a fixed ratio. This can be seen in Fig. 1, where the values for Sco X-1 used by A03 are plotted together with a sample of published values for both atoll and Z sources.
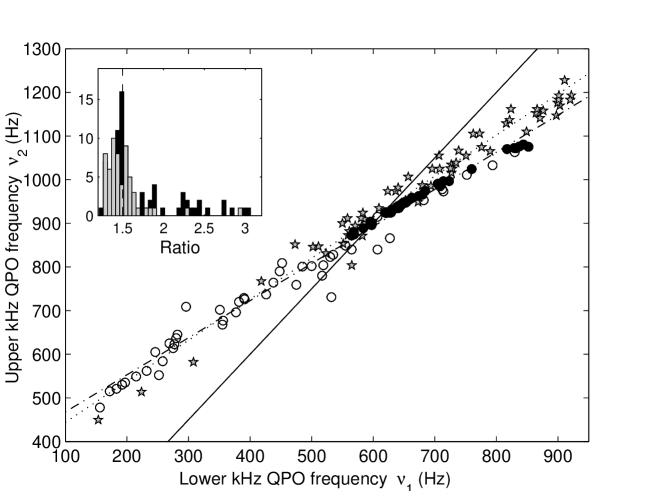
The inset in Fig. 1 shows the corresponding distributions in for atoll and Z sources: the peaks at 1.5 do not correspond to an over-density of points in the vs. plot. The reason is that the ratio of two variables linearly correlated () with is determined mostly by the distribution in one of the variables. Even a homogeneous distribution of points along the correlation, within certain bounds, would lead to a peaked distribution of ratios. This means that determining the distribution of ratios in this case is not the correct statistical way to assess whether there is an excess around that ratio.
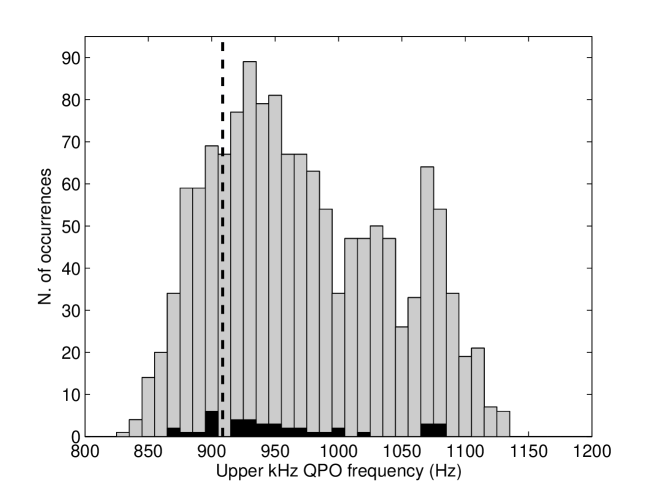
A correct statistical procedure consists in measuring the distribution of one of the two frequencies ( in Fig. 2, black histogram) with respect to the value corresponding to a 3:2 ratio, as estimated from a linear fit to the points in Fig. 1. This fit for the Sco X-1 data yields and and corresponds to the vertical dashed line in Fig. 2. The black histogram in Fig. 2 shows a peak around the expected 3:2 frequency, but it is inconsistent with a constant distribution only at a 2.4 level, due to the low statistics.
2 The large sample
We accumulated a much larger sample of for Sco X-1 using the data analyzed by Mendez & van der Klis (2000). Our sample consists of 1393 frequencies, accumulated from RXTE/PCA data stretches 128s long (see Mendez & van der Klis 2000 for details about the extraction). The distribution of these points is shown in Fig. 2 (gray histogram). This distribution shows three (possibly random) peaks which we fitted with Gaussians. The broadest one is centered at =9362 Hz, inconsistent with the value of =9092 Hz, corresponding to a 3:2 ratio along the correlation of Fig. 1. Notice that, as the upper kHz QPO is much easier to detect than the lower kHz QPO in Sco X-1, we do not have a corresponding distribution in . Although we have shown that the other frequency is not necessary to determine the ratio, once the correlation in Fig. 1 is established, this procedure relies on the assumption of the existence of the lower peak and on its frequency following that relation. However, it is currently the best that can be done with the existing instruments. A full analysis of this distribution and those from other bright LMXBs will be presented in a forthcoming paper.
3 Conclusions
We have shown that a correct statistical treatment of a large set of data allows us to examine the distribution in kHz QPO frequencies for Sco X-1: in this broad distribution, the values corresponding to a 3:2 ratio do not appear to be preferred. It is known that the fractional rms of the kHz QPO peaks decreases at high and at low frequencies (see Mendez, van der Klis & Ford 2001; Di Salvo, Mendez & van der Klis 2003), which is what is observed here. Our results indicate that there is not evidence from the data of a simple 3:2 resonance, which can be excluded at high significance. The introduction of an additional force has been shown to be able to move the frequencies away from the 3:2 ratio (Rebusco 2004): however, this model has two major disadvantages: the first is that it introduces an unknown force, and therefore parameter, in the model; the second is that in moving away the frequencies from their resonant values, it also removes the only observational prediction made by the model.
1
References
- [1] Abramowicz, M.A., Bulik, T., Bursa, M., Kluzniak, W., 2003, A&A, 404, L21
- [2] Di Salvo, T., Méndez, M., van der Klis, M., 2003, A&A, 406, 177
- [3] Mendez, M., van der Klis, M., 2000, MNRAS, 318, 938
- [4] Mendez, M., van der Klis, M., Ford, E.C., 2001, ApJ, 561, 1016
- [5] Rebusco, P., 2004, PASJ, 56, 553
- [] van der Klis, M., 2004, in “Compact Stellar X-Ray Sources”, eds. W.H.G. Lewin and M. van der Klis, in press.