Early reionization by decaying particles and cosmic microwave background radiation
Abstract
We study the reionization scenario in which ionizing UV photons emitted from decaying particle, in addition to usual contributions from stars and quasars, ionize the universe. It is found that the scenario is consistent with both the first year data of the Wilkinson Microwave Anisotropy Probe and the fact that the universe is not fully ionized until as observed by Sloan Digital Sky Survey. Likelihood analysis revealed that rather broad parameter space can be chosen. This scenario will be discriminated by future observations, especially by the EE polarization power spectrum of cosmic microwave background radiation.
pacs:
98.80.-kI Introduction
The dark age between recombination and today has begun to be revealed to be very complicated by recent observations. The first witness is the Gunn-Perterson trough observed by Sloan Digital Sky Survey (SDSS), which implies that the universe was not fully reionized until SDSS . The second shed light on the beginning of reionization history, which may have started as early as , by the spectrum of cosmic microwave background (CMB) radiation observed by Wilkinson Microwave Anisotropy Probe (WMAP) WMAP .
Conventionally the reionization is thought to be caused by the UV photons emitted from the early forming stars, where the ionization fraction of the universe is approximated by a step function Loeb . In fact, the early reionization may be possible with large efficiency for star formation at high redshifts () FK03 ; Ciardi ; Chen . (See also SYY for difficulty in early star formation with running spectral index suggested by WMAP.) However, it makes the ionization fraction unity well before if it should explain large optical depth suggested by WMAP. On the contrary, the Compton optical depth for reionization is not large enough if one considers UV photons from forming stars to be consistent with the data by SDSS Ciardi ; Chiu .
In order to avoid such difficulties, one should think more complicated reionization scenarios. For example, with the use of unconventional initial mass function and different photon emission processes between Population II and III stars, one can obtain the complicated ionization history which has a period of partial reionization before . In particular, some authors Cen ; Hui ; Sokasian showed that the reionization occurs twice.
Here we focus on another possibility. The idea is that the additional UV photons from decaying particles can explain the earlier reionization, while contributions from conventional stars and quasars make the ionization fraction unity at KKS ; HH ; decay . Although the existence of such particles may be suspicious, the ionization history is very realistic once we admit it. The photons from the particle decay are characterized by three parameters: mass, abundance, and lifetime. In this paper, we concentrate on the case that the mass is 30 eV††† Here we consider this decaying particle as a part of cold dark matter (CDM). It can be regarded as CDM in such a way that a scalar condensate is coherently oscillating. , which emits two 15 eV photons to ionize the universe. For the difference between larger mass and this case, see KKS . We will see the decaying particle scenario is consistent with WMAP and SDSS observations.
The structure of this paper is as follows. In the next section, we review how we obtain ionization history due to photons emitted from stars, quasars, and decaying particles. Temperature (TT) and temperature-polarization (TE) power spectra of CMB observed by WMAP are used to evaluate the significance of this scenario in sect.III. Section IV is for our conclusions.
II Ionization history
In our scenario, the sources for ionizing UV photons are decaying particles, quasars and stars. Stars (and quasars) are indeed responsible for the full reionization at . On the other hand, contribution of UV photons from the decaying particles keeps ionization fraction much smaller before for a long period.
We follow the thermal history from including recombination epoch, calculating the ionization fractions of hydrogen (HII) and helium (HeII and HeIII), and the electron temperature, based on the argument of Fukugita and Kawasaki FK94 , where the hierarchical clustering scheme of the cold dark matter scenario is used. In addition, we include the sources of ionizing UV photons from decaying particles KKS . Some different treatments of stars and QSOs from FK94 can also be found in KKS .
We assume that the particle emits two photons with monochromatic energy of half mass of that particle, i.e., . The number density of -particle is written as
| (1) |
where is the lifetime of -particle. Notice that those emitted photons with eV can ionize hydrogen atoms. Then one can write a source term for the decaying particle as
| (2) |
In order to calculate how many photons are emitted, the abundance, mass, and the lifetime of the particle should be fixed. As mentioned above, we choose eV, since this case represents important features of decaying particle scenario. We calculate ionization histories with sec (and sec for some cases), adjusting the abundance to get the desired value of optical depth , whose range we explored is . It is defined by
| (3) |
where is the Thomson cross section and is the electron number density for standard recombination. We subtract this term in order to estimate only the effect of reionization.
Typical ionizing histories are shown in Fig. 1. Here ionization fraction is defined as , where and are the number densities of electron and hydrogen atom, respectively.
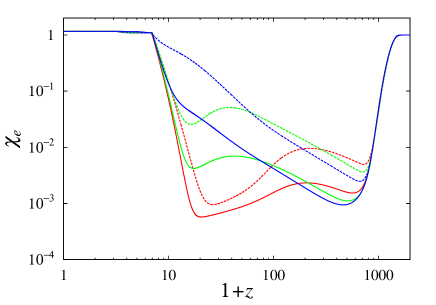
As we will see later, cosmological parameters such as Hubble parameter, , matter density, , baryon density, , and the spectral index of primordial power spectrum, , are varied such that they give the minimum for fitting both TT and TE spectrum observed by WMAP in the flat CDM cosmology.
As we can see in Fig. 1, ionization due to decaying particles endures for a long period, and the ionization fraction remains very small () until . Even in these cases, the optical depth becomes very large.
III Cosmic microwave background
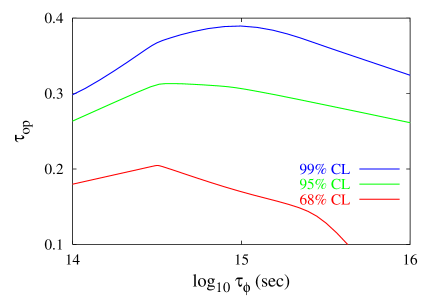
Now we look for how these ionization histories are consistent with CMB observation by WMAP. To this end, we calculate the power spectrum with obtained evolution of the ionization fraction and matter temperature as inputs to the code modified from CMBFAST cmbfast , and evaluate using the code provided by WMAP Verde . We search for the range sec, for the lifetime of the decaying particle, and . For fixed lifetime and optical depth, the minimum is estimated adjusting , , , , and the amplitude of the spectrum. As an indicator for the likelihood, we use to make the contour of likelihood with grid-based analysis. Here we take ichikawa as the six-parameter minimum for CDM model with WMAP-only data.
The likelihood contours are shown in Fig. 2 (See also the Table 1 below.) Here, we converted into the confidence level for two degrees of freedom. One can see the ionization history with and sec is consistent with WMAP data. In general, there is little dependence on the lifetime of decaying particle. For larger optical depth, sec seems more preferable a bit, although its probability is very small because and 1441.2 for and 0.4, respectively. We omit the lifetime longer than sec from the figure, because the ionization fraction becomes unity before for even if there is no contributions of stars and quasars. Of course, if , it is consistent with observations as well. For example, and 1430.5 for and 0.1, respectively. Notice that, for fixed optical depth, ionization histories with lifetime longer than sec are identical to sec case, since it is the value of that concerns with the amount of emitted photons; i.e., the abundance should be ten times larger for the ten times longer lifetime. This relation holds until the abundance reaches .
| TT | TE | |||||||
| 0.417 | 1450.1 | 978.9 | 471.2 | 1.20 | 1.11 | 1.02 | 0.99 | |
| 0.316 | 1438.9 | 976.7 | 462.1 | 1.13 | 1.07 | 1.01 | 0.99 | |
| 0.203 | 1431.7 | 974.7 | 456.9 | 1.05 | 1.03 | 0.99 | 0.98 | |
| 0.098 | 1429.8 | 974.7 | 455.1 | 0.99 | 1.00 | 0.98 | 1.00 | |
| 0.405 | 1438.8 | 979.7 | 459.1 | 1.12 | 1.08 | 1.01 | 1.00 | |
| 0.314 | 1434.7 | 978.8 | 455.9 | 1.07 | 1.06 | 1.00 | 0.99 | |
| 0.202 | 1431.5 | 976.5 | 455.0 | 1.02 | 1.04 | 0.98 | 1.02 | |
| 0.097 | 1430.4 | 975.5 | 454.9 | 0.97 | 1.01 | 0.96 | 1.03 | |
| 0.407 | 1443.7 | 986.0 | 457.7 | 1.05 | 1.05 | 0.99 | 1.00 | |
| 0.307 | 1437.0 | 981.6 | 455.4 | 1.02 | 1.02 | 0.99 | 0.97 | |
| 0.201 | 1432.4 | 978.1 | 454.3 | 0.99 | 1.02 | 0.97 | 1.01 | |
| 0.098 | 1431.4 | 975.8 | 454.9 | 0.98 | 1.00 | 0.98 | 1.00 | |
| 0.199 | 1432.6 | 978.6 | 454.1 | 0.98 | 1.03 | 0.96 | 1.03 | |
| 0.099 | 1430.5 | 976.0 | 454.6 | 0.96 | 1.02 | 0.95 | 1.05 |
We should mention that itself is smaller if reionization takes place instantaneously for the same optical depth. As we have mentioned several times, however, such instantaneous reionization histories do not respect the Gunn-Peterson trough at observed by SDSS. On the other hand, optical depth becomes if the ionization fraction at is suppressed enough to meet SDSS data. (When using our code without contribution of decaying particle, we get .)
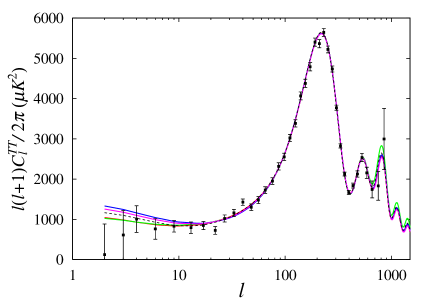
Now let us see the CMB spectra in detail. We show TT, TE, and EE power spectra of CMB in Figs. 35. For TT and TE spectra, we also plot the WMAP data. One can see from Fig. 3 that all the models look almost identical for . The biggest differences can be seen in low multipole region. This happens because large optical depth reduces height of the acoustic peaks, which results in larger power in low multipoles () when the height of the first acoustic peak is fixed. In addition to this, the spectrum should be more tilted to the blue side for larger optical depth in order to fit the data, i.e., the well-known degeneracy, which lowers the plateau. Thus the outputs are made by competition between the two opposite effects.
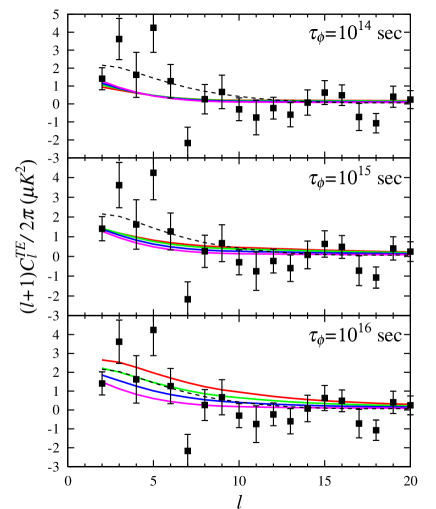
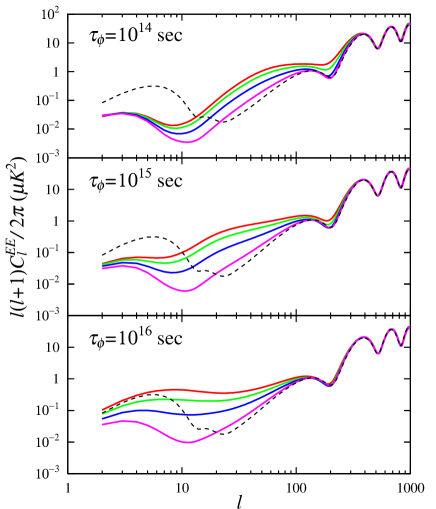
Important point at present is that TE power spectrum does not have much ability of determining ionization histories using the first year WMAP data. The errors are still large, and even though those histories which do not seem to fit the TE data well have small (see Fig. 4 and Table 1) if the fit to TT data is good enough. This may lead to the fact that there is little dependence of the on the lifetime especially for small optical depth region. Reversely, we could distinguish among different histories with various optical depth so long as the errors diminish.
Although one may discriminate among the models using TE spectrum, EE spectrum seems the most promising tool for that purpose. Most different feature of decaying particle scenario is the larger power at (a few) due to enduring UV photon emission. Moreover, we may distinguish even the lifetime of decaying particle depending on whether there is a dip around and the steepness of the slope below . Therefore, EE spectrum expected to be seen by Planck satellite or even WMAP should (dis)prove the photons from decaying particles in the near future.
IV Conclusion
We have sought for a natural reionization history which respects both WMAP and SDSS observations. Decaying particles provide UV photons which reionize the universe from rather early period as suggested by WMAP, but keeps the ionization fraction very small until usually considered UV sources such as stars and quasars bring up the fraction to unity abruptly at as observed by SDSS. The central concern is how well such scenario goes on. To this end, we have calculated TT and TE power spectra of CMB, and done the likelihood analysis. We have found decaying particle scenario is consistent with both observations in rather broad parameter space. Even particles with lifetime sec, corresponding to the redshift , which have the abundance to give , seems good as well.
Looking into the detail, it is the TT power spectrum that determines the value of dominantly. This is the reason why the reionization history, whose TE spectrum does not seem to fit the data so well, can have small , such as 1429.8 for and sec, for example. When the quality of TE data improves, then one may be able to tell which reionization history is preferable. As for the ability of discriminating each history, EE spectrum may be the best tool. Decaying particle scenario has a peculiar feature that there is much more excess of the power in the range compared with instantaneous reionization case. Moreover, it may be possible to observe even the lifetime of the decaying particle.
Finally, we comment on a maybe serious problem if one regards early forming stars as the whole source of ionization photons because of the less powers on smaller scales observed by, say, 2dfGRS and SDSS. Since the decaying particle scenario does not owe to early forming stars as the UV source, it is completely free from such a problem. We have checked that our model works also for the running spectral index suggested by WMAP. Since all the astrophysical UV sources may suffer this problem, the decaying particle could be the better source of ionizing UV photons.
Acknowledgments
SK is grateful to K. Ichikawa for useful discussions. MK is supported by Japanese Grant-in-Aid for Science Research Fund of the Ministry of Education, No.14540245 and No.14102004.
References
- (1) X. Fan et al., Astron. J. 123, 1247 (2002).
- (2) A. Kogut et al., Astrophys. J. Suppl. 148, 161 (2003); D.N. Spergel et al., Astrophys. J. Suppl. 148, 175 (2003).
- (3) A. Loeb and R. Barkana, Ann. Rev. Astron. Astrophys. 39, 19 (2001), and references therein.
- (4) M. Fukugita and M. Kawasaki, Mon. Not. R. Astron. Soc. 343, L25 (2003).
- (5) B. Ciardi, A. Ferrara and S.D.M. White, Mon. Not. R. Astron. Soc. 344, L7 (2003).
- (6) X. Chen, A. Cooray, N. Yoshida and N. Sugiyama, Mon. Not. Roy. Astron. Soc. 346, L31 (2003).
- (7) R.S. Somerville et al., Astrophys. J. 593, 616 (2003); N. Yoshida et al., Astrophys. J. 591, L1 (2003); Astrophys. J. 598, 73 (2003).
- (8) W.A. Chiu, X. Fan, J. P. Ostriker, Astrophys.J. 599, 759 (2003); C.A. Onken and J. Miralda-Escudé, Astrophys.J. 610 1 (2003).
- (9) R. Cen, Astrophys. J. 591, 12 (2003).
- (10) L. Hui and Z. Haiman, Astrophys. J. 596, 9 (2003).
- (11) A. Sokasian, A. Ferrara and S. D. M. White, Mon. Not. R. Astron. Soc. 344, 607 (2003); A. Sokasian et al., Mon. Not. Roy. Astron. Soc. bf 350, 47 (2004).
- (12) S. Kasuya, M. Kawasaki, and N. Sugiyama, Phys. Rev. D 69, 023512 (2004).
- (13) S.H. Hansen and Z. Haiman, Astrophys. J. 600, 26 (2004).
- (14) X. Chen and M. Kamionkowski, Phys. Rev. D 70, 043502 (2004); P.P. Avelino and D. Barbosa, astro-ph/0406063.
- (15) M. Fukugita and M. Kawasaki, Mon. Not. R. Astron. Soc. 269, 563 (1994).
- (16) U. Seljak and M. Zaldarriaga, Astrophys. J. 496, 437 (1996).
- (17) L. Verde et al., Astrophys. J. Suppl. 148, 195 (2003); G. Hinshaw et al., Astrophys. J. Suppl. 148, 135 (2003); A. Kogut et al., first paper in Ref. WMAP .
- (18) K. Ichikawa, M. Fukugita, and M. Kawasaki, in preparation.