L M band infrared studies of V4332 Sagittarii - detection of the water-ice absorption band at 3.05 m and the CO fundamental band in emission
Abstract
L and M band observations of the nova-like variable V4332 Sgr are presented. Two significant results are obtained viz. the unusual detection of water ice at 3.05m and the fundamental band of 12CO at 4.67m in emission. The ice feature is a first detection in a nova-like variable while the CO emission is rarely seen in novae. These results, when considered together with other existing data, imply that V4332 Sgr could be a young object surrounded by a circumstellar disc containing gas, dust and ice. The reason for a nova-like outburst to occur in such a system is unclear. But since planets are believed to form in such disks, it appears plausible that the enigmatic outburst of V4332 Sgr could be due to a planetary infall. We also give a more reliable estimate for an epoch of dust formation around V4332 Sgr which appears to have taken place rather late in 1999 - nearly five years after its outburst.
1 Introduction
We present here L and M band results on V4332 Sgr. Recent studies of V4332 Sgr have shown that it is an interesting object and the present results further support this view. V4332 Sgr erupted in 1994 in a nova-like outburst with an outburst amplitude of 9.5 magnitude in the visible region. There was only one detailed study of the object during its outburst (Martini et al. 1999) which showed that its eruption was different from that of a classical nova or other classes of eruptive variables. Interest in the object has been rekindled because of the recent outburst of V838 Mon which drew considerable attention due to its light-echo (Munari et al. 2002; Bond et al. 2003). It is believed that V838 Mon, V4332 Sgr and M31 RV ( a red-variable which exploded in M31 in 1988; Rich et al. 1989) could be members of a new class of eruptive objects (Munari et al. 2002; Bond et al. 2003, Kimeswenger et al. 2002). The cause of the outburst in these objects does not appear to be satisfactorily explained by conventional mechanisms. Thus new theories have been proposed viz. a scenario involving the merger of main sequence stars (Soker Tylenda, 2003) and a hypothesis invoking planetary-capture by an expanding star to explain the eruption (Retter Marom, 2003). The present data indicate that the second mechanism could be viable in V4332 Sgr.
Recent infrared studies of V4332 Sgr have detected several bands of AlO at a low rotational temperature of 200-300K (Banerjee et al. 2003). A considerable change in the spectral energy distribution (SED) of the object was seen between 2MASS data of 1998 and observations in 2003 indicating the formation of a dust shell between these two epochs (Banerjee et al. 2003). A better estimate of the epoch when the dust actually formed is discussed here. Optical spectroscopy of V4332 Sgr in 2003, showed an interesting spectrum dominated by very strong emission in the resonance lines of KI and NaI (Banerjee Ashok 2004). The SED of the star, derived from optical and IR data, indicated a central star with a black-body temperature of 3250K and an IR excess attributed to a dust component at 900K (Banerjee Ashok 2004).
2 Observations
Observations were done using the 3.8m UK Infrared Telescope (UKIRT). Spectroscopy was done using the UKIRT Imaging spectrometer (UIST), which uses different grisms to cover the 1.4-5 micron range. (3.77 m) and (4.68 m) band photometry - not available earlier for V4332 Sgr - was also done using UIST. Flat-fielding, spectral calibration and other reduction procedures were done on the same lines as our earlier study of V4332 Sgr (Banerjee et al. 2003).The log of the observations and the observed magnitudes of V4332 Sgr are given in Table 1.
3 Results
3.1 The water ice feature at 3.05 m and the CO fundamental band emission
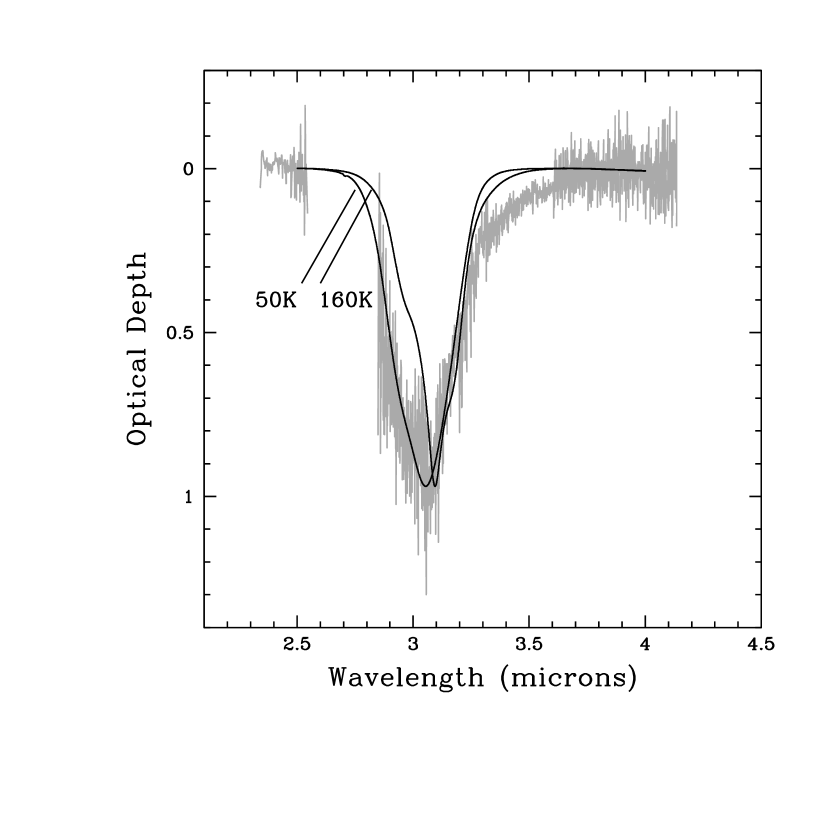
Figure 1 shows the spectrum - the A-X bands of AlO in the band, reported earlier (Banerjee et al. 2003) are seen prominently in the present spectrum also but are not discussed here. A remarkable feature - never seen before in a nova-like object - is the deep, solid-state 3.05 m water-ice band formed due to the O-H stretching mode. At very low temperatures, atoms and molecules can collide and adhere to a dust grain to produce an ice mantle on the surface. Atoms can migrate from one site to another on the mantle to form a molecule - water ice is believed to form this way with H atoms combining with an O atom. The presence of cold water-ice around V4332 Sgr is extremely unexpected since the ejecta of classical novae generally evolve to high temperatures of 106K (the coronal phase). Following a standard procedure, we have obtained the optical depth plot of the ice feature by fitting a polynomial to the continuum around it (Gibb et al. 2004). The depth of the ice feature below this continuum was found and converted to an optical depth. The optical depth plot is shown in Figure 2. The 3.05 m feature was compared with laboratory data for the optical depth of water-ice at different temperatures (10, 30, 50, 120 and 160K) taken from the Leiden database for ice analogs111 http://www.strw.leidenuniv.nl/lab/. From a 2 test to the observed and model data, we find that the 50K data gives the smallest value of 2. The 30K data also gives a comparable value of 2 thus suggesting a low temperature of 30-50K for the water ice. An extended red wing between 3.3-3.8 m, which is not well fitted by the models, is seen in the observed data. This extended ice wing is also seen in several water ice detections but the species responsible for it is unidentified (Gibb et al. 2004). From Figure 2, the column density of the water-ice was calculated using = d/, where is the the band strength for water-ice with a laboratory measured value of = 2010-17 cm molecule-1. While carrying out the integration, we have assumed that the missing data points around 2.65 m (due to atmospheric cutoff), are represented by the data points of the 50K laboratory model in that region. We obtain a value of d = 36227 cm-1 leading to = (1.810.13)1018 cm-2 - this value may be used in case of future detection of other ices (CO2, CH3OH, CH4 etc.) in V4332 Sgr to get a better understanding of the ice composition.
Another rare feature seen in V4332 Sgr is the fundamental band ( = 1-0) of 12CO at 4.67 m in emission. There appear to be only a few other detections of the CO fundamental in emission - mostly towards YSOs and Herbig AeBe stars (e.g. Blake Boogert 2004; Pontoppidan et al. 2002). In a few novae, emission in the CO first overtone bands has been seen (Rudy et al. 2003 - Table 3 therein; Evans et al. 1996) but the detection of the fundamental band appears rare (Lynch et al. 1997). The expanded CO ro-vibrational spectrum in V4332 Sgr is shown in Figure 3. Individual branch lines from P1 to P12 and R0 to R12 are clearly seen. The lines are not resolved at their intrinsic width at the observed resolution of 1000. A simple model for the 12CO emission was computed assuming LTE conditions with the level populations proportional to (2J+1)e-BhcJ(J+1)/kT where B and J are the rotational constant for CO and the rotational quantum number respectively; T is the temperature. The strength of each P or R branch line was then obtained using the transition probabilities for the lines given by Goorvitch (1994). The line positions were also taken from Goorvitch (1994). The model spectrum thus obtained was convolved with a Gaussian instrument function of FWHM 0.046 m (i.e. a resolution of 1000). From the model fits, it is difficult to constrain the temperature of the gas too accurately, but a relatively low temperature of 300-400K is suggested. This could possibly be the reason for the absence in V4332 Sgr of the first overtone CO bands at 2.3-2.45m which need a higher temperature for excitation. These bands have been modeled to have a temperature in the range 2500-4500K in novae (Rudy et al. 2003 ; Evans et al. 1996). Further, the strong presence of AlO bands in V4332 Sgr in the same spectral region as the CO first overtone bands, makes it difficult to draw definite conclusions on the absence/presence of the latter. A better estimate for the CO temperature than that derived here would require modeling based on higher resolution spectra (e.g. Blake Boogert 2004; Pontoppidan et al. 2002).
3.2 The case for V4332 Sgr being a young object with a surrounding circumstellar disk
The detection of water ice at 30-50K in V4332 Sgr is very intriguing since such a low temperature component is not expected in novae ejecta. Based on the recent comprehensive survey (Gibb et al. 2004 and references therein), most water-ice detections are seen towards embedded YSOs/protostars. Such objects are known to have circumstellar disks (CSDs) around them. In addition, water-ice has also been seen in Herbig AeBe stars and a few T Tauri stars (Creech Eakman et al. 2002; Meeus et al. 2001, Gibb et al. 2004). These are all young objects observationally known to possess CSDs. Furthermore, all the gaseous components of V4332 Sgr are seen in emission i.e. the KI/NaI, CO, AlO and TiO lines (Banerjee Ashok 2004; Banerjee et al. 2003). These species are at a low temperature ( 200K for AlO ; a low excitation temperature is also implied for the KI/NaI lines which need only 1.5-2eV for excitation). If the region in which these species exist were to be a shell surrounding the central 3250K star of V4332 Sgr (Banerjee Ashok 2004), the relatively cold gas of these species should lead to lines in absorption. Such is not the case. Instead, if the various species are in a disk, their lines can be expected in emission. Furthermore, in the case of a disk, the central star would also be observable since it will be unobscured (some obscuration could occur depending on the orientation and thickness of the disk). Such is the case in V4332 Sgr where the continuum from the central star is clearly seen. Additional support for a CSD is the infrared excess seen in V4332 Sgr (Banerjee Ashok 2004). This IR excess can be attributed to dust in the disk and not in a shell around the star since the dust shell would obscure the visible radiation of the star. A similar reasoning is used to explain the IR excess in T Tauri stars. It is also relevant to note that many of the known CO fundamental detections are in disk-dominated Herbig Ae stars (Blake Boogert 2004). The considerable width of the KI lines in V4332 Sgr was also shown to be consistent with line broadening arising from rotational motion of gas in a disk (Banerjee Ashok 2004). An additional signature that V4332 Sgr has pre-existing matter around it at the time of the 1994 outburst comes from the high-resolution H profiles of the object taken shortly after its outburst. These profiles (Figure 8 of Martini et al. 1999) show a deep absorption trough at the center which could be caused by absorption by pre-existing matter. Therefore, many of the observed characteristics of V4332 Sgr support the existence of a CSD around the object. However, it is difficult to rule out the possibility of the matter being in clumps instead of a disk. It may be pointed out that the maximum value of 1 of the ice feature (Figure 2), would imply a large extinction of Av 14 magnitudes towards the central star, had the 3.05m absorption arisen because of cold, intervening matter in the line of sight ( as in embedded YSOs in dark clouds; Whittet 1992). As the central star appears unobscured (V= 17.52, Banerjee Ashok 2004), the 3.05m feature could instead be caused by ice in the CSD viewed against the IR flux from dust in the disc leading to the absorption feature.
3.3 The formation of dust around V4332 Sgr
It was earlier shown that the fluxes of V4332 Sgr changed considerably between 2MASS observations of May, 1998 ( =12.1, = 11.6, = 10.992) and observations of June, 2003 ( =13.25, = 11.986, = 10.023; Banerjee et al. 2003). While the 2 MASS data showed no IR excess and was well modeled by a 3250K blackbody, the 2003 data showed a composite SED of a blackbody component at 900K (due to newly formed dust) and a weakening of the 3250K component due to obscuration by dust. However, it was not possible to establish with accuracy at which stage between 1998 and 2003 the dust formed. Data from the DENIS survey is now available and this shows that in September, 1999 V4332 Sgr had IR magnitudes of = 12.46 and = 10.65 (DENIS did not observe in band). A comparison between 2MASS and DENIS magnitudes clearly shows the IR flux increasing towards longer wavelengths indicating that dust formation had begun by the DENIS epoch. The formation of dust therefore took place at tdust 5.5 years after the outburst of February 1994. This is much larger than the typical timescale of 50-100 days for dust formation in classical novae. The difficulty in having a large dust-condensation time in novae is that the density in the ejecta decreases to a low level - due to expansion - that does not favor dust-formation. The density in the ejecta of novae that form dust is in the range 10-15 to 10-16gcm-3 (Gehrz 1988). In V4332 Sgr, the electron density ne after 2-3 months from the outburst was estimated to be 108-9 cm-3 (Martini et al. 1999). A geometric dilution for the expanding ejecta matter may be a reasonable assumption i.e ne 1/r2 provided the ejecta expands freely, unhindered by pre-existing matter. Assuming ne 1/r2, after a time of 5.5yr, ne should have evolved to 105-6 cm-3 giving a value of = 10-17 - 10-18gcm-3. Such a low value of appears unfavorable for dust formation. It therefore appears that dust formation may not have occured per se in the ejecta of the 1994 outburst. It is likely that the ejecta, after a stage of free expansion, could have impinged on pre-existing matter around V4332 Sgr - sufficiently far from the star - thereby heating it and giving rise to the observed emission at present from different species. This could be one possible scenario to explain the large observed time for the formation of dust. In a connected aspect, we note that the present , data of Figure 1, shows the continuum peaking at 4.4m indicating a lower, dust temperature than the 900K that was inferred earlier. However, mid/far-IR observations planned on the Spitzer Telescope should give more definite information on the dust temperature.
4 Discussion: Is a planetary infall responsible for the outburst in V4332 Sgr?
More than a hundred stars with planets (SWPs) are known today222http://cfa-www.harvard.edu/planets/cat1.html and in 15 of these the planetary companion is unexpectedly close to the host star ( 0.05 AU). The orbits of such short-period planets around sun-like stars can be unstable because of tidal dissipation and they can be subsequently consumed by the host stars (Sandquist et al. 2002; Rasio et al. 1996). More evolved stars are also capable of swallowing their planets as they expand (Siess Livio 1999). The viability of planetary ingestion is observationally supported by the enhanced metallicity seen in many SWPs - and the presence of Li isotopes in one of them - suggesting that planetary material has been accreted by the host star in the past (Santos et al. 2000; Gonzalez et al. 2001; Israelian et al. 2003). In particular context of V4332 Sgr type of objects, Retter and Marom (2003) have explained the multi-peak light curve of V838 Mon as due to an expanding star ingesting its planets.
We have shown that there is considerable evidence that V4332 Sgr is surrounded by a cold, dusty disk. It is precisely in such an environment that planets are believed to be born from the coagulation and accretion of solid ice and dust particles (Lissauer 1993). Therefore, while it may appear speculative, it is not entirely unlikely that a planet existed around V4332 Sgr and its infall led to the outburst. The plausibility of this scenario is strengthened since other conventional mechanisms - such as a thermo-nuclear runaway on a white dwarf surface (invoked for classical, recurrent, symbiotic novae) or a final Helium shell flash (invoked for a born-again AGB star) - fail to explain the pre- and post-outburst properties of V4332 Sgr or similar objects. It was shown (Retter Marom 2003) in the analysis for V838 Mon, that the gravitational energy released by a 1MJ planet falling into a solar-mass star is 4105L⊙. The outburst luminosity of V4332 Sgr is difficult to estimate as the distance to the object is very uncertain. Using an estimate of = 300 pc (Martini et al. 1999) we have shown that the star has a quiescent luminosity of 0.3⊙ (Banerjee et al. 2003). A 9.5 magnitude brightening at outburst would yield an outburst luminosity of 2103L⊙. This is lower than the predicted energy release for the capture of a 1MJ planet but could be made consistent by revising the distance (the current distance estimate to V838 Mon has been revised upwards by a factor of nearly 10 from its first estimate), invoking a smaller mass for the captured planet or that a large part of the released gravitational energy has gone into expansion of the stellar envelope (Retter Marom 2003) rather than visible radiation. However, we feel there are many aspects about the nature of V4332 Sgr that are still unclear and there is scope for alternative models, apart from that proposed here, to explain its outburst.
References
- ref (2) Banerjee, D.P.K., Ashok, N.M. 2004, ApJ, 604, L57
- ref (4) Banerjee, D.P.K., Varricatt, W.P., Ashok, N.M., Launila, O. 2003, ApJ, 598, L31
- ref (5) Blake, G. A. Boogert, A. C. A. 2004, ApJ, 606, L73
- ref (6) Bond, H.E., et al. 2003, Nature, 422, 405
- ref (7) Creech Eakman, M. J., Chiang, E. I., Joung, R. M. K., Blake, G. A. van Dishoeck, E. F. 2002, AA, 385, 546
- (6) Evans, A., Geballe, T. R., Rawlings, J. M. C.,. Scott, A. D. 1996, MNRAS, 282, 1049
- ref (8) Gehrz, R.D. 1988, ARAA, 26, 377
- ref (9) Gibb, E. L. , Whittet, D.C.V., Boogert, A.C.A. Tielens, A.G.G.N. 2004, ApJS, 151, 35
- ref (10) Gonzalez, G., Laws, C., Tyagi, S. Reddy B.E. 2001, AJ, 121, 432
- ref (11) Goorvitch, D. 1994, ApJS, 9, 535
- ref (12) Israelian, G., Santos, N.C., Mayor, M., Rebolo, R. 2003, AA, 405, 753
- ref (13) Kimeswenger, S., Lederle, C., Schmeja, S., Armsdorfer, B. 2002, MNRAS, 336, L43
- ref (14) Lissauer, J. L. 1993, ARAA, 31, 129
- (14) Lynch, D. K., Russell, R. W., Kellogg, R. C., Mazuk, A.L., Hanner, M.S. 1997 AJ, 113, 1391
- ref (15) Martini, P., Wagner, R.M., Tomaney, A., Rich, R.M., Della Valle, M., Hauschildt, P.H. 1999, AJ, 118, 1034
- ref (16) Meeus, G. et al. 2001, AA, 365, 476
- ref (17) Munari, U., et al. 2002, AA, 389, L51
- ref (18) Pontoppidan, K. M., Schier F. L., van Dishoeck, E. F. Dartois, E. 2002, AA, 393, 585
- ref (19) Rasio, F. A., Tout, C.A. , Lubow, S.H. Livio, M. 1996, ApJ, 470, 1187
- ref (20) Retter, A., Marom, A. 2003, MNRAS, 345, L25
- ref (21) Rich, R.M., Mould, J., Picard, A., Frogel, J.A., Davies, R. 1989, ApJ, 341, L51
- (22) Rudy, R. J., Dimpfl, W. L., Lynch, D. K., Mazuk, S., Venturini, C. C., Wilson, J. C., Puetter, R. C. Brad Perry, R. 2003, ApJ, 596, 1229
- ref (22) Sandquist, E. L., Dokter, J. J., Lin, D. N. C. Mardling, R. A. 2002, ApJ, 572, 1012
- ref (23) Santos, N. C., Israelian G. Mayor M. 2000, AA, 363, 228
- ref (24) Siess, L. Livio, M. 1999, MNRAS, 308, 1133
- ref (25) Soker, N., Tylenda, R. 2003, ApJ, 582, L105
- ref (26) Whittet, D. C. B., 1992, Dust in the galactic environment, IOP Publishing Ltd., Bristol.


| Date(UT) | Band | Resol- | Integration | Standard | Magni- |
| ution | time(s) | Star | tude | ||
| SPECTROSCOPY | |||||
| 2003 Sept. 5.294 | M | 1000 | 312 | BS 6998 | |
| 2003 Sept. 5.359 | KL | 700 | 360 | BS 6998 | |
| 2003 Sept. 5.328 | Short L | 650 | 720 | BS 6969 | |
| 2004 April 15.606 | HK | 500 | 720 | BS 7038 | |
| 2004 April 29.642 | Long L | 1150 | 320 | BS 6998 | |
| PHOTOMETRY | |||||
| 2003 Sept. 5.262 | L’ | 252 | HD 161743 | 7.23 0.025 | |
| 2003 Sept. 5.276 | M’ | 322 | HD 161743 | 6.10 0.03 |