H1517+656: the Birth of a BL Lac Object?
Abstract
H1517+656 is an unusual source, even for a BL Lac object. It is one of the most luminous BL Lacs known, with extreme emission properties at radio, optical, and X-ray frequencies. Furthermore, in our WFPC2 snapshot survey we discovered a series of peculiar arcs describing a 2.4 radius ring surrounding the source. This paper describes follow-up observations with additional WFPC2 bands and the STIS longpass filter, which have revealed this structure to be the remnants of a very recent galaxy merger. Population synthesis modelling has shown that regions of the arcs have stellar populations with age 20 Myrs. Additionally, the circularity of the arcs indicates that the plane of the collision and hence accretion is very close to the plane of the sky. Given that BL Lac jets are thought to be aligned with the line of sight, this observation may provide a direct link between the transfer of angular momentum in an interaction and the generation of a radio source.
1 Introduction
The physical processes behind the BL Lacertae phenomenon are not fully understood. The presence of a relativistic jet closely aligned with the line of sight is well accepted, but it is unclear whether this is sufficient to explain the near-absence of emission or absorption lines in their spectra (see Urry & Padovani 1995 for a review). It may be that this lack of line features, as well as the intrinsically low accretion rates of BL Lacs compared to more powerful radio sources (O’Dowd, Urry & Scarpa, 2002), is also due to a relatively low supply of gas to the broad line region and accretion disk. Such a shortage may result from the conditions of formation and environment of BL Lacs, or perhaps be a function of their age as active radio sources.
The HEAO 1 A-3 BL Lac object H1517+656 is an extreme example of its class, and may present a unique chance to probe some of these questions. Not only is it the most optically luminous BL Lac known, but this extreme emission extends to both radio and X-ray frequencies. Although a high-frequency peaked BL Lac, with an X-ray flux of erg cm2 s-1 (ROSAT 0.07 – 2.4 keV band; Brinkmann & Siebert 1994), H1517+656 was first detected in the NRAO Green Bank 4.85 GHz radio catalog, with a flux density of mJy (Becker, White & Edwards, 1991). Its optical brightness was found to be similarly high, first measured at mag by Elvis et al. (1992), where it was also identified as a BL Lac. A lower limit on the redshift of H1517+656 of was determined by Beckmann, Bade & Wucknitz (1999), based on FeII and MgII absorption lines. Even at this minimum redshift, H1517+656 is currently the most optically luminous BL Lac object known, with mag and mag (assuming km s-1 Mpc-1, , ). Its X-ray and radio luminosities are also among the highest known for BL Lacs, with erg s-1 in the ROSAT PSPC band and W Hz-1 at 1.4 GHz from VLA measurements of its unresolved core (Kollgaard et al., 1996).
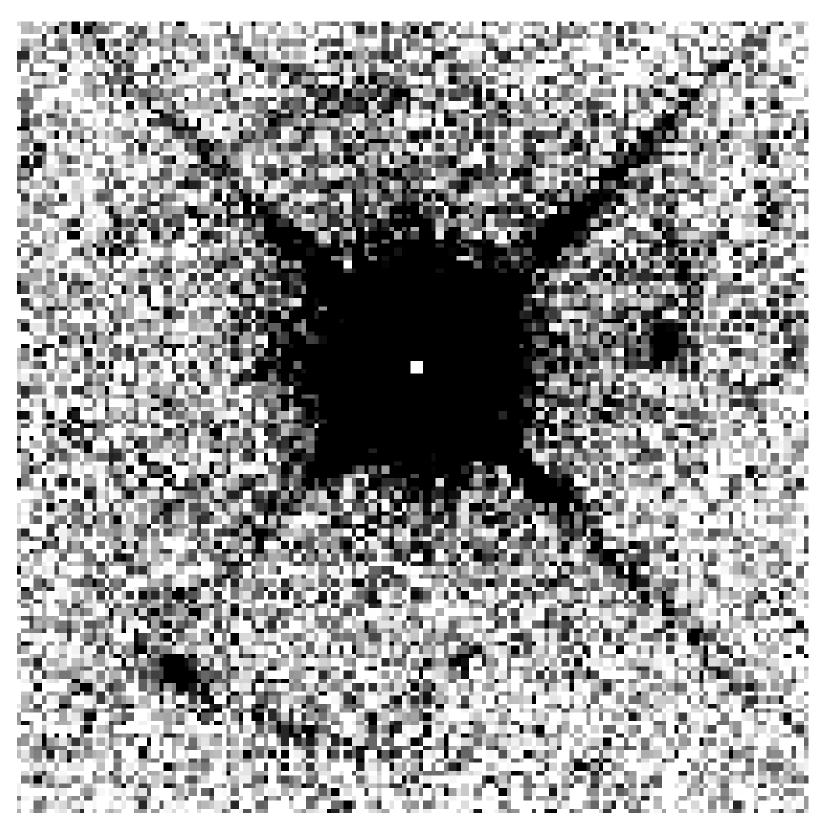
Due to the optically bright nucleus, efforts to detect the host galaxy of this BL Lac have been unsuccessful. Although not revealing the host galaxy, the short HST snapshot R-band image from our Cycle 6 study (Urry et al., 2000; Scarpa et al., 1999) uncovered an intriguing new mystery surrounding H1517+656: a system of arcs and knots in a near-circular ring of radius 2.4 around the bright nucleus (Fig. 1).
The average surface brightnesses of the arcs are mag/arcsec2, with radially-resolved widths of . There are two especially bright ’knots’ and position angles 126∘ and 260∘, which have magnitudes mag and 23.8 mag, respectively. The short, 320-second WFPC2 F702W exposure achieved a signal-to-noise ratio of 1.5 per pixel in the arcs. While this provides a confident detection, much additional detail is likely still to be undetected. As a result, the origin of this structure could not be determined with this data.
As discussed in Scarpa et al. (1999), a number of different explanations for the nature of the arcs present themselves. These fall into three main groups: either a) the arcs are gravitationally lensed images of an extended background source; b) the arcs are physically associated with the BL Lac object, either as nearby structure or as part of the host galaxy; or c) the arcs are the spiral arms of an intervening face-on spiral galaxy. This last explanation is perhaps the least likely, as discussed in Scarpa et al. (1999), however both (a) and (b) warrant careful consideration.
In the case of (a), the only possible configuration is an extended background source, either a galaxy or cluster of galaxies, being lensed by either BL Lac’s host galaxy or local group of galaxies. Were the BL Lac part of the lensed object then, as the central image, it would be heavily de-magnified, and a second image would be observed outside the ring. This scenario had been investigated by Beckmann, Bade & Wucknitz (1999) based on the original HST data, and they find a lensing mass of M⊙ is needed to produce arcs of the observed radius.
In the case of (b), it is probable that the arcs are the remnants of a galaxy—galaxy interaction rather than structure within the BL Lac host galaxy. The diameter of the ring is at least kpc (at the minimum redshift of the BL Lac, ) — too large to be the spiral arms of a host galaxy (Scarpa et al., 1999). If this scenario is correct, then we may be looking at a violent ongoing galaxy interaction. If such interactions are indeed the primary triggers of activity in galaxy nuclei, then H1517+656 may be a BL Lac in the midst of its formation. This is an interesting possibility given the extreme emission properties of the source.
In this paper we describe the follow-up HST imaging program undertaken to determine the nature of the arcs surrounding H1517+656. In section 2 we describe the observations and data reduction, including the host galaxy analysis and photometry of the arcs. We present our analysis and discussion in § 3, where we describe why the interacting galaxy scenario is preferred over gravitational lensing or an intervening spiral galaxy as an explanation for the origin of the structure (§ 3.1); model the stellar populations in the arcs (§ 3.2 and 3.4); and look at the link between the dynamics of the assumed galaxy interaction and the activity in the nucleus (§ 3.5). In § 4 we summarize our results.
The cosmology used throughout this paper is km s-1 Mpc-1, , and .
2 Observations and Data Reduction
H1517+656 was imaged with HST on the 17th of June 2000 using the STIS CCD with the F2850LP longpass filter and the PC2 CCD with the F555W and F814W filters. The STIS observations provide very deep, high-resolution imaging for lens modelling or morphological analysis, while the PC2 observations provide colour information to test the lensing hypothesis and allow modelling of stellar populations. Table 1 gives the exposure times for these observations.
2.1 Data Reduction and Sky Subtraction
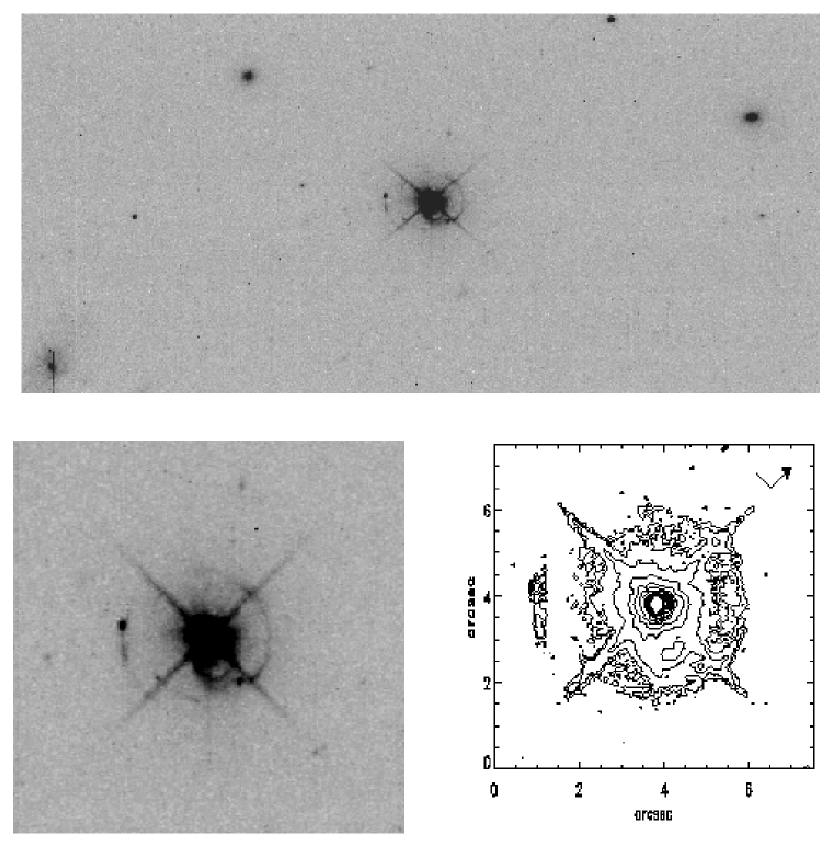
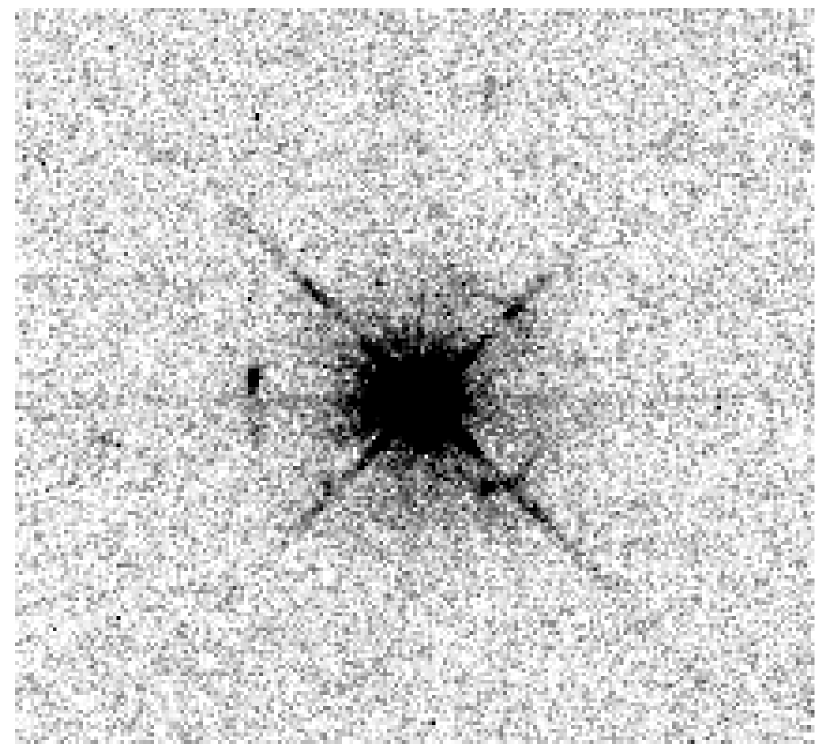
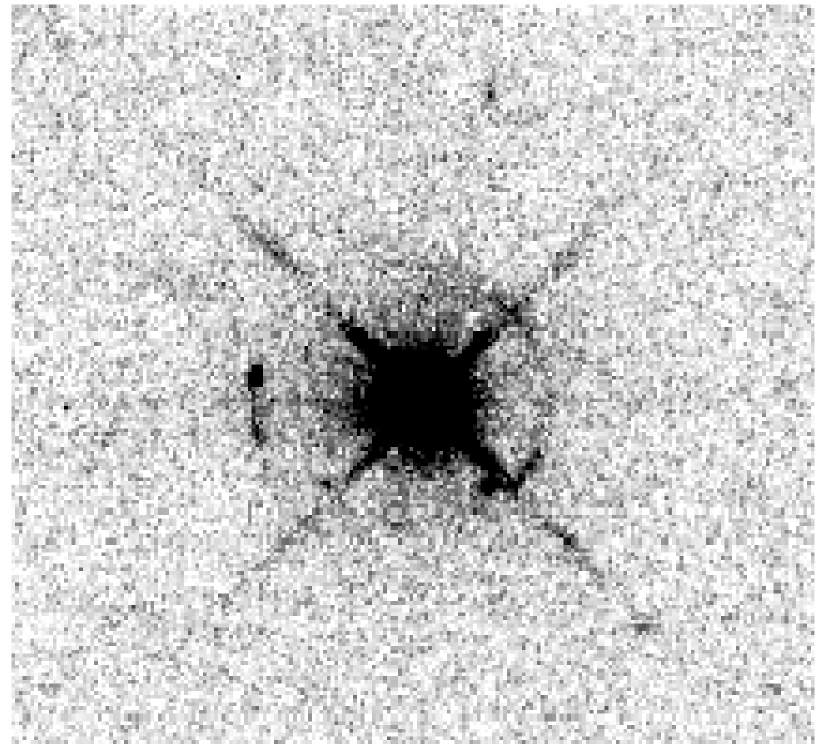
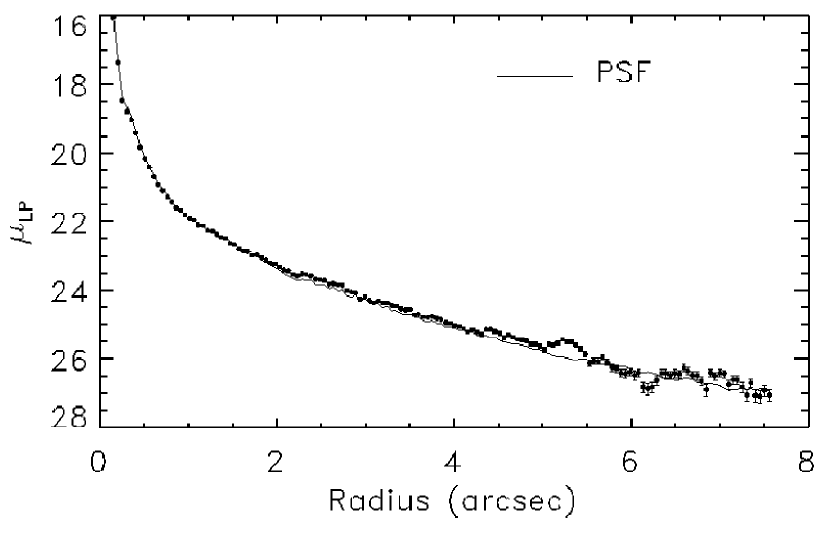
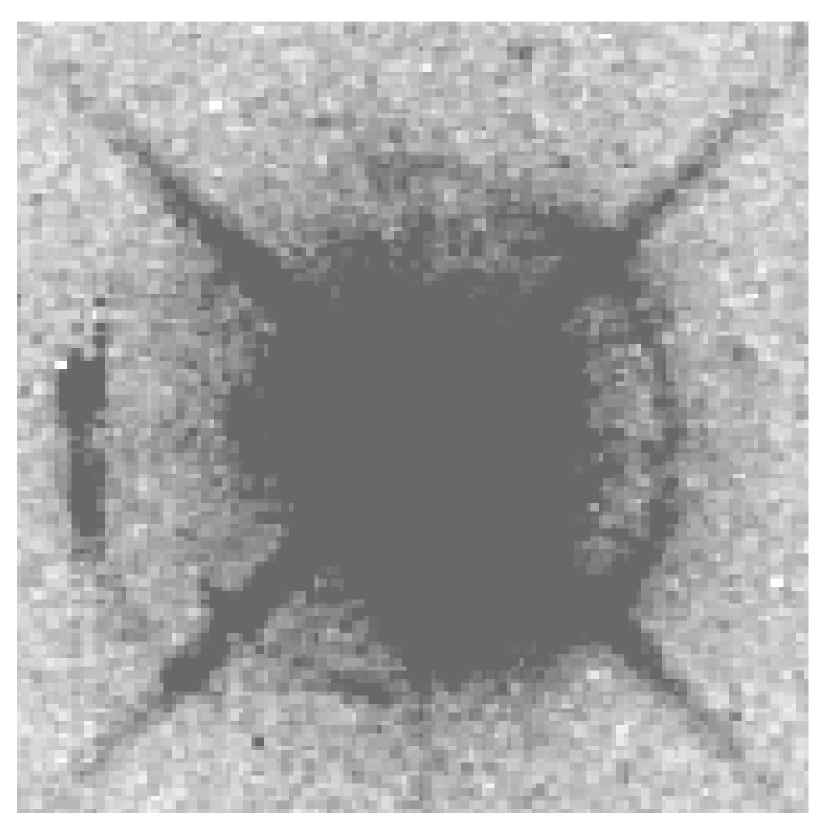
The data were bias-subtracted, flat-fielded, cosmic ray-rejected and combined using STIS and WFPC packages in IRAF’s STSDAS suite. The background was taken to be the median in the region of each combined imaged that was unaffected by visible sources. Such sources were masked well beyond their visible extent for determination of the background. The error in the background value was calculated from two sources — the pixel-to-pixel poissonian shot noise (), and the large scale variation in the background level (). The latter was taken to be the maximum of: the standard deviation in the medians of a grid of 2020 pixel squares, and the standard deviation in the medians of the four quadrants of the image. The final error in the subtracted sky value was then: . Figures 2 and 3 show the reduced, sky-subtracted images.
2.2 Modelling the Point Spread Function
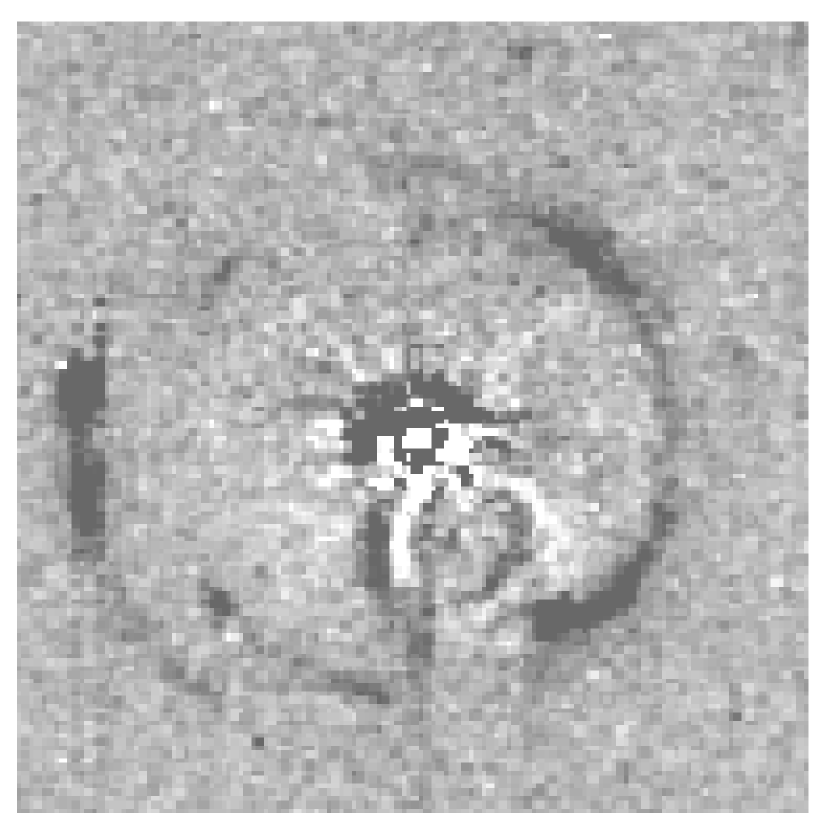
While the model Point Spread Function (PSF) generated by the Tiny Tim (Krist & Hook, 2001) software is useful in finding the detailed structure of the PSF, it does not account for the scattered light in the wings (Scarpa et al., 2000), or for the well-known ’ghost loop’ reflection feature in the STIS PSF. As the arcs around H1517+656 have very low surface brightnesses, it was critical that we subract the contribution of the PSF wings carefully. To do this, we constructed composite PSFs for each filter. We modelled the outer regions from several highly over-exposed images of stars taken from the HST archive, and the central regions from Tiny Tim models for the PC images, and from unsaturated archival stellar images for the STIS longpass image.
Given the potential inaccuracies in the STIS PSF extreme care was taken to account for its uncertainties. Deviations in the PSF arise from spatial variations, time variations, and spectral variations. The stars that were averaged to make our composite PSF have different spectral types, were taken at different times, and are offset from each other spatially on the detector (although are all still within 50 pixels of the target). Thus, the deviations observed between these PSFs should reflect the potential difference between our composite PSF and our data. The STIS ghost loop varies significantly even over small spacial offsets, and with the lack of exactly-positioned archival stars, a perfect model of this feature was not possible.
We define the uncertainty in each pixel of the composite PSF model to be the maximum difference among that pixel value and the corresponding pixels in the component stellar images. This gave a conservative uncertainty map that was used in the two-dimensional PSF and host galaxy fitting.
2.3 Host Galaxy Analysis
The deep STIS image was used to analyse the host galaxy. We first mask the regions of the arcs and the PSF ghost loop conservatively, including several pixels beyond their visible extent. We then use minimization to fit the best two-dimensional model. Models comprised either the PSF superimposed with a centered de Vaucouleurs galaxy model, the PSF with an exponential disk model, or the PSF alone.
The significance of the fit was determined by comparing for of the best-fit PSF + single component host galaxy model with for the best PSF-only fit via the F-test. To claim a host galaxy detection, we required that the host galaxy fit be preferred over the PSF-only fit at the 99% confidence level. We also required that the host galaxy fit be preferred over the PSF-only fit when the sky is over-subtracted to the limit of the estimated sky error, at the 95% confidence level.
A host galaxy appeared to be marginally detected in the initial fitting process, however it did not satisfy the conditions described above. The best PSF + de Vaucouleurs fit improved the PSF-only fit with marginal significance: 97.5% by the F-test. When the sky was over-subtracted, this improvement was reduced to 92% significance. Thus, the host galaxy is considered unresolved. The use of more complex modelling is unjustified given this lack of detection.
We calculated the upper limit on the host galaxy brightness by finding the most luminous host galaxy that could be added before the fit became worse than the PSF-only fit at the 99% confidence level. We assumed a de Vaucouleurs profile with an effective radius of 10 kpc. This is higher than the median of 6.35 kpc observed at low redshift, yielding more conservative limits (Urry et al., 2000). The F2850LP apparent magnitude upper limit was found to be 19.81 mag, not K-corrected or corrected for extinction. The absolute R-band upper limit is mag, assuming , corrected for galactic extinction with F2850LP band extinction of (interpolated from results of Schlegel, Finkbeiner & Davis 1998), and K-corrected and converted to Cousins R band assuming the spectrum of a burst model from the stellar population synthesis models of Bruzual & Charlot (1993) calibrated to early-type galaxy colours (; Fukugita, Shimasaku & Ichikawa 1995).
Figure 4 shows the azimuthally averaged profile of 1517+656 with the best-fit PSF. Figure 5 shows the original STIS image, and the image with the normalized PSF subracted. The PSF-subtracted image does not reveal obvious excess light that might be associated with the host galaxy. The arcs, however, are clearly not part of the PSF. Significant additional structure is revealed in the subtracted image.
2.4 Photometry
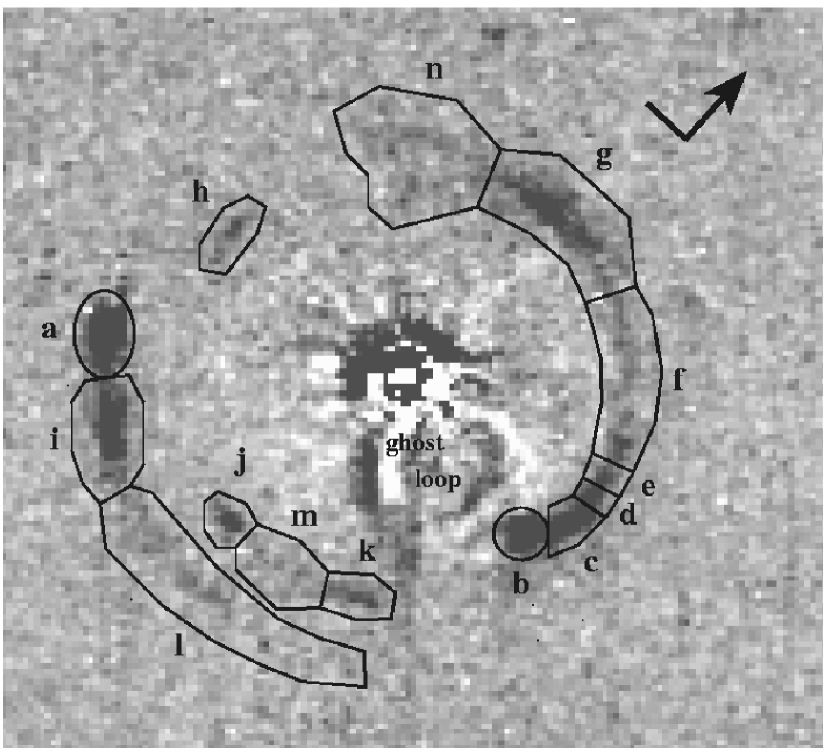
After subtracting the best-fit PSF from the image, aperture photometry was performed on the arcs and knots. The results are in Table 2. The labelling of the arcs and the apertures used are shown in Figure 6. Segments are divided according to both spatial separation and color differences. Apparent magnitudes are given for the knots a and b, and the errors in these values are 0.02 mag, dominated by uncertainty in the background subtraction, and affected also the uncertainty in the PSF subtraction. The surface brightness of the arcs vary strongly in the radial direction, and so their average values depend on the width of their apertures. The uncertainty in these surface brightnesses is mag, and includes both the uncertainty in the background and PSF subtraction, the variation in surface brightness across the extend of each arc segment.
Table 2 also gives the colors of each component. These are derived from color using and (WFPC2 Instrument Handbook). The error in the conversion from HST magnitudes to V and I is of order 1%. The variation in color across the region of each arc segment is smaller than the variation in surface brightness, and so the overall uncertainty in the arc colors is 0.1 mag. The uncertainty in the knot colors is mag.
3 Analysis and Discussion
3.1 Gravitational Lens, Intervening Spiral, or Colliding Galaxies?
The additional detail revealed in the STIS image all but completely rules out gravitational lensing as the explanation of the arcs of H1517+656. Certainly the structure could not result from a single extended source — the two longer arcs have distinctly different radii of curvature (see § 3.5). It is conceivable that a complex configuration of extended structures may be able to produce the observed structure. To test this, the image was analysed using Lensview (Wayth, 2004) — a program for deconvolving extended gravitational lenses based on the LensMEM algorithm of Wallington, Kochanek & Narayan (1996)
No background source configuration could be found that yielded the observed light distribution for any reasonable mass distribution of the lens system. The primary difficulty was in matching up opposing lens images, for example:
-
•
Unless the mass distribution of the lens is very complex, we expect every image to have a counter image that may differ in its transverse stretching, but should not differ in its radial stretching. The fact that component b is closer to the nucleus than the rest of northwest arc described by components c to g means that this structure is not the opposing image of the south filament (a to l), as this latter filament does not have a corresponding radial kink.
-
•
If component b does not correspond to component a, then the only other opposing structure is component h. These two components are almost equidistant from the (assumed) center of mass, and so should be of similar brightness to each other and exhibit more transverse sheer.
-
•
The structure at n is quite extended radially (although difficult to see in the printed image due to its extremely low surface brightness). The only possible counter-images for this component are m–k or l, and neither of these have similar radial extent.
Additionally, the spectral information gained with the F555W and F814W filters (Table 2) shows substantial color variation across the structures. In particular, the knots a and b are much bluer than many of the arc segments (c, e, f, h & i). Gravitational lens images from the same source have the same intrinsic spectrum, and hence the same intrinsic colors. Even if there were a sensible lens geometry by which the knots and arcs could be credibly associated with each other, they have the largest color differences, and so cannot be lensed images of the same source component. The observed difference in color could be due to differential reddening of some of the images due to dust in the lensing galaxy, but the chance alignment of the all bright lens images with dust-free regions, and the extended arcs with dust-thick regions is too coincidental to be credible.
The increased sensitivity granted by the STIS image also allows us to completely rule out a spiral galaxy as the explanation of the structure — either in the foreground or hosting the BL Lac. Although more arc fragments were revealed, these are clearly fragmented. They are not connected in spiral arms, nor do they extend to the central regions.
If the arcs are not gravitational lens images or an intervening spiral galaxy, then they are likely to be physically associated with the BL Lac object, and so probably result from a galaxy interaction. A number of types of interacting systems need to be considered; we may be looking at a ring galaxy, the limb-brightened shells of a shell galaxy, or the accreting material from a close interaction. Although the diameter of the ring structure is similar to that of some ring galaxies (e.g. The Cartwheel, with its 33 kpc radius ring), the multiple levels of concentric arcs (at least two different radii) in 1517+656 make this explanation unlikely. Limb-brightened shells are similarly unlikely: the presence of three bright knots (including component j) coincidentally situated on the very limbs of these shells is quite improbable. The most likely explanation is that the arcs are the accreting debris from a merger event or a close interaction in which material was stripped from the passing galaxy. Dynamical friction with the host galaxy may then have resulted in the debris settling into the observed near-circular arcs.
3.2 Modelling the Stellar Population
Assuming that the observed structure does result from a galaxy–galaxy interaction, bursts of recent star formation induced by this interaction should have an observable effect on the spectral energy distribution (SED). Indeed, the colors measured (Table 2) are of very blue populations. We can use stellar population synthesis models to reproduce the colors of the structure components, and so place contraints on their star formation history.
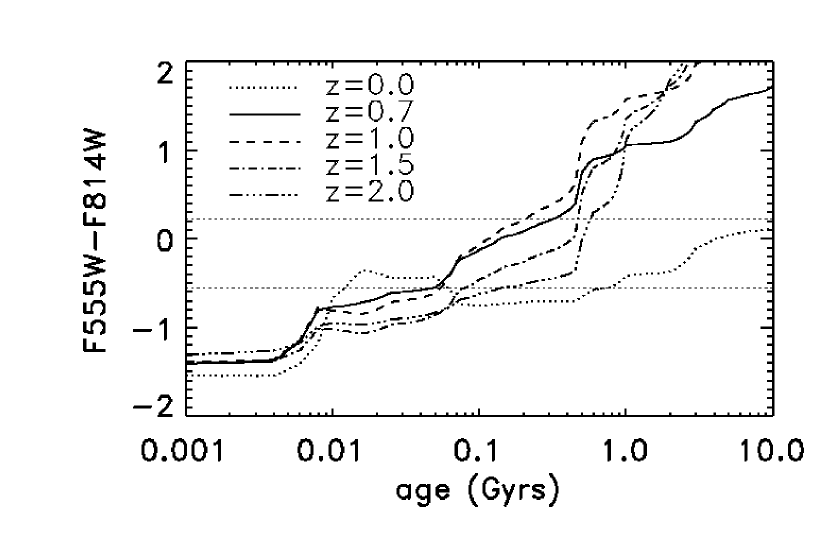
We used the GISSEL evolutionary synthesis code of Bruzual & Charlot (1993), with the Padova 2000 library of isochrones (Girardi et al., 2000), and the BaSeL standard stellar library (Lejeune, Cuisinier & Buser, 1997), extended to non-solar metallicities (Westera et al., 2002). The stellar populations were modelled as simple bursts of star formation. Synthetic SEDs were generated for a grid of population ages, from years to years, and for metallicities ranging from 0.02 solar to 1.5 solar. We probe to very low metallicities to determine whether metallicity alone can explain the blue colors, or whether young ages, as expected from an interacting system, are indeed required. We investigate a higher-than-solar metallicity to demonstrate that small changes in this direction have little effect on the ages. Significantly higher metallicities will result in even younger model populations fitting the data. The SEDs resulting from these models were then redshifted over the range and convolved with the HST transmission curves. In this way we obtained color as a function of age, redshift and metallicity.
The resulting function is, as expected, sensitive to age, but less so to redshift and metallicity. Figure 7a shows color as a function of age for redshifts to 2, for a solar metallicity population. Color increases roughly linearly with the log of age over the color range of interest, with the age of the structure falling between 0.04 and 0.57 Gyrs for all possible redshifts (). Figure 7b shows color as a function of age for a range of metallicities, assuming . Only the lowest metallicity modelled (0.01 solar) has an appreciable affect on the maximum age, increasing it by .
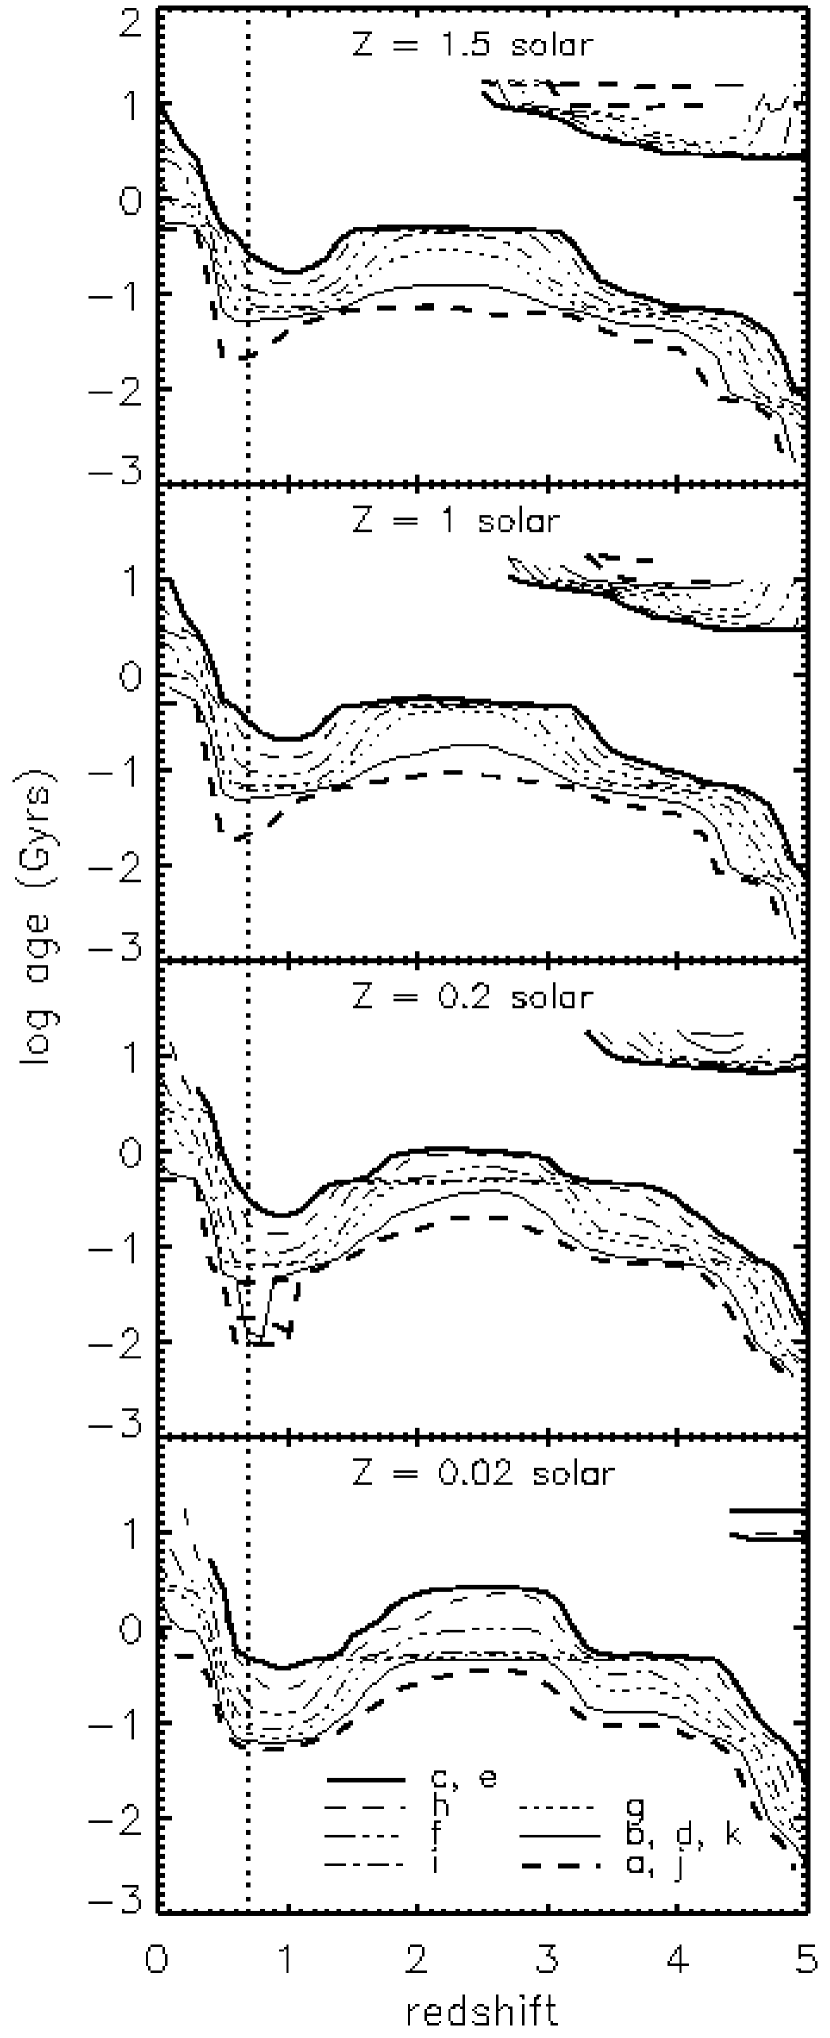
Figure 8 shows age of burst population with the colors of the structure surrounding H1517+656, as a function of redshift for four different metallicities. For from 1.5 to 0.2 solar, most of the components have Gyrs for , which covers the range of likely redshifts of the source. All components have Gyrs for . For extremely low metallicity (0.02 solar), the ages are still low, but are to the solar metallicity ages. The brightest, most compact structures appear the youngest. At , the knots a & j have a solar metallicity burst population age of 21 Myrs, and b & d have a burst age of 42 Myrs.
Particularly at high redshift (), burst populations with quite different ages may produce the same colors. However, at lower redshift, for the colors observed in the structures, any degenerate solutions all lie within a narrow range of ages.
Table 3 summarizes the ages found for the different components, assuming . The errors given in this table are derived from the 1 confidence limits in the colors. In some cases, the upper or lower limit of these colors had multiple solutions in the age–redshift relation. In these cases, the errors presented represent the full span of these degenerate solutions. Components l, m & n are not included as they are not detected in the F555W and F814W filters.
3.3 Dynamical Age Estimate
The ages derived above assume that all of the luminous mass in the arcs results from recent bursts of star formation. The true scenario is certain to be more complicated, and so these ages don’t directly give us the time since the interaction began. An independent estimate of the minimum time since the merger began can be made by calculating the time required for the material to spread over the circular extent of the arcs — 15 kpc in radius if — assuming orbital velocities.
Assuming that the host galaxy has a luminosity and morphology similar to low-redshift BL Lac host galaxies — mag and a bulge-dominated profile with kpc (Urry et al., 2000) — and a mass-to-light ratio of M⊙/L⊙ (Loewenstein & White, 1999), we obtain a mass of M⊙ within a 15 kpc radius. This gives a Keplerian velocity of km/s for the arcs. At this velocity, the material would have taken Gyrs to spread around the host galaxy. A shorter timescale is possible as the accreting material is expected to have been slowed by dynamical friction with the host galaxy. However, if this dynamical friction is also to explain the circularity of the arcs, then we expect that the debris has been settling for at least one orbit of of the host galaxy.
3.4 The Mass of the Arcs
Table 4 shows the luminous mass of a burst population required to produce the flux observed in the STIS image assuming z=0.702, solar metallicity, and the burst ages given in Table 3. For components l, m & n we assume the same color as component f, the most comparable extended, diffuse arc segment. The total mass, assuming that all of the observed luminosity comes from the recent starburst, is 2.17M⊙, for solar metallicity. This is an upper limit on the true burst population mass, as there is certain to be an underlying, older population.
If we assume this older population has a spectrum similar to a spiral galaxy (more likely than an early-type spectrum, as a significant amount of gas must have been present to fuel the observed star formation), then we can calculate the actual mass of the burst component required to reproduce the observed colors for a range of burst ages.
The underlying spectrum is derived by calibrating the GISSEL models to the colors of a Hubble type Scd galaxy (; Fukugita, Shimasaku & Ichikawa 1995). Table 4 gives the derived masses of both populations for burst ages of 0.001, 0.01 and 0.02 Gyrs. We limit the burst age to 0.02 Gyrs at the oldest because the colors of older burst populations are redder than many of the arc components, and to 0.001 Gyrs at the youngest because burst populations younger than this are not significantly bluer.
The total luminous mass of the arcs is remarkably high: at least M⊙, and perhaps up to M⊙.
3.5 The Plane of the Collision
If the observed arcs are really the remnants of a collision, their apparent circularity is remarkable. The northwest arc joining components c to g, in particular, appears to have highly circular curvature to the eye, while the southeast (a to l) and south arcs (j to k) show an increase in radius of curvature with increased distance from the assumed center of mass (the nucleus of the BL Lac).
The observed circularity could be the result of the chance projection of much more elliptical arc curvatures at a larger angle to the plane of the sky. However, if the arcs are in the same plane, this would require that the semi-major axes of the arcs all be aligned. While we expect the plane of each arc to be linked to the plane of the interaction, and hence to each other, the same is not true of their semi-major axes. The alignment of each arc axis is defined by the direction in which the stellar material was moving when it was thrown off during merger, or the direction in which its parent galaxy was moving when it was stripped. The northwest and southeast arcs are clearly distinct streams of material, well-separated and with different radii of curvature. It is expected that for any close interaction, as this one must have been, the trajectory of the incoming galaxy would change considerably over the course of the encounter. Thus there is no reason to expect two well-separated streams of accreting material to have high ellipticities and aligned axes. It could happen, but a naturally circular geometry, perhaps resulting from friction between the accreting material and the halo of the host galaxy, seems the simpler explanation.
Thus, assuming that the arcs are intrinsically circular, we can constrain their angle to the sky by fitting ellipses to each, and finding their maximum possible ellipticities. Ellipses were fitted to each of the three prominent arcs separately, allowing ellipticity, semi-major axis and position angle to vary freely, while fixing the ellipse center to the BL Lac nucleus. minimization was used, with each point on the arcs weighted inversely to the half-light width of the arc at that point. Table 5 shows radii of the three most prominent arcs along with the results of the ellipse fitting. If the arcs are intrinsically circular, then their maximum angle to the sky is for the well-constrained northwest arc and for the southeast arc, determined independently to each other (see Table 5).
This apparent alignment of the arcs to the plane of the sky is intriguing. The currently accepted model of the BL Lac central engine involves a relativistic jet with a small angle to the line of sight (Blandford & Rees, 1978), a model supported by their high polarisations, intra-day variability, asymmetries in brightness and polarisation, and unphysical brightness temperatures. If the jets of these objects are powered by the magnetic fields of rapidly-rotating black holes, then we expect that the angle of these jets is defined by the direction of spin of the black hole. If the black holes in radio-loud AGNs are spun up by the transfer of angular momentum during mergers, then we also expect there to be a correlation between the plane of the interaction and the angle of the resultant jet.
With H1517+656 we may be able to link the generation of an AGN jet with a merger event. This provides evidence that the physical processes that result in AGN jets are dependent on the plane of this interaction, and hence on the transfer of angular momentum in the interaction.
Regardless, this link between the geometry of the merger and the emission of the central engine indicates that the AGN activity observed in this source may have been triggered, or at least strongly influenced by the current interaction. The ages of the stellar populations are consistent with this hypothesis, as is the size of the arc structure if we account for the infall time of material into the AGN core. The extreme emission properties of this BL Lac, from radio to X-ray frequencies, also suggest that this source is in an unusual phase in its life.
4 Conclusions
The presence of unusual, ring-like structure surrounding the BL Lac object 1517+656 has been investigated with HST imaging. Observations in the STIS longpass filter have allowed us to better constrain the upper limit on the host galaxy’s brightness to , and to resolve the arcs in much greater detail. WFPC2 F555W and F814W observations have given us spectral information on the structure components.
Analysing the structure of the arcs with lens deconvolution software, we were able to determine that they are highly unlikely to be gravitational lens images from morphological arguments alone. However, the strongest argument against gravitational lensing is that the colors show strong variation between sections of the arcs that should correspond to the same source components.
Rather, these structures are likely to result from a close galaxy interaction or merger, and consist of stellar material and gas accreting onto the BL Lac host galaxy. This hypothesis is supported by the extremely blue colors observed in the arcs and knots. The colors indicate very young stellar populations, with ages less than 0.02 Gyrs in parts of the structure. From stellar population models, we a derive a luminous mass of between M⊙ and M⊙ for the structure. The high mass and the starburst colors of the accreting material indicate that the interaction was a violent one.
The apparent circularity of the arcs indicates that the plane of the collision, and hence accretion, is very close to the plane of the sky — within if the arcs are approximately circular. This is intriguing, as it would mean that the plane of the interaction is perpendicular to the jet, which is thought to be aligned with the line of sight in BL Lacs.
The link between the plane of the merger and the angle of the jet suggests that activity in H1517+656 may have been triggered, or at least strongly influenced, by this interaction. If so, then this is a direct example of the transfer of angular momentum in a merger resulting in the generation of a radio source. The extreme emission properties of the core supports the hypothesis that H1517+656 is a radio-loud AGN in its birth throes.
References
- Becker, White & Edwards (1991) Becker, R. H., White, R. L. & Edwards, A. L. 1991, ApJS, 75, 1
- Beckmann, Bade & Wucknitz (1999) Beckmann, V., Bade, N. & Wucknitz, O. 1999, A&A, 352, 395
- Blandford & Rees (1978) Blandford, R. D. & Rees, M. J. in Proc. Pittsburg Conf. on BL Lac Objects, ed. A. N. Wolfe, p. 328
- Brinkmann & Siebert (1994) Brinkmann, W. & Siebert, J. 1994, A&A, 285, 812
- Bruzual & Charlot (1993) Bruzual, G. & Charlot, S. 1993 ApJ 405, 538
- Elvis et al. (1992) Elvis, M., Plummer, D., Schachter, J., & Fabbiano, G. 1992, ApJS, 80, 257
- Fukugita, Shimasaku & Ichikawa (1995) Fukugita, M., Shimasaku, K. & Ichikawa, T. 1995, PASP, 107, 945
- Girardi et al. (2000) Girardi, L., Bressan, A., Bertelli, G. & Chiosi, C. 2000, A&AS, 141, 371.
- Kollgaard et al. (1996) Kollgaard, R. I., Palma, C., Laurent-Muehleisen, S. A., & Feigelson, E. D. 1996 ApJ 465, 115
- Krist & Hook (2001) Krist, J. & Hook, R. 2001 The Tiny Tim User’s Guide, v. 6.0, pg.19
- Lejeune, Cuisinier & Buser (1997) Lejeune, Th., Cuisinier, F., & Buser, R. 1997, A&AS, 125, 229
- Loewenstein & White (1999) Loewenstein, M., White, R. E., III 1999, ApJ, 518, 50
- O’Dowd, Urry & Scarpa (2002) O’Dowd, M., Urry, C. M., & Scarpa, R. 2002 ApJ 580, 96
- Scarpa et al. (1999) Scarpa, R., Urry, C. M., Falomo, R., Pesce, J. E., Webster, R., O’Dowd, M., & Treves, A. 1999 ApJ 521, 134
- Scarpa et al. (2000) Scarpa, R., Urry, C. M., Falomo, R., Pesce, J. & Treves, A. 2000 ApJ 532, 740
- Schlegel, Finkbeiner & Davis (1998) Schlegel, D. J., Finkbeiner, D. P., & Davis, M. 1998 ApJ 500, 525
- Struble & Rood (1999) Struble, M. F. & Rood, H. J. 1999, ApJS, 125, 35
- Urry & Padovani (1995) Urry, C. M. & Padovani, P. 1995, PASP 107, 803
- Urry et al. (2000) Urry, C. M., Scarpa, R., O’Dowd, M., et al. 2000, ApJ 532, 816
- Wallington, Kochanek & Narayan (1996) Wallington, S., Kochanek, C. S., & Narayan, R. 1996 ApJ 465, 64
- Westera et al. (2002) Westera, P., Lejeune, T., Buser, R., Cuisinier, F. & Bruzual, G. 2002, A&A, 381, 524
- Wayth (2004) Wayth R. B. 2004, PASP, submitted
| Detector | Filter | Exposure Time (s) |
|---|---|---|
| STIS | F2850LP | 2250 |
| PC2 | F555W | 2460 |
| PC2 | F814W | 3050 |
| Apparent Magnitude: | ||||
| Knot | F2850LP | F555 | F814W | V–I |
| a | 23.62 | 23.37 | 24.03 | 0.56 |
| b | 24.19 | 23.73 | 24.30 | 0.65 |
| Surface Brightness: | ||||
| Arc | F2850LP | F555 | F814W | V–I |
| c | 22.40 | 22.72 | 22.50 | 1.44 |
| d | 22.44 | 22.25 | 22.80 | 0.67 |
| e | 23.11 | 23.06 | 22.88 | 1.40 |
| f | 24.13 | 23.77 | 23.90 | 1.09 |
| g | 22.46 | 22.80 | 23.14 | 0.88 |
| h | 23.99 | 23.80 | 23.74 | 1.28 |
| i | 21.00 | 22.83 | 23.06 | 0.99 |
| j | 23.24 | 22.49 | 22.98 | 0.73 |
| k | 21.32 | 22.99 | 24.12 | 0.09 |
| l | 24.34 | |||
| m | 24.45 | |||
| n | 24.41 | |||
Note. — The errors in the apparent magnitudes of the knots are mag and in the surface brightnesses of the arcs are mag (includes variation in surface brightness across each arc region). The errors in the colors of the knots are and in the arcs are . This latter error is lower than the individual surface brightness errors because the variation in color across the region of each arc segment is less than the variation in surface brightness. Components l, m &n were only resolved in the STIS image.
| Comp- | F555W | Age (Myrs), for metallicity: | |||
|---|---|---|---|---|---|
| onent | F814W | 1.5 solar | 1 solar | 0.2 solar | 0.02 solar |
| a | -0.66 | 20 | 20 | 40 | 55 |
| b | -0.57 | 45 | 40 | 46 | 60 |
| c | 0.22 | 265 | 315 | 315 | 470 |
| d | -0.55 | 50 | 50 | 45 | 65 |
| e | 0.18 | 240 | 275 | 260 | 460 |
| f | -0.14 | 110 | 95 | 90 | 150 |
| g | -0.41 | 65 | 60 | 60 | 75 |
| h | 0.066 | 175 | 185 | 175 | 340 |
| i | -0.31 | 75 | 70 | 65 | 95 |
| j | -0.66 | 20 | 20 | 40 | 55 |
| k | -0.57 | 45 | 40 | 45 | 60 |
| Comp- | burst only | Sb + 0.001 | Sb + 0.01 | Sb + 0.02 | |||||||||
| onent | () | () | () | () | |||||||||
| a | 436.0 | 6385 | 37.9 | 3550 | 61.6 | 3100 | 127.1 | ||||||
| b | 16.6 | 2015 | 2.4 | 1830 | 4.0 | 1810 | 82.5 | ||||||
| c | 16.9 | 1095 | 9.1 | 411 | 14.7 | 327 | 30.7 | ||||||
| d | 155.0 | 571 | 4.7 | 215 | 7.7 | 171 | 16.0 | ||||||
| e | 329.0 | 3950 | 12.3 | 3030 | 19.8 | 2915 | 41.2 | ||||||
| f | 76.8 | 1360 | 12.1 | 452 | 19.6 | 340 | 40.7 | ||||||
| g | 364.0 | 5225 | 24.5 | 3385 | 39.7 | 3160 | 82.5 | ||||||
| h | 193.0 | 1755 | 3.3 | 1505 | 5.4 | 1475 | 11.2 | ||||||
| i | 34.8 | 853 | 9.7 | 124 | 15.7 | 34 | 32.5 | ||||||
| j | 281.0 | 6895 | 78.5 | 1005 | 27.1 | 277 | 263.3 | ||||||
| k | 277.0 | 4735 | 41.4 | 1635 | 67.2 | 1250 | 139.0 | ||||||
| l | 35.4 | 626 | 5.5 | 208 | 9.0 | 156 | 18.7 | ||||||
| m | 25.9 | 458 | 4.1 | 152 | 6.6 | 114 | 13.7 | ||||||
| n | 69.7 | 1235 | 11.0 | 410 | 17.8 | 308 | 37.0 | ||||||
| Total | |||||||||||||
| Mass: | 2.17 | 37.2 | 0.256 | 17.8 | 0.40 | 15.5 | 0.859 | ||||||
| (M⊙) | |||||||||||||
| Arc | Radius (kpc) | Ellipticity | Sky Angle |
|---|---|---|---|
| northwest | 0.034 | 15∘ | |
| southeast | 0.043 | 17∘ | |
| south | 0.083 | 24∘ |
Note. — The (burst only) column assumes that the entire luminous mass of each structure component is from a single burst population, with age indicated by its colors (see Table 3). The following three columns give the masses assuming an underlying redder population with the spectrum of an Sb spiral galaxy superimposed with a fractional burst population, with ages 0.001, 0.01 and 0.02 Gyrs