The Zone of Avoidance: Optical Compared to Near-Infrared Searches
Abstract
Galaxies uncovered in the Zone of Avoidance (ZOA) with deep optical searches are compared to the distribution of objects in the 2MASS Extended Source Catalog (2MASX). While the galaxy density of optical surveys is strongly correlated to the dust content, and become ineffective in uncovering the galaxy distribution at , this effect is much less severe in the NIR. Galaxies can be identified in 2MASS at optical extinction layers of over . However, star density has been found to be the dominant limiting factor in the NIR in the wider Galactic Bulge region (see Fig. 4) where optical surveys still do quite well.
Systematic positional offsets have also been found between objects in the 2MASX and the optical ZOA as well as other galaxy catalogs. These seem to have their origin in the astrometric reference frame used by these surveys as well as different fitting algorithms when determining positions (details are given in the Appendix). The astrometric offsets between 2MASX and more recent galaxy catalogs (or on the Digitized Sky Survey remeasured positions) are of the order of , comparable to the relative dispersion in positions between these surveys. Still, it is advisable to take this effect into account when combining galaxies from different catalogs for observational purposes.
Depto. de Astronomía, Universidad de Guanajuato, Apdo. Postal 144, Guanajuato, GTO 36000, México
Infrared Processing and Analysis Center, MS 100-22, California Institute of Technology, Pasadena, CA 91125
1. ZOA Coverage
With the final release of the 2MASS Extended Source Catalog (2MASX) by the Two Micron All Sky Survey Team in 2003 (Jarrett et al. 2000b) with over 1.6 million spatially resolved objects, it is now possible to study the performance of 2MASS in mapping the extragalactic large-scale structures across the ZOA, as well as compare and cross-correlate the 2MASS galaxy distribution with the deep optical ZOA catalogs.
In 2000, Kraan-Korteweg & Lahav summarize that deep optical surveys have reduced the optical ZOA from extinction levels of to – a reduction of about 2.5. Except for that remaining delimiting gap, which runs parallel along the Galactic Plane at mostly constant width, this results in a whole-sky galaxy map complete to extinction-corrected diameters of (see their Fig. 5).
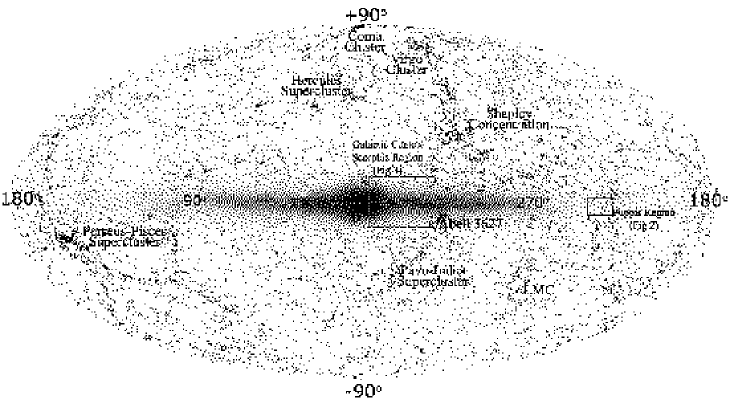
2MASX provides a much deeper and uniform view of the whole extragalactic with its 1.6 million resolved galaxies (see Fig. 1) and an estimated 3 to 5 million unresolved galaxies in the 2MASS Point Source Catalog (PSC). Whereas the galaxy distribution can be traced without hardly any hindrance in the Galactic Anticenter, the Galactic Bulge – represented here by the half billion Galactic stars from the PSC – continues to hide a part of the extragalactic sky.
The optical and the NIR Zone of Avoidances are not the same. A closer inspection of both will help to characterize their respective limitations of uncovering the galaxy distribution behind the Milky Way. By studying the respective magnitude completeness limits, colors and surface brightness as a function of extinction (or star density – see Sect. 2), we hope, amongst others, to optimize redshift follow-up observations and probe through the Galaxy as deep as possible.
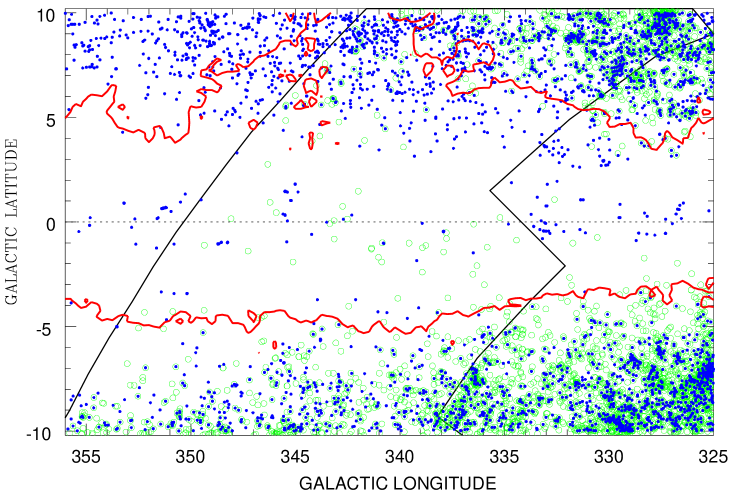
A reduction of the ZOA on the sky does not imply at all that a similar reduction can be attained in redshift space. This is seen quite clearly in Fig. 2 which shows 2MASS galaxies in Puppis – a filament is crossing the Plane there (see Fig. 1) – on a sequence of 6-degree fields (6dF) centered on Dec . This strip has been observed with the multifibre spectroscope at the UK Schmidt Telescope as part of a pilot project aimed at extending the 6dF Galaxy Survey (see http://www.mso.anu.edu.au/6dFGS for further details) towards lower latitudes (it now is restricted to the southern sky with ).
The crosses mark galaxies for which a reliable redshift could be measured, the filled dots galaxies for which this could not be realized. At first glance, the plot seems to indicate a fantastic success rate for obtaining redshifts all the way across the Milky Way. However, it should be noted that the concerned ZOA strip lies in a region reknown for its low dust content (it hardly exceeds 3 magnitudes), and a careful inspection indicates that redshifts have generally not been obtained for (thick contour). So even when galaxies are identifiable deep in the Plane, reducing the redshift ZOA will remain hard, and an optimization of targeted ZOA galaxies is crucial for redshift follow-ups.
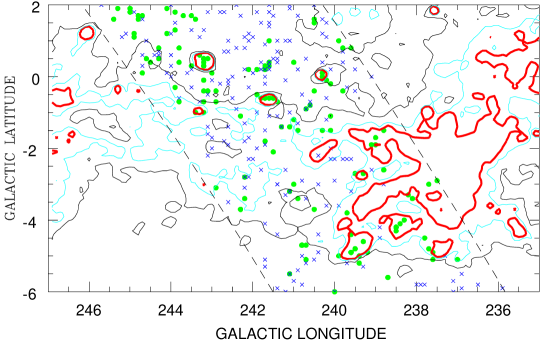
With the preparation for publication of the fourth of our deep optical galaxy surveys in Scorpius (Fairall & Kraan-Korteweg, in prep.; see Fairall & Kraan-Korteweg 2000 for preliminary results), we compared the optical galaxy distribution with 2MASX objects in the Scorpius region (in Fig. 1 this regions lies just to the right of the Galactic Center, where confusion from the foreground Milky Way is extreme). Both the optical and 2MASS galaxy distributions are displayed in more detail in Fig. 3. There the large circles represent optically detected galaxies in Scorpius and in the adjacent Great Attractor (GA) region (Woudt & Kraan-Korteweg 2001). The small dots represent the 2MASX objects with , the completeness limit at high Galactic latitudes, excluding extremely blue objects with which are merged star images (Jarrett et al. 2000a). It should be noted that this plot represents all the objects of 2MASX, hence also contains a relatively small number of Galactic extended objects such as HII regions and planetary nebulae, the prime contaminant at (optical catalogs also contain a small fraction of them). The 30 optical extinction contour is also drawn, i.e. the level to which deep optical surveys are fair tracers of the galaxy distribution (Kraan-Korteweg 2000; Kraan-Korteweg & Lahav 2000).
At positive latitudes, an analysis of the distribution confirms that deep optical searches are faithful tracers of the galaxy distribution to with only a few galaxy candidates peaking through higher dust levels, whereas the 2MASX sources seem to probe deeper into the Milky Way. However, at negative Galactic latitudes this trend is not as clear cut. There it appears that more optical galaxies are found than 2MASS galaxies and that the optical searches find galaxies closer to the Plane than the 2MASS catalog of resolved objects (Jarrett et al. 2000a), an effect also seen in the adjacent GA region. A direct correlation between dust absorption and 2MASX source density is not seen here.
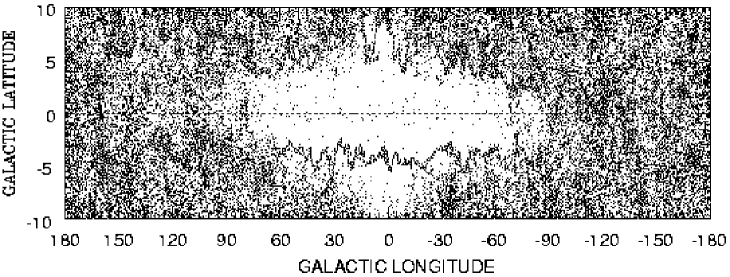
This can be verified in Fig. 4 where the extinction contour of is superimposed on the distribution of 2MASX sources for the whole Milky Way (). It is undeniable that extinction and source density are not directly related. In the Galactic Anticenter (AC), roughly defined as here, 2MASX objects seem to cross the Plane without any hindrance (see the allsky plots from Jarrett 2004). In fact, in plots of NIR magnitude or diameter versus (not shown here), it is clear that galaxies can be easily identified up to extinction levels equivalent to , whereas in plots of -band magnitudes versus imply that 2MASS remains quite complete up to for . This is not at all true for the wider Galactic Bulge (GB) region, where 2MASS uncovers objects to much lower extinction levels and is at least one magnitude less deep compared to the AC.
The obvious culprit here is the star density which increases strongly towards the Galactic Center. This progressive loss of galaxies towards the GB is already noticeable when simply comparing the fraction of galaxies that have 2MASS counterparts in the optical catalogs, which decreases from 47% in the Hydra/Antlia (H/A) region (Kraan-Korteweg 2000), to 39% in Crux, 37% in the GA (Woudt & Kraan-Korteweg) and 33% in the Scorpius region (Fairall & Kraan-Korteweg, in prep.). In fact a near perfect imprint of the Galactic Bulge is given in Fig. 4 by the lack of objects in this area.
A comparison of the optical and 2MASS galaxies over the whole region of the four deep optical catalogs () finds the optical galaxian distribution denser and more clumped. In a comparison of magnitude, diameter and colors versus extinction of the galaxies common to both the optical and NIR catalogs, it is obvious that the optical surveys miss galaxies with for and at 4 magnitudes of extinction become incomplete for galaxies, which is quite consistent with the findings in Kraan-Korteweg 2000, and Woudt & Kraan-Korteweg 2001. As expected the majority of the 2MASS galaxies not recovered in the optical searches are redder and faint (mostly with ). This is partly a ZOA effect with NIR surveys finding red galaxies more readily at higher absorption level. But it is also due to the inherent characteristics of the two surveys. Whereas the NIR is better at detecting old galaxies and ellipticals, the optical surveys – although susceptible to all galaxy types – are best at finding spirals and late-type galaxies (especially LSB galaxies and dwarfs). The surveys are in fact complementary.
These results suggest that an optimal approach to unveiling the mask of the Milky Way, revealing the background galaxy distribution, is to combine deep optical surveys with those of the near-infrared. The former are sensitive to galaxies located behind regions of high source confusion, and the latter aresensitive to galaxies located behind thick dust walls.
2. Systematical Positional Differences
While preparing a field in the ZOA in Scorpius for observations with the 6dF multifibre spectroscope at the UK Schmidt Telescope, optical and 2MASS galaxy samples were combined. It was then noted by W. Saunders (priv. comm.) that the optical positions had a systematic shift in RA of approximately compared to the 2MASS positions. The latter are based on the intensity-weighted centroid of the combined co-added image and are of high accuracy (; Jarrett et al. 2000b), whereas the optical positions for the Scorpius galaxies were measured on the 2nd Generation Digitized Sky Survey images (DSS2) by centering the cursor by eye on the galaxy (Fairall & Kraan-Korteweg, in prep.). So we did expect a scatter of the order of about , but a systematic offset of that order seemed inexplicable.
We first investigated this in further detail for the Scorpius region itself (see left panel of Fig. 5). For the 463 (33%) galaxies in common in the Scorpius region, the mean shift in Right Ascension could indeed be verified and quantified at , with a smaller offset in Declination, .
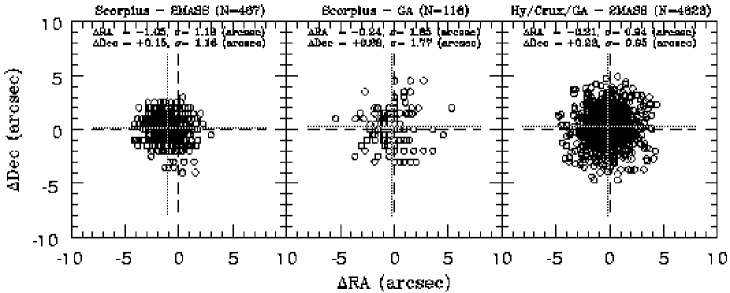
Not understanding this offset, we then compared the positions of Scorpius galaxies in common with the GA in their overlap region (N=116). The latter were measured directly from the ESO/SERC IIIaJ film copies with the Optronics high precision measuring machine of ESO (Woudt & Kraan-Korteweg 2001) and proven to have an accuracy of (Kraan-Korteweg 2000). The Scorpius shift could not be recovered. The dispersion is quite large here (middle panel of Fig. 5). Considering that overlap galaxies are always located on the edges of the sky survey plates, and thus have the largest errors, this is not surprising.
As a further resort in unraveling the origins of these systematics, we then plotted the differences in position of all the galaxies in the combined ZOA catalogs H/A, Crux, and GA – all measured with Optronics – versus their 2MASS counterparts (right panel of Fig. 5). Contrary to expectations, the mean offset was found to be small (, ), and of the same order as the Scorpius/GA comparison.
A logical connection between these three discrepant results could only be made when the positional differences and were plotted as a function of RA and Dec. As Fig. 6 illustrates, a dependence of the RA-offset as a function of RA exists (). This trend, defined by the H/A, Crux and GA galaxy positions is followed to the dot by the Scorpius galaxies. The linear relation explains the offset of about since it corresponds to the mean of the RA-range of the Scorpius galaxies ( to ).
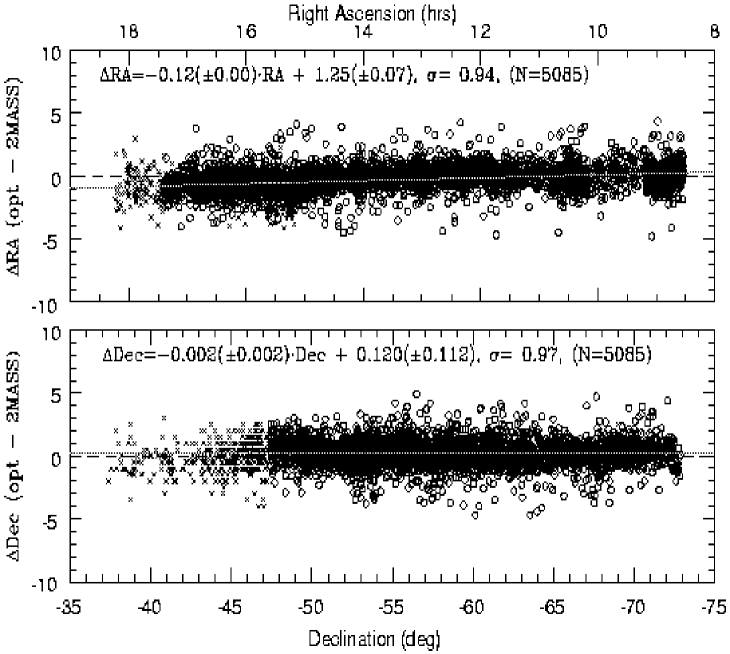
In Declination there is no significant trend. The mean offset of all 5085 common ZOA galaxies is .
This does not, however, explain the origin of the offsets between 2MASX, the optical ZOA catalogs and DSS. In order to find whether other galaxy catalogs show similar offsets and trends, we investigated this in further detail using the 2MASS extended sources of the Winter 1999 public data release by Jarrett. The details of this analysis are given in the Appendix. It suffices to summarize here that clear deviations have also been found between 2MASS and other optical galaxy positions. They vary from one catalog to another, and all show displacements between the northern and southern hemispheres (see Fig. 7). At the root of these systematics lie the different astrometric reference frames with which the galaxy catalogs are calibrated (see Table 1). Many rely on, or are tied to, old star catalogs which in addition are valid for different sections of the sky. The second source of the discrepancies have their origin in the digitization of sky surveys. Many modern galaxy catalogs list positions that are linked to star catalogs that were made from digitized sky surveys (such as the Guide Star Catalog, GSC; Lasker et al. 1990) and/or are determined on digitized sky images. Here the fitting algorithms as well as the pixel size of the digitization determine the zeropoints of the catalogs and limit the accuracy with which positions can be derived.
3. Discussion
3.1. Penetration of the ZOA
With regard to penetrating the ZOA, optical galaxy catalogs are mainly limited by Galactic extinction. The deep ZOA searches have reduced the optical ZOA considerably, but become increasingly ineffective at extinction levels of over (see Kraan-Korteweg & Lahav 2000).
In the NIR, with (), dust obscuration is a much weaker effect. In plots of diameter or NIR magnitudes versus , the effect of absorption becomes less stringent as one moves to redder wavebands. However, a strong delimiting factor in ZOA-penetration in the NIR is the star density. As shown with Fig. 4, 2MASS does not uncover galaxies at low Galactic latitudes in the Galactic Bulge region (), an effect completely uncorrelated with extinction, but is due to star crowding and the underlying stellar confusion noise (an effect that is amplified by the relatively large () point spread function of the 2MASS survey).
This fact is confirmed when plotting extinction-corrected -band magnitudes versus for the Galactic Bulge (GB) and Anticenter (AC) region. Whereas 2MASS remains quite complete for up to extinction levels of in the AC, it does not uncover galaxies to that extinction level in the GB and seems overall less deep (at least one magnitude) compared to the AC.
Deep optical ZOA galaxy searches thus are actually very useful in the GB region as they can uncover galaxies to lower extinction levels and higher star density levels than 2MASS. It should be maintained, however, that for the remaining ZOA – respectively the whole sky – 2MASS as a homogeneous whole-sky survey obviously is far superior, particularly considering that the optical ZOA catalogs were not only performed on different plate material, but also by different searchers using different search techniques.
3.2. Positional Accuracy
A careful comparison of 2MASS positions with various other catalogs reveal systematic differences, which differ between the northern and southern hemisphere as well as from one catalog to another. The offsets and trends seem to have its origin in the different astrometric reference frames as well as the software routines with which positions were determined.
A dependence in offset as a function of position, as seen for the ZOA optical catalogs (H/A, Crux, GA and Scorpius, see Fig. 6) has not been seen in other catalogs. Then again, the galaxies and sky coverage here explored did extend over a limited RA and Dec ranges (). They did not include the RA range where this effect becomes significant (). Hence it remains unclear whether this dependence is inherent to other optical catalogs as well. This certainly merits further investigation.
One might argue that future catalogs should all standardize their positions to the Tycho/Hipparcos reference frame (or the highly accurate 2MASS and FIRST positions) to avoid such systematical offsets. However, as long as DSS images (first or second generation) are used for position measurements or multiwavelength sky overlays, these offsets will not disappear, because this survey material is tied to the old astrometric star catalogs. Moreover, the will remain of the order of because of the pixel size of the DSS.
The systematic differences that exist between more modern catalogs are on average small (of the order of ) and should not cause problems except when doing precision spectroscopy. However, care should be taken when different catalogs are combined for instance for multi-object fibre spectroscopy. If the fibers intercept only small areas on the sky, the systematic offsets between catalogs may lead to un-optimized positioning of the fibres on the galaxy, reducing the expected or required signal-to-noise ratio or missing a small galaxy altogether.
Acknowledgments.
We kindly thank Baerbel Koribalski for her helpful suggestions. This research has made use of the NASA/IPAC Infrared Science Archive (2MASS) and the NASA/IPAC Extragalactic Database (NED), which are operated by the Jet Propulsion Laboratory, California Institute of Technology, under contract with the National Aeronautics and Space Administration. RCKK thanks CONACyT for their support (research grant 40094F) and the Australian Telescope National Facility (CSIRO) for their hospitality during her sabbatical.
References
Abell, G.O. 1958, ApJS, 3, 211
Abell, G.O., Corwin, H.G.Jr., & Olowin, R.P. 1989, ApJS, 70, 1 [ABELL]
Becker, R.H., White, R.L., & Helfand, D.J. 1995, ApJ, 450, 559 [FIRST]
Corwin, H.G.Jr., Pesenson, I. , Schmitz, M., Kim, D.-C., et al. 1998, PASP, 110, 779
Deutsch, E.W. 1990, AJ, 118, 1882
Dreyer, J.L.E. 1888, Mem. Mon. R.A.S. 49, 1 [NGC]
ESA 1997, The Hipparcos and Tycho Catalogues (ESA SP-1200), (Noordwijk: EAS)
Fairall, A.P., & Kraan-Korteweg, R.C. 2000, in ASP Conf. Ser. Vol. 218, Mapping the Hidden Universe, eds. R.C. Kraan-Korteweg, P.A. Henning & H. Andernach, (San Francisco: ASP), 35
Fairall, A.P., & Kraan-Korteweg, R.C. in prep. [Scorpius]
Høg, E., & Heide, J. van der 1976, Abh. der Hamburger Sternwarte, Band IX (Hamburg: Sternwarte) [Perth]
Jarrett, T.-H. 2004, PASA, in press
Jarrett, T.-H., Chester, T., Cutri, R., Schneider, S., Rosenberg, J., Huchra, J.P., & Mader, J. 2000a, AJ, 120, 298
Jarrett, T.-H., Chester, T., Cutri, R., Schneider, S., Skrutskie, M., & Huchra, J.P. 2000b, AJ, 119, 2498 [2MASX]
Joint IRAS Science Working Group: 1988, IRAS Point Source Catalog, Version 2 (Washington: US Govt. Printing Office) [IRAS]
Klemola, A.R., Jones, B.F., & Hanson, R.B. 1987, AJ, 94, 501 [NPM1G]
Kraan-Korteweg, R.C. 2000, A&AS, 141, 123 [Hy/Ant]
Kraan-Korteweg, R.C., & Lahav, O. 2000, A&ARv, 10, 211
Lasker, B.M., Sturch, C.R., McLean, B.J., Russell, J.L., Jenkner, H., & Shara, M.M. 1990, AJ, 99, 2019
Maddox, S.J., Sutherland, W.J., Efstathiou, G., & Loveday, J. 1990, MNRAS, 243, 692 [APMUKS]
Odewahn, S.C., & Aldering, G. 1995, AJ, 110, 2009 [NGP9]
Roeser, S., & Bastian, U., 1993, The final PPM Star Catalogue for both hemispheres, Bull. Inform. CDS, 42, 11 [PPM]
SAO 1966, Smithsonian Astrophysical Observatory Star Catalog, (Washington DC: Smithsonian Institution) [SAOC]
Schlegel, D.J., Finkbeiner, D.P., & Davis M. 1998, ApJ, 500, 525
Shectman, S.A., Landy, S.D., Oemler, A., Tucker, D.L., Lin, H., Kirshner, R.P., & Schecter, P. 1996, ApJ, 470, 172 [LCRS]
Stoy, R.H. 1966, Ann. Cape Obs. XXI [CPC]
Stoy, R.H. 1968, Ann. Cape Obs. XXII [CPC]
Véron-Cetty, M.-P., & Véron, P. 1996, A&AS, 115, 97
Vorontsov-Velyaminov, B., Archipova, V.P., & Krasnogorskaja, A. 1962-1974, Morphological Catalogue of Galaxies, Vol. I-V (Moscow: Moscow State University) [MCG]
Woudt, P.A., & Kraan-Korteweg, R.C. 2001, A&A, 380, 441 [Crux & GA]
Zwicky, F., Herzog, E., Kowal, C.T., Wild, P. & Karpowicz, M. 1961-1968, Catalogue of Galaxies and Clusters of Galaxies I - VI, (Pasadena: CalTech) [CGCG]
Appendix
NED versus 2MASS Positions
The 2MASS extended sources of the Winter 1999 public data release by Jarrett (see http://spider.ipac.caltech.edu/staff/jarrett/2mass/XSC/astrometry) were used to research the possible systematics of positional offsets. As before the galaxies were divided into northern and southern hemisphere, including only those galaxies for which the NASA Extragalactic Database (NED) reported accurate coordinate positions (uncertainty major axis ). The galaxies all lie within Right Ascension range of .
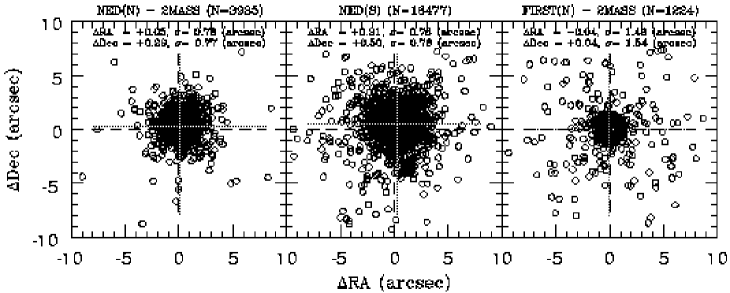
In the north, this led to 3935 counterparts that are classified in NED as galaxy (G) or infrared source (IrS). As shown in the left panel of Fig. 7 the mean offsets with and are small.
The result is based on a mixture of over a dozen galaxy catalogs, many of which not only show discrepancies from one catalog to the next but also shifts or large dispersions within the catalogs themselves. The Abell cluster galaxies (Abell 1958, Abell Corwin, & Olowin, 1989), for instance, display mean displacements of up to between different clusters. Excluding these catalogs does not really alter the mean result for the north though. The mean shift of all of them together is the same as for two dominant catalogs, i.e. the Lick Northern Proper Motion Galaxy Catalog (NPM1G; Klemola, Jones, & Hanson 1987), and the North Galactic Pole Survey (NGP9; Odewahn & Aldering, 1995), both of which have consistent shifts (Table 1).
In the south, the number of 2MASX coincidences is considerably higher, mainly due to the overlap with the APM galaxy catalog (APMUKS; Maddox et al. 1990) and the Las Campanas Redshift Survey (LCRS; Shectman et al. 1996) with 8189 and 6051 galaxies each. It is obvious from Fig. 7 that the positional offsets with , , are distinctly larger compared to the north. There exists some variation from one galaxy catalog to the next (and even from one LCRS Declination strip to the next) but the offsets in the south all are consistently higher than in the north, independent of how we subdivide the sample (see also Table 1). This is substantiated when comparing northern and southern galaxies within individual catalogs such as the NGC (Dreyer 1888), MGC (Vorontsov-Velyaminov, Archipova, & Krasnogorskaja 1962-1975), IRAS (IRAS PSC; Joint IRAS Science Working Group 1988) or the Zwicky et al. (1961-1968) CGCG galaxies. In all of them, the discrepancy between north and south persists. This can also be seen in Table 1 for the more recent NPM1G galaxies ( in the north vs. in the south and vs. 068 respectively).
The dependency of the offset as a function of RA (Fig. 6) is not detected in any of the NED subsamples (except for the lower accuracy positions LCRS galaxies; there the trend is even stronger than for the ZOA galaxies). Then again the shift for the ZOA galaxies becomes significant only at the higher RA range (RA). Indeed, the ZOA galaxies would not have revealed this dependency if the study would have been restricted to .
The only good agreement without any systematics could be seen in a comparison of 2MASX objects with radiosources from the FIRST Survey (Becker, White, & Helfand 1995). As illustrated in the right panel of Fig. 7, the mean offsets are insignificant. This result was confirmed in August 2002 with the then available 23,000 matches between 2MASS and FIRST within a 5′′ radius (http://spider.ipac.caltech.edu/staff/jarrett/2mass/XSC/jarrett_FIRST.htm).
Origin of Deviations
No differences between 2MASS positions and radio positions exist, while clear deviations occur between 2MASS and optical galaxy positions. They may vary from one catalog to another, and all systematically show shifts between the northern and southern hemispheres. What lies at the origin of these discrepancies? The culprit seems to be the astrometric reference frames.
FIRST claims positional accuracy at the 90% confidence level of . Its positions are linked to the VLB reference frame and should have absolute astrometric offsets of (Becker et al. 1995). The 2MASX intensity weighted centroid positions from the combined images are claimed to have an estimated uncertainty of (Jarrett et al. 2000b) and are tied to the Tycho Catalog (ESA 1997). According to Høg et al. (1997) the latter conform to the ICRS (International Celestial Reference System) to better than 1 mas with median astrometric errors of about 25 mas. The correspondence between two catalogs confirm their high accurate absolute astrometry.
| hemisphere | catalog | N | astrometric | ||||
| (′′) | (′′) | (′′) | (′′) | ref. frame | |||
| north (opt) | various | 3935 | 0.05 | 0.76 | 0.29 | 0.77 | various |
| NGP9 | 344 | 0.00 | 1.05 | 0.29 | 0.87 | AGK3+ | |
| NPM1G | 1426 | 0.05 | 0.34 | 0.28 | 0.35 | AGK3 | |
| south (opt.) | various | 16477 | 0.31 | 0.76 | 0.50 | 0.76 | various |
| APMUKS | 8196 | 0.34 | 0.83 | 0.57 | 0.64 | Perth 70 | |
| NPM1G | 1222 | 0.41 | 0.66 | 0.68 | 0.64 | Perth 70 | |
| LCRS | 6051 | 0.37 | 0.61 | 0.48 | 0.60 | GSC | |
| H/A-Crux-GA | 4623 | -0.24 | 0.94 | 0.28 | 0.95 | PPM | |
| only | 1714 | 0.05 | 0.90 | 0.21 | 0.98 | PPM | |
| FKK | 463 | -1.05 | 1.18 | 0.15 | 1.16 | DSS2 | |
| north (radio) | FIRST | 1224 | -0.04 | 1.45 | 0.04 | 1.54 | VLA |
AGK3+: AGK plus secondary stars
The systematic deviations found between 2MASX and other optical catalogs must thus have the root in their astrometry. In order to verify that, we had a look at the astrometry reference frames of the comparisons presented here (see last column in Table 1). These are:
| AGK3 | Heckman et al. 1975 | |
|---|---|---|
| SAOC | SAO 1966 | |
| CPC | Stoy 1966, 1968 | |
| Perth 70 | south | Høg & van der Heide 1976 |
| PPM | all-sky | Roeser & Bastian 1993 |
| GSC | all-sky | Lasker et al. 1990 |
| DSS 1 & 2 | all-sky | GSC |
Considering the variety in star catalogs that are at the root of the astrometric calibration, the systematic offsets between different galaxy catalogs seem understandable. But does this explain (a) the similarities in the shifts of catalogs with different astrometry, and (b) the consistently found discrepancy in offsets between hemispheres?
It actually does. The reason is that most of the astrometric calibrations have their roots in three main astrometric reference catalogs, i.e. AGK3, SAOC and CPC, each covering a different declination range. This might explain some of the consistent differences between north and south.
Moreover, many of the later reference frames are tied to these early star catalogs, such as the Guide Star Catalog as well as DSS1 and DSS2. The astrometry of the GSC relies on the AGK3, SAOC and CPC and digitized images of pixel size was 17. Therefore the individual positions are not very accurate () and might suffer systematic errors of up to several arcsec close to the Schmidt plate-edges (Véron-Cetty & Véron 1996; see also Deutsch E.W. 1999 for a more detailed discussion on the astrometry error using digital sky surveys). The same inaccuracies are inherent to any position derived form digitized sky surveys such as the DSS1 or DSS2 (the pixel size of 17 and 10 respectively).
So the systematic shifts between different galaxy catalogs, as well as north and south seem to have their origin in the different astrometric reference frames, whereas many of the similarities in offsets are found for catalogs either based on the same astrometric reference frames or on secondary frames which again are linked to the original three astrometry frames. One should thus always be aware when determining positions from digitized images – even if calibrated to highly accurate astrographic catalogs – that the precision one can attain does not depend on that catalog, but on the pixel size of the scanning machine that produced the digitized images.
On top of that, Corwin et al. 1998 noted that further systematics of the same size may be introduced through the application of different position fitting algorithms, depending on whether the routines center or corners of pixels as their zeropoint (the point of origin of a DSS scan is, for instance, the southeastern corner of the southeastern pixel and not the center of the pixel) or format differences (integer versus floating).