Near–IR observations of NGC 6822: AGB stars, distance, metallicity and structure
Observations in the wave bands covering the central of the Local Group galaxy NGC 6822 have been made with the William Herschel Telescope in La Palma. They have allowed us to characterize, for the first time in the near–infrared across the whole galaxy, its late–type stellar population (i.e. red giant and asymptotic giant branch stars) and to derive from the ratio between carbon–rich and oxygen–rich asymptotic giant branch stars an indication about spatial variations in metallicity. These amount to about dex, twice of what has been previously found within each Magellanic Cloud using the same technique. We have calibrated our photometry on the DENIS (–band) and 2MASS ( and bands) data and obtained a distance modulus of from the position of the tip of the RGB. The large scale distribution of late–type stars suggests that either the galaxy is viewed under a high inclination angle or it has a non–negligible thickness. tars: late–type, AGB and post–AGB, distances – Galaxies: Local Group, irregular, abundances, Photometry: broad–band, IR
Key Words.:
S1 Introduction
NGC 6822 (Barnard bar (1884)) is an isolated irregular galaxy of the Local Group, the nearest to the Milky Way after the Sagittarius Dwarf and the Magellanic Clouds. Its stellar population has been largely studied through observations in the optical wave bands (Gallart et al. 1996a , 1996b , galla94 (1994), Komiyama et al. komi (2003), Letarte et al. tarte (2002), Wyder wyde (2001), de Blok & Walter blok3 (2003)). Similar to the Magellanic Clouds the galaxy contains a large and widely distributed intermediate–age stellar population () and a relatively small optical bar (). NGC 6822 is embedded in a much larger () HI envelope (cft. Volders & Högbom vold (1961), Roberts rob (1972), de Blok & Walter blok (2000), Weldrake et al. weld (2003)) and because of its low galactic latitude () it is affected by a moderate foreground extinction (Schlegel et al. sch (1998)) and contaminated by foreground stars. Schlegel et al. (sch (1998)) derived a mean reddening of in agreement with measurements by Massey et al. (mass (1995)) in the outer eastern and western part of the galaxy. The latter measured near the center of the galaxy, but this may be due to dust embedding young objects; this amount of reddening hardly affects the photometry of red giant branch stars (RGB) or asymptotic giant branch (AGB) stars. The mean distance to the galaxy is kpc, or (Van den Berg vdb (2000)).
An abundance gradient in [O/H] has been suggested by Venn et al. (venn (2001)); their measurements agree with those in HII regions (Pagel et al. pagel (1980), Skillman et al. skill (1989), Chandar et al. chan (2000)). The mean [O/H] abundance is intermediate between that of the SMC and LMC. Tolstoy et al. (tolto (2001)) derived the metallicity [Fe/H] of a few field RGB stars from measurements of the Ca II triplet. They obtained on average [Fe/H] dex but the individual points spread over a range from to dex.
NGC 6822 started to form stars at least Gyr ago and from low metallicity gas as the detection of RR Lyrae stars shows (Baldacci et al. balda (2002), Clementini et al. clem (2003)). Gallart et al. (1996b ) and Wyder (wyde (2001)), from their synthetic analysis of the RGB and of the whole HST colour–magnitude diagram, respectively, derived an age of – Gyr for the oldest stars. About 3 Gyr ago the rate of star formation began to increase (Tolstoy et al. tolto (2001)) and it kept increasing over the last Myr (Gallart et al. 1996c , Hutchings et al. hutch (1999)). Blue stars that formed in the past Gyr are not well mixed with the rest of the galaxy (Wyder wyde (2001)) and trace the distribution of the HI gas (Komiyama et al. komi (2003)). Many variable stars were found at the tip of the RGB that are probably long period variables (Baldacci et al. baldav (2003)) and thus AGB stars. These AGB stars are – Gyr old and have Z– (Gallart et al. 1996b ).
The only published near–infrared ( & bands) photometry of late–type stars is that by Davidge (dav (2003)), except for about known red-supergiants observed and discussed by Elias & Frogel (eli (1985)). Davidge observed three small () fields reaching . His analysis suggests that both age and metallicity can be disentangled from the slope and zero-point of the giant branch in the (, ) diagram. In fact he concludes that the slope of the RGB indicates [Fe/H] by comparison with theoretical isochrones (Girardi et al. leo (2000)), while the locus of the RGB is bluer than that of globular clusters with the same RGB slope suggesting that field RGB stars are about Gyr old.
Encouraged by our earlier near–infrared study of the Magellanic Clouds (Cioni et al. 2000c , 2000b , Cioni & Habing cm (2003)) we obtained comparable observations in the bands of the central region of NGC 6822. Our survey, slightly less extended than that of Letarte et al. (tarte (2002)), quadruples the number of AGB stars observed by Gallart et al. (1996a ). Strategy and details of the observations are reviewed in Sect. 2 while results are presented in Sect. 3. In Sect. 4 the distance, the metallicity and other properties are discussed and compared with the existing literature. Sect. 5 concludes our study. This paper is the first from a project devoted to late–type stars of northern Local Group galaxies started by Habing & Cioni in 2002. The results obtained from other targeted galaxies (less populated in AGB content) will be presented in a subsequent paper.
2 Observations
Observations were performed with the 4.2m William Herschel Telescope (WHT) on La Palma (Spain) during two runs in July 2002. The Isaac Newton Group Red Imaging Device (INGRID) was used to observe in the and band from 20th to 22nd July while observations in the band were obtained using the Prime Focus imaging camera (PFIP) on July 14th. INGRID is a near–infrared (near–IR) camera for use at the Cassegrain Focus. It has a Hawaii near–IR detector with a pixel scale of ″/pix which gives a total field of view of ′′. The PFIP is an optical mosaic camera of two EEV kk CCDs giving a pixel scale of ″/pix and a field of view of ′′. A central gap between the two chips leaves a gap of ″ between the two I–band images. Observations in the three wave bands have been taken as close as possible in time so that the colours will not be affected by the variability of the sources. The exposure time in was s while and images were obtained exposing for s each of co-averaged images of a single dithered position out of .
The total integration time allowed us to reach S/N in photometric measurements as faint as about mag below the tip of the red giant branch (TRGB) and to detect stars as bright as mag above the TRGB without detector saturation. In total we covered an area of about centered at :: and ::. On average three photometric standard star fields were observed each night in each wave band. Near–IR photometric standards were taken from the ARNICA list (Hunt et al. hunt (1998)) and –band photometric standards from Landolt (land (1992)). The sky was clear during both runs; the FWHM of the stars indicates that the seeing was below in the IR wave bands and about in the band. In the near–IR sky frames were observed after each pointing on NGC 6822 in directions about away in Right Ascension.
During the observations we noticed that the upper right corner of the INGRID field presented non–negligible distortions. Subsequently the overlap among the images of the mosaic was increased to cover at least a quarter of the field of view.
3 Data reduction
The processing of raw images was done using the IRAF software.
3.1 & bands
We used the INGRID quick look package available at (http://www.ast.cam.ac.uk/ING/Astronomy/instruments /ingrid/ingrid_ql.html) to split pre–read and post–read images and to apply the flat–field correction and the sky subtraction (iframediff). The flat field frame in each wave band was created from twilight exposures and the subtracted sky frame was flatfielded before removal. Dithered images were then aligned and combined. Dark current correction is implicitly performed during the sky subtraction.
A mosaic of all images in one wave band was created by matching overlapping regions between the fields. This process reduced considerably the effect of image distortions with array position. The two mosaics were finally aligned with each other.
3.2 band
The standard bias and flatfield correction was applied to each chip. Fringes were removed by dividing each time–normalized resulting image by a fringe time–normalized image. The latter (star free) image was created by combination of six images centered on the sparse Local Group galaxy Draco; for each image we used an exposure time of s and we corrected for bias and flat field. The observations of the Draco fields were obtained close in time (s on average) to the observation of NGC 6822.
3.3 Astrometry
Accurate positions have been derived in each wave band using a few stars from the Guide Star Catalogue II (GSC2.2, http://www-gsss.stsci.edu/gsc/gsc2/GSC2home.htm). Astrometric information was present in the fits header of each near–IR mosaic image. Using Skycat (http://archive.eso.org/skycat/) we first identified a few stars from GSC2.2 and then used IDL routines (STARAST) to correct their astrometry. –band images did not have the proper keywords in their fits header and these keys were reconstructed in a similar way using the same GSC2.2 reference stars. At last near–IR mosaic images were compared to the –band images to obtain a proper overlap between sources prior to their extraction.

3.4 Photometry
Sources were extracted using the SExtractor program (Bertin & Arnout sex (1996)). The flux of each source was calculated for an aperture of pixels and for a detection and analysis threshold equal to ; except for the parameters that characterize the detector we used default values for the remaining keywords in the SExtractor configuration file.
The source extraction was performed first in each wave band separately. Afterwards we matched the and detections using the full mosaic images and an association radius of pixels. The nearest source was kept as a counterpart. The cross–identification of –band sources was made separately for the –band chip using the near-IR registered images obtained from the and mosaics. Sources were matched using the same criteria. The combination of seeing and crowding in the band did not allow us to resolve accurately the stars towards the very center of the galaxy; we have missed some as bright as AGB stars. These sources, however, have been detected in the and wave bands.
SExtractor assigns to each extracted object a flag that depends on the quality of the photometric detection. Flag values are given in the documentation available at (http://terapix.iap.fr/rubrique.php?id_rubrique=91).
The photometric calibration was performed for each observing night. We also used SExtractor using all standard stars present in each field. Aperture of and pix were used to collect most of the flux in the and bands, respectively. Multiple measurements were averaged prior to the exclusion of a few outliers (i.e. sources with too few counts). Constant extinction coefficients in the near–infrared bands of mag in and mag in were taken from the intrument web page. The resulting zero–points are , and . The near–IR zero–points are about mag fainter than those indicated in the instrument web page, therefore observations discussed in this paper did not take place during perfect photometric conditions.
In order to improve the calibration of our data we have cross–identified them with the 2MASS (http://www.ipac.caltech.edu/2mass/) and DENIS catalogue (http://cdsweb.u-strasbg.fr/denis.html). We restricted the cross-identification to those sources covered by one of the –band chips. Because the great majority of our targets is variable (c.q. AGB stars) we considered, among sources detected in three wave bands, only those with: and . These should be mostly foreground objects but a few supergiants, bright AGB stars and other young stars will have been included. Coordinates in all three catalogues agreed very well with each other, providing only a single counterpart within ; most of the sources differ by not more than . We obtained objects in common with the 2MASS catalogue and objects in common with the DENIS catalogue of which and have a distance below . The latter were used to calculate the systematic photometric differences between the catalogues (Fig. 1). Resulting values are:
These shifts have been applied to all extracted sources in NGC 6822.
3.5 Catalogue
Table 1 shows the first ten lines of the full table (table.dat) that is only available in the electronic edition of this article. The table contains stars detected in all three bands, and : columns and list Right Ascension and Declination in degrees at epoch J2000, columns , and list magnitude, photometric error and SExtractor flag, respectively; columns and contain the same information for the and wave bands, respectively; this table lacks sources in the gap between the two –band fields. A second table (table2.dat) contains similar information for sources detected in both the and bands but not in the -band, and in the full mosaic without the central gap imposed by the –band data. Note that some sources from table.dat also occur in table table2.dat. However we decided to release both tables separately for the following reasons: after aligning the near–IR images to the area(s) covered by the –band the resulting photometric errors appear slightly different (cf. Fig.2), and the astrometric solution is more precise in the three–band catalogue. Table2.dat is released to support further studies that do not require a match with the –band data but instead reliable photometric correspondence between the two near–IR bands that also includes the very central region of the galaxy.
In both tables only sources with SExtractor flag in at least two wave bands have been included, with the additional condition that and (this implies ) and to exclude saturated objects: . This represents a suitable compromise between reliability and completeness. Fig. 2 shows the behaviour of photometric errors for all target stars as a function of magnitude in each wave band and indicates the region of released data. Sources detected only in one wave band or sources that were excluded by the release selection criteria will be made available upon request to the first author.
In our near–IR observations the confusion by merging stellar images is substantially smaller than in maps of comparable angular resolution but taken in other spectral ranges. The contamination by unresolved background sources and by sources of a different nature or age, is strongly reduced and the completeness of and band images is almost 100%; at the faintest magnitudes the completeness is dominated by seeing variations. This follows from inspection by eye after plotting the extracted sources on to the images. Sources with magnitude around or brighter than the TRGB are not affected by confusion. All this is not true for our –band images that are incomplete in a central field of about , due to the effects of both crowding and seeing (note that the observations were obtained with a seeing of about ). The incompleteness of the –band detections can be estimated using sources detected in the and wave bands only. We find % completeness at , % at , % at and below % for . Up to about we detected % and % of the sources seen in the and bands. We attribute the missing and to crowding. At magnitude the completeness begins to decrease monotonically, which is probably due to missing faint sources in the and bands.
4 Results
4.1 Magnitudes and Colours
4.1.1 , and histograms
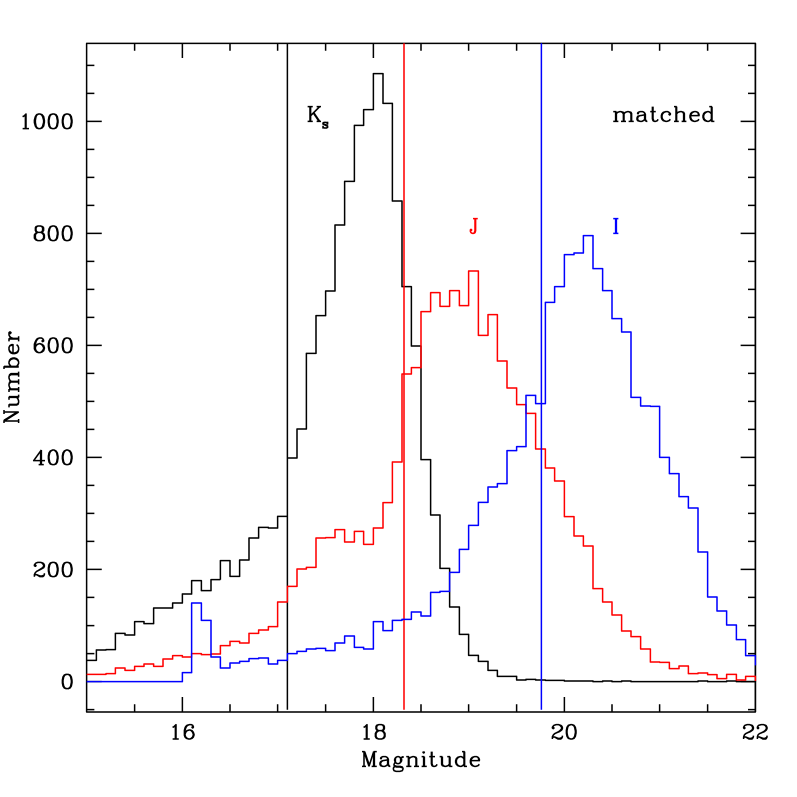
Figure 4 shows the histogram of the number of sources detected in all three wave bands as a function of magnitude. Vertical lines indicate the position of the TRGB. Although the discontinuity produced by the TRGB is clearly visible we determined a more precise location with the same technique as used in Cioni et al. (2000c ). The TRGB is at , and . Errors equal in each band where is the mean of all errors within mag from the TRGB location and is the total number of sources contributing to . Sources brighter than the TRGB are mostly AGB stars while fainter sources are RGB stars mixed with early–AGB (EAGB) stars; the RGB giants outnumber the EAGB stars by so much that we will ignore the latter category. We did not subtract the foreground stars from the histograms prior to the determination of the TRGB position because their number is small enough to be ignored: the foreground contribution in the band has been checked by assuming that stars located in a small box on each edge of the total survey area are all foreground stars and in the and bands off–set fields observed for image–sky–subtraction were used to estimate the foreground contribution. As a test we subtracted the foreground contribution from the magnitude histograms before the determination of the TRGB and we obtained the same result. Note that the little bump at about is caused by objects that saturated the detectors and that have been excluded from the released catalogue.
4.1.2 (, ) colour–colour diagram
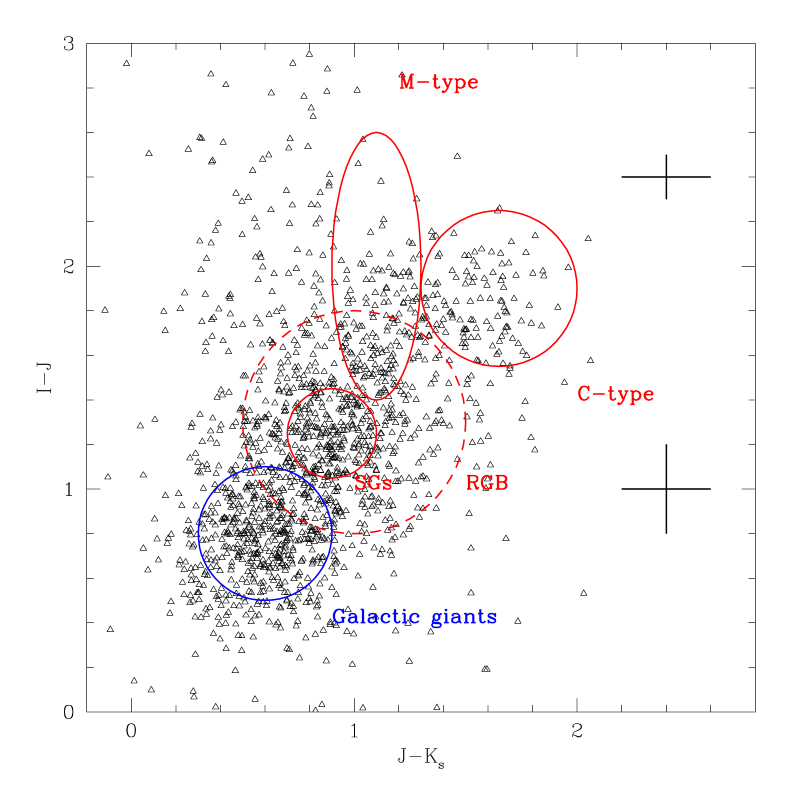
The colour–colour diagram (Fig. 5) contains only sources with a photometric error below mag in all three wave bands. These stars are representative of the distribution of sources in each region of the diagram; there is a negligible contamination by faint RGB stars. Sources with and are mostly foreground sources. Although the low latitude of NGC 6822 suggests that there is considerable foreground contribution, foreground stars have much lower colours and hence they do not overlap with the distribution of the AGB population. The middle dashed circle contains practically all RGB stars belonging to NGC 6822. Our experience with the red giants in the LMC and SMC shows that stars with and have early M–type spectra and thus an atmosphere with a C abundance less than the O abundance. Those with later M–type spectra extend to larger colours but at approximately the same colour. Stars with and are C–rich AGB stars. Those with are candidate obscured AGB stars and they can be either O–rich or C–rich. These locations depend somewhat on extinction and metallicity and are discussed here as indicative of which type of object is found around a given location in the colour–colour plot. Note that photometric errors blur the distribution of sources in the various regions. In fact it is difficult to identify red supergiants that are probably present in this galaxy (middle continuous circle). For a more detailed discussion and visualization of the regions in the colour-colour diagram see Cioni et al. (mess (2004)).
4.1.3 (, ) colour–magnitude diagram
The colour–magnitude diagram (, ) shown in Fig. 6 is a suitable tool for discriminating AGB stars from other stars in the galaxy and in the foreground (Cioni et al. 2000b ). The horizontal line marks the position of the TRGB while the slanted line () distinguishes between RGB plus AGB stars and either foreground or younger stars of NGC 6822. The slope of the slanted line is the same as in Cioni et al. (2000b ). Its zero-point has been adjusted by eye to be tangential to the plume of AGB stars. A few tests were made to select a zero-point that would compromise between including red-supergiants and excluding AGB stars of early spectral sub–type. Objects with and are probably red–supergiants. The largest concentration of objects is that of the upper RGB stars while AGB stars populate the plume of objects above the TRGB. For increasing envelope thickness the AGB plume bends down to faint magnitudes and red colours and obscured AGB stars may have an –magnitude below that of the TRGB.
4.1.4 (, ) colour–magnitude diagram
AGB stars selected as above are plotted in the colour–magnitude diagram (, ) in Fig. 7. The distribution shows a rather good correlation between colour and magnitude: when the colour increases the magnitude increases as well, but the correlation is apparent and not real. Analysis of similar data in the LMC and SMC shows that the diagram contains two sequences: one vertical sequence around that consists of stars with M–type spectra (O–rich stars) and a separate branch that departs to redder colours from the vertical O–rich branch around to ; this second branch contains C–rich AGB stars. The histogram in the upper right–hand corner indicates more precisely the separation between the two branches. It is the histogram of colours for sources having . The peak of the distribution corresponds to O–rich stars. On the red side of the peak there is a significant drop and then a plateau; this plateau contains the C–rich AGB stars. In the histogram the vertical line indicates the adopted separation between the two groups of stars. The same line is shown in the main part of the figure. Note that this separation has been applied to the data independently of their magnitude. The use of this selection criterion may be a conservative approach in defining the number of C–rich AGB stars (cft. Raimondo et al. gabri (2004)) but intrinsic C–rich AGB stars are usually brighter than TRGB stars and those C–rich stars below the TRGB are either extrinsic carbon stars (they belong to a binary system and have been polluted by AGB winds) or are sources with larger photometric errors that should instead be on to the O–rich branch. Therefore we adopted as the colour that distinguishes between sources of different chemical types. There are and C–rich and O–rich stars, respectively, a ratio of .
The adopted criterion for distinguishing between C– and O–rich stars implies a sharp transition between the two regimes. In a composite stellar population variations both in age and metallicity throughout the galaxy are expected. The colour of the giant branch varies by about mag for a variation in [Fe/H] of about dex (Ivanov & Borissova ivi (2002)). A variation of about mag is also predicted in the band for ages above Gyr, the variation in the band is somewhat less, inducing a variation in the colour of about mag (Girardi et al. leo (2000)). Differential reddening will also shift the giant branch to red colours. Moreover most AGB stars above the TRGB are long-period variables and vary with an amplitude of at least mag in the band (Cioni et al. iso (2003)). We conclude that the combined effect of age, metallicity but also of extinction and variability in the colour is of the order of the photometric errors involved in this study. In Sect. 4.2.3 we show the effect of changing the selection criterion on the determination of the C/M ratio.
Figure 7 contains O–rich AGB stars at magnitudes well below the magnitude of the TRGB. We know that they are AGB stars because of their colour; they would not have been recognized as such had we had only and magnitudes: The magnitude of the TRGB depends on colour and is horizontal only in the –band. On the other hand, selecting AGB stars only in the (, ) diagram excludes most obscured AGB star candidates, because they would have an –band magnitude below the TRGB, for which a spectral type is rather uncertain and needs spectroscopic mesurements (up to about 50% of these red stars could be O–rich).
4.1.5 histogram
The colour of the AGB stars is plotted in Fig. 8; the reddening correction is discussed in Sect. 5.1. This histogram shows the distribution, as a function of colour, of O–rich and C–rich AGB stars, respectively. For O–rich stars the variation in colour is correlated with the various sub–type M–spectra (M0, M1, M2 etc.; see Glass & Schultheis glsc (2003), Fluks et al fluks (1994), Blanco et al. blanco (1980), Blanco & McCarthy blca (1983)): this correlation is caused by the TiO molecular absorption bands that dominate the photometric –band: the TiO bands increase in strength considerably when the atmosphere gets cooler. Compared to the Magellanic Clouds (Cioni & Habing cm (2003)) most O–rich stars in NGC 6822 have M spectral sub–types between M0 () and M4 (). C–rich stars follow a rather symmetric distribution peaking at about .

4.2 Spatial distribution
4.2.1 Sources matched among three wave bands
Figure 9 shows the number density of sources in table.dat (i.e. detected in three wave bands); we have combined the two chips even though, as discussed above, there is a gap in sky coverage of . A gap clearly shows-up in Fig. 9. There are, however, also other effects with a bad influence on the quality of the maps: confusion caused by crowding in the central area made worse by poor seeing conditions during the observations.
We counted stars of a given type in bins where a single element corresponds to about square. The source density in each field has been smoothed using a box car function of width prior to the construction of the grey scale images where higher concentrations of sources are indicated by darker regions. From left to right we show the distribution foreground plus younger sources and RGB stars in the first row, AGB stars and the distribution of the C/M ratio, where the number of C–rich and O–rich sources has been selected as discussed above, in the second row. The lack of sources at the outer borders is due to a real decrease in the number statistics. RGB and AGB stars are distributed smoothly and quite regularly around a central, possibly double peak, region compared to the more clumply structure described by foreground and younger stars. The distribution of the C/M ratio is also rather clumpy. Contrary to expectations the younger+foreground component does not trace the known bar present in this galaxy. Apart from coverage, seeing and crowding effects already discussed, it may be that because of the shallow limit of the –band observations only a very small young component of the galaxy was detected: a few upper main–sequence stars and supergiants; the majority being below the detection limit. This can also be deduced from Fig. 6 where main–sequence stars, if present, would strongly populate the region left of the slanted line at . At these magnitudes photometric errors increase and may give rise to a contamination with RGB stars. This was also the case in the LMC; compare Figs. 2 and 4 in Cioni & Habing (2000b ).
4.2.2 Sources matched between and only
If we would have had no –band observations and only and photometry we would obtain the maps in Fig.11, which are similar to those in Fig. 9. The area covered and the size of each bin is the same as in Fig. 9, but the bad effects of the gap, crowding and seeing in the –band data are now of course absent. The selection of RGB and AGB stars has been made in the (, ) diagram. Only stars above the TRGB () have been taken as representative of the AGB population and we distinguished between O–rich and C–rich using as the dividing line. There are C–rich stars and O–rich stars; their ratio C/M. The simple selection criterium ( or ) does not include O–rich AGB stars of early spectral sub–type because these are located below the TRGB in the –band and are therefore mixed with RGB stars. However, this criterium can be refined by excluding the bluest and brighter stars (i.e. red–supergiants and possibly foreground stars) and the reddest stars (i.e. obscured AGB star candidates of uncertain spectral type) but it will still produce a biased AGB statistical sample (see Fig. 10); because of the large number of overlapping sources the coloured version of this figure is needed to understand the selection criteria and is available in the electronic version of this article. All other sources below the TRGB were taken to be RGB stars. Fig. 10 shows also that the tip of the AGB can be recognized at . This corresponds to using the distance modulus derived in Sect. 5.1; this is a rather common upper limit in other galaxies as well.
Figure 11 shows that the RGB and AGB stars are distributed rather smoothly over the galaxy. In this figure the most prominent feature of NGC 6822 is a bar outlined by an increasing number of sources and by the darkness level. A double-peaked central structure is prominent in the almost circular RGB distribution, while AGB stars describe a cross–like shape with the lower arm twisting eastwards. Compared to Fig. 9 it is clear that small–number statistics may show erroneous features and give a misleading image of the surface distribution of a given type of stars. Though the selection of AGB stars shown in Fig. 9 has been more reliable than the selection shown in Fig. 11, the resulting sample is rather incomplete when compared to the AGB stars selected from near–IR bands only: once again it is very difficult to keep both reliability and completeness at the required high level.
4.2.3 The C/M ratio distribution
The distribution of the C/M ratio is similar to that in the Large Magellanic Cloud (Cioni & Habing cm (2003)); it increases towards some specific regions in the outer parts of the main optically visible structure. The center has a rather low C/M ratio and this we consider to be real (1.4); the low C/M ratio in the outer parts may be true but the data are affected by small number statistics. This figure compared to Fig. 9 describes almost exactly the same features, though contours and grey scales are different because of the different statistics. Regions of higher C/M ratio are arranged in a broken circle and avoid the region where the bar is located. The bar itself has a relatively low C/M ratio in its northern parts, but a bar-like structure cannot be recognized in the C/M distribution (e.g. Fig. 11). On the outer western side a secondary semi–circle is seen that contains clumps with higher C/M ratio. This structure is parallel to the inner broken–circle. The two are separated by a region of lower ratio values. Note a lack of stars in a square area in the NW; it is purely artificial and due to a low quality image where too few sources could be extracted. The largest elongated blob of high C/M ratio is traceable in all other maps of Fig. 11 as the southern of two components within the bar structure.
The C/M ratio is affected by the photometric errors-induced migration of stars through the colour wall. Figure 12 shows the distributions of the C/M ratio obtained by dividing AGB stars into C–rich and O–rich at and at . Compared to the C/M ratio distribution shown in Fig. 11, where the discrimination between C–rich and O–rich AGB stars was set at , the features of high ratio, or low metallicity, are quite similar. The major difference is in the global C/M ratio. A variation of mag in the selection criterium of the two spectral types of AGB stars induces a variation of about in the global C/M ratio.
Finally we would like to draw the attention of the reader to the absolute number of AGB stars involved in the C/M ratio distribution shown in Fig. 11. The absolute number of C and M stars as a function of their C/M ratio is shown in Fig. 13. On the vertical axis integer numbers of C stars are indicated with triangles and of M stars with squares. The horizontal axis indicates the ratio between the number of C stars and M stars in a given “column”, and it can be a fractional value. For example C/M occurs because there are C stars in regions where there are from to M stars. C/M occurs in a region where there are either C stars and M star, C stars and M stars or C stars and M stars. Though the absolute statistics are not striking, the occurrence of a high, or low, ratio in consecutive spatial regions makes it a more robust result.
5 Discussion
5.1 Determination of the distance to the Galaxy
The –band magnitude of the TRGB depends only weakly on age and metallicity (Salaris & Cassisi sal (1997)) and can thus be used as a standard candle; see Lee et al. (lee (1993)). We adopt the interstellar extinction as measured by Schlegel et al. (sch (1998)) of , and the absorption in the , and wave bands available from NED derived using Cardelli’s (cardi (1989)) law. These are: , and . Combining the apparent –band TRGB magnitude derived in the previous section with the most recent absolute calibration of the TRGB magnitude in the –band by Bellazzini et al. (bel (2001)), , we obtain ; this corresponds to a distance of kpc. Lee et al. (lee (1993)) who also used the TRGB method measured . Using observations of Cepheids Gallart et al. (1996a ) derived while Clementini et al. (clem (2003)) obtained from observations of RR Lyrae. Our measurement is, within the errors, in agreement with previously determined values. The error we quote is only the formal error, but because we adjusted the photometry to the DENIS –band data we expect systematic errors to be small. However, a major systematic uncertainty might be due to the absorption in the band. In fact Gallart et al. (1996a ) derive while we obtain which is in very good agreement. Note also that a large fraction of the uncertainty in the distance modulus comes from the error associated to the absolute calibration. Lee et al. (lee (1993)) measure but derive a distance modulus very similar to that of Gallart et al. (1996a ). Beside the effect of a different extinction law there is also a difference in the method used to assign the TRGB location. Fig. 3 of Lee et al. (lee (1993)) shows that for data grouped in bins of mag the convolution with an edge detection filter produces a histogram that peaks at with FWHM of about mag. The uncertainty is large and the number statistics of stars at the TRGB is about a factor of ten smaller than in our work and that of Gallart et al. However there is an excellent agreement (within mag!) between our measurement and that derived from the mean luminosity of RR Lyrae by Clementini et al. (clem (2003)).
5.2 Metallicity gradient
The significant variation in the C/M ratio over the face of the galaxy is explained by a variation in the metallicity: a higher C/M implies a lower metallicity as is well known from previous studies; for references to earlier work on the SMC, LMC and the Milky Way galaxy see Cioni& Habing (cm (2003)). The correlation between the C/M–ratio and metallicity is qualitatively explained by Scalo & Miller (scalo (1981)) and by Iben & Renzini (ibre (1983)): (i) O–rich AGB stars of lower metallicity turn more easily into C–rich stars, (ii) evolutionary tracks for lower metallicities are shifted to higher temperatures and (iii) in very low metallicity environments post–horizontal branch stars may fail to become AGB stars. If the star formation rate has not varied with stellar mass, the variation in C/M represents a variation in metallicity at the time that the relevant AGB stars were formed. The variation in [Fe/H] over the face of NGC 6822 implies a lack of circulation or turbulence: areas enriched in [Fe/H] in a local star burst have not been mixed with areas of lower metallicity, at least not within the age of these stars, between 2 and 5 Gyr.
A calibration of the relation between C/M and [Fe/H] is presented in Cioni & Habing (cm (2003)) : . This relation is rather uncertain (about dex in each [Fe/H] measurement and about % in the total number of AGB stars detected in each galaxy) but it still provides a good indication of the spread in metallicity. We have updated this relation using the latest number of M0+, C and [Fe/H] from Groenewegen (gronew (2004)) and by correcting a typo in Groenewegen’s Table 1.1, kindly pointed out by the referee P. Battinelli: the number of M0+ stars in SagDIG is instead of . We obtain: as shown in Fig. 14. The relation becomes less steep because the effect of SagDIG is compensated by NGC 2403. Though the latter is outside the Local Group boundary (1 Mpc) there is no apriori reason to exclude it.

C/M contours in Fig. 9 and Fig. 11 vary from to and and respectively and this then corresponds to a variation of dex and dex in metallicity respectively. However, the absolute and unsmoothed variation of C/M is about and this corresponds to an average [Fe/H] dex. This spread is about twice the value derived for both Magellanic Clouds and agrees with the spread derived by Tolstoy et al. (tolto (2001)). The authors measured the Ca II triplet in RGB stars and obtained on average [Fe/H] but with the highest metallicity around [Fe/H] and the lowest around [Fe/H]. Instead a gradient in [O/H] has been suggested by Venn et al. (venn (2001)). At present we are measuring the Ca II triplet absorption lines to check and perhaps improve the metallicity index of a statistically significant number of AGB stars in NGC 6822.
5.3 The structure of NGC 6822
The near–IR data covering the whole galaxy allow us to investigate its structure and derive viewing angles: the inclination () and position angle (PA) of the line of nodes (i.e. the intersection of the galaxy plane and the sky plane) following a technique developed by van der Marel & Cioni (vdm (2001)). We have transformed sky coordinates (, ) of sources in table2.dat into angular coordinates (, ) for all sources detected in and regardless of their –band values. We thus cover NGC 6822 entirely while the sources remain well resolved even in the most crowded central region. We use as central reference the point (::, ::) that corresponds to the optical and radio center of the galaxy (van den Berg vdb (2000)). The angle is measured counterclockwise starting from the West. We divided the surface of NGC 6822 into sectors, each with an opening angle of deg. and into rings: and . This division provides a minimum significant number of stars in each region; there are in total separate regions. The goal is to investigate how much the magnitude of a group of stars varies with and . Thus we selected C–rich AGB stars with and and calculated their number distribution in colour and magnitude in each region. Assuming that the stars that we see in the galaxy lie in a thin plane, the magnitude at a given distance from the center will have an approximately sinusoidal variation with position angle with amplitude .
The major limitation in applying this technique in NGC 6822 lies in the low numbers of stars. We found a systematic variation in the ring at deg but not in the other ring; see Fig. 15. From this we derive the inclination, deg. This result is considerably different from the value deduced from Letarte et al. (tarte (2002)): taking the ellipticity of their outer contour, and using the formula we obtain an inclination angle of only deg. If deg is the real inclination of the galaxy then we expect an amplitude variation, as defined above, of the order of mag, too small to explain the variation observed in this one ring. Note that the formal error associated to each point in Fig. 15 is a factor smaller than the observed variation observed which is on the other hand comparable to the formal error associated to each single point. The intersection between the continuous line and the zero level line corresponds to the PA defined as PA in the usual astronomical convention (i.e. measured counterclockwise starting from the North), therefore we obtain PA deg which is in very good agreement with the PA of the optical bar derived by Hodge (hodge (1977)).
It is interesting to note that also the colour has an almost regular variation as a function of position angle. This may be due to a variation in metallicity; if so, it should correspond to the variation in metallicity derived from the C/M ratio. In fact comparing with Fig. 9 and 11, sources in the outer NE and SE regions have a lower C/M ratio than sources in the outer NW and SW regions.
The situation is more confused in the inner ring and no regular pattern could be detected for the band either. The latter is expected because C–rich AGB stars span a larger range in than in , thus the band is by definition a much better indicator of differences in distance unless a very large number of stars is present.
Finally we did not study the variation of the TRGB as a function of sector in the outer ring. This should be done using –band data as well, but the effect of the central gap, crowding and seeing would strongly bias the result.

5.4 Comparison with other distributions
Gallart et al. (1996c ) found that recent star formation (– Myr) is enhanced in the upper and lower part of the NGC 6822 bar compared to the center, and this has been confirmed recently by de Blok & Walter (blok3 (2003)). Maps in Fig. 11, and in particular the distribution of RGB stars, show a high central density of stars that would be on average several Gyr old, in agreement with Gallart et al. (1996c ). The central region is also populated by a high concentration of AGB stars as well as the lower part of the bar. Deeper photometric observations obtained by Wyder (wyde (2001)) with the Hubble Space Telescope also show an old RGB population in the central bar region. This region has also experienced, like other fields surveyed in the bar, a higher rate of star formation in the past Gyr. The high extinction of this region is in agreement with a high m emission as measured by the IRAS satellite (Rice rice (1993)).
Letarte et al. (tarte (2002)) have surveyed NGC 6822 in four filters, two broad–band filters and two narrow–band filters, to identify and study the distribution of C stars – a technique first used by Cook et al. (cook (1986)). They detected C stars and several RGB stars that describe an almost elliptical structure as far out as . In this study we select C stars using the combined criteria and using photometry only. The elliptical structure claimed by Letarte is dominated by RGB stars (all their stars with ) and this is directly comparable with the distribution of the sources that we selected. Figures 11 and 9 show that the sources are widely distributed and that a slightly elliptical structure is confirmed; most importantly this broad structure is not only formed by old stars. The extended distribution of RGB stars in Fig. 9 is only marginally afftected by foreground sources because of the adopted selection criteria. This permitted us to measure the C/M ratio across the galaxy, something that Letarte et al. (tarte (2002)) did not explore.
The distribution of HI gas (de Blok & Walter blok (2000), Weldrake et al. weld (2003)) extends to and defines an elongated, flattened structure with PA deg. and deg that is rather clumpy, especially in the center. There is an indication that some of the high C/M ratio blobs correspond to high HI column density regions. The distribution of the HI gas usually indicates regions where star formation is currently taking place. We may conclude that where the correspondence holds the gas is relatively metal poor. Mouhcine & Lançon (mou (2003)) suggest that the C/M ratio measures both the metallicity of the carbon star progenitors and the present interstellar medium metallicity. Though we cannot exclude that the local composition has been altered by the presence of a bar we certainly know that because NGC 6822 is isolated within the Local Group, it has not suffered strong interactions that may have altered its inner disk. A more detailed comparison between the two distributions and follow–up studies of the stellar populations associated to the different features will put further constraints on the evolution of the galaxy.
5.5 Miscellaneous
The average metallicity of NGC 6822 can be derived from the dereddened colour using the relation(s) by Valenti et al. (val (2004)). Based on near–infrared data of several globular clusters in the Galaxy these authors calibrated the photometric indices that describe the location and morphology of the RGB. Here we refer to the index and we will use only the relation [Fe/H] at . Applying the reddening correction and the distance modulus as determined in the previous section we obtain a CMD of versus the absolute magnitude ; see Fig. 16. The box in the upper right corner shows a histogram of all sources within mag from as a function of . A well defined peak is present at from which we derive a metallicity of [Fe/H]; here we have assumed that the uncertainty of this determination is represented by half the bin size ( mag). This value agrees with a value derived by Davidge (dav (2003)) from the slope of the RGB – a quantity that we cannot measure because our observations are not deep enough. Because the variation in the C/M ratio suggests a considerable spread in metallicity, one can speculate that the metallicity obtained from RGB and AGB stars relates to two different epochs of star formation; in a simple stellar population the RGB stars are on average older than AGB stars. If the age difference between AGB and RGB stars is of the order of Gyr and the chemical enrichment law according to Davidge is [Fe/H] dex Gyr-1, we conclude that an average AGB star in NGC 6822 would have [Fe/H] dex.
The bolometric magnitude of AGB stars in NGC 6822 can be qualitatively derived as follows. AGB stars shown in Fig. 7 are likely to have thin circumstellar envelopes and the , and wave bands will contain most of the stellar flux. These AGB stars have on average and . Using the relation derived by Alvarez et al. (alva (2000)), – this relation has been compared with the integration over the spectral energy distribution of AGB stars in the Small Magellanic Cloud observed from the optical –band to the mid–IR m ISO–band (cft. Appendix in Cioni et al. iso (2003)), correcting for extinction and by applying the distance modulus derived in Sect. 5.1, we obtain that the average AGB star in NGC 6822 would have . Furthermore, assuming that at least a few stars with these characteristics are typical Mira variables and pulsate with days we can also use the theoretical models by Vassiliadis & Wood (vassi (1993)), that relate with to derive that the average AGB star in NGC 6822 has a main-sequence mass of about M⊙ and is about Gyr old. These are purely qualitative considerations and have been discussed only to obtain a crude indication of the type of AGB stars detected in this paper. Only when accurate measurements of the pulsation period are available will we put more quantitave constraints on the mass and age of the AGB stars. A monitoring program is currently under way.
6 Conclusions
In this paper we report observations in the , and bands of the central of NGC 6822. Many RGB and AGB stars have been detected and their distribution in colour–colour and colour–magnitude diagrams has been discussed. In particular RGB stars and AGB stars (both C–rich and O–rich) have been statistically disentangled. The surface distribution of these groups and of the C/M ratio, as an indicator of metallicity, have been discussed. We derive a spread in metallicity within NGC 6822 that is twice as large as the spread deduced within each Magellanic Cloud and that corresponds to about dex. The average metallicity of an average AGB star of M⊙, approximately Gyr old, detected in this study, could be dex. Regions of higher ratio, or of lower metallicity, are distributed in one or two semi–circles around the location of the bar which itself has a lower ratio or a higher metallicity. The position of the TRGB in the band has been used to derive a distance modulus for the galaxy of . The photometry discussed in this paper has been calibrated using DENIS data for the band, and 2MASS data for the and bands. C–rich AGB stars distributed in a ring between and . from the galaxy center show a different –band mode magnitude as a function of position angle. The amplitude of this difference corresponds to an inclination of about deg and a PA degrees. A similar behaviour is found for the colour that is probably a result of a difference in metallicity. If the HI gas distribution traces the plane of the galaxy then the small bar may be the result of projection of a more extended bar–like structure viewed at an inclination of about degrees.
Acknowledgements.
We thank Philip Habing for his enthusiastic contribution to the observations and the referee Paolo Battinelli for his useful comments that enhanced the analysis and discussion presented in this paper. This paper makes use of data products from the Two Micron All Sky Survey, which is a joint project of the University of Massachusetts and the Infrared Processing and Analysis center/California Institute of Technology, funded by the National Aeronautics and Space Administration and the Mational Science Foundation. The paper also uses data from the DENIS project that is partially funded by European Commission through SCIENCE and Human Capital and Mobility plan grants, and is also supported, in France by the Institut National des Sciences de l’Univers, the Education Ministry and the Centre National de la Recherche Scientifique, in Germany by the State of Baden-Würtemberg, in Spain by the DG1CYT, in Italy by the Consiglio Nazionale delle Ricerche, in Austria by the Fonds zur Förderung der wissenschaftlichen Forschung und Bundesministerium für Wissenschaft und Forschung, in Brazil by the Foundation for the development of Scientific Research of the State of Sao Paulo (FAPESP), and in Hungary by an OTKA grant and an ESOC&EE grant. This research has made use of NASA/IPAC Extragalactic Database (NED) which is operated by the Jet Propulsion Laboratory, California Institute of Technology, under contract with National Aeronautics and Space Administration.References
- (1) Alvarez R., Lançon A., Plez B., Wood P.R., 2000, A&A 353, 322
- (2) Baldacci L., Matonti F., Rizzi L., et al., 2002, Mem. S.A.It. 73, 23
- (3) Baldacci L., Clementini G., Held E.V., Rizzi L., 2003, in ”Variability with Wide Field Imagers”, Workshop 16-20 Sept. 2002, Lampedusa (Italy)
- (4) Bellazzini M., Ferraro F.R., Pancino E., 2001, ApJ 556, 635
- (5) Barnard E.E., 1884, Sideral Messenger 3, 254
- (6) Bertin E., Arnout S., 1996, A&AS 117, 393
- (7) Blanco V.M., McCarthey M.F., Blanco B.M., et al., 1980, ApJ 242, 938
- (8) Blanco V.M., McCarthy M.F., 1983, AJ 88, 1442
- (9) de Blok W.J.G., Walter F., 2003, MNRAS 341, L39
- (10) de Blok W.J.G., Walter F., 2000, ApJ 537, L95
- (11) Cardelli J.A., Clayton G.C., Mathis J.S., 1989, ApJ 345, 245
- (12) Chandar R., Bianchi L., Ford H.C., 2000, AJ 120, 3088
- (13) Cioni M.-R.L., Habing H.J., Loup C., et al., 2004, The Messenger 115, 22
- (14) Cioni M.-R.L., Blommaert J.A.D.L., Groenewegen M.A.T., et al., 2003, A&A 406, 51
- (15) Cioni M.-R.L., Habing H.J., 2003, A&A 402, 133
- (16) Cioni M.-R.L., Loup C., Habing H.J., et al., 2000a, A&AS 144, 235
- (17) Cioni M.-R.L., Habing H.J., Israel F.P., 2000b, A&A 358, L9
- (18) Cioni M.-R.L., van der Marel R.P., Loup C., Habing H.J., 2000c, A&A 359, 601
- (19) Clementini G., Held E.V., Baldacci L., Rizzi L., 2003, ApJ 588, L88
- (20) Cook K.H., Aaronson M., Norris J., 1986, ApJ 305, 634
- (21) Davidge T.J., 2003, PASP 115, 635
- (22) Elias J.H., Frogel J.A., 1985, ApJ 289, 141
- (23) Fluks M.A., Plez B., The P.S., et al., 1994, A&AS 105, 311
- (24) Gallart C., Aparicio A., Bertelli G., Chiosi C., 1996, AJ 112, 1950
- (25) Gallart C., Aparicio A., Vílchez J.M., 1996, AJ 112, 1928
- (26) Gallart C., Aparicio A., Bertelli G., Chiosi C., 1996, ApJ 112, 2596
- (27) Gallart C., Aparicio A., Chiosi C., Bertelli G., Vílchez J.M., 1994, ApJ 425, L9
- (28) Girardi L., Bressan A., Bertelli G., Chiosi C., 2000, A&AS 141, 371
- (29) Glass I., Schultheis M., 2003, MNRAS 345, 39
- (30) Groenewegen M.A.T., 2004, Proceeding of ESO Workshop: “Planetary Nebulae beyond the Milky Way”, Ed. J. Walsh & L. Stanghellini, astro-ph/0407282
- (31) Hodge P.W., 1977, ApJS 33, 69
- (32) Hunt L.K., Mannucci F., Testi F., et al., 1998, AJ 115, 2594
- (33) Hutchings J.B., Cavanagh B., Bianchi L., 1999, PASP 111, 559
- (34) Komiyama Y., Okamura S., Masafumi Y., et al., 2003, ApJ 590, L17
- (35) Iben I., Renzini A., 1983, ARA&A 21, 271
- (36) Ivanov V.D., Borissova J., 2002, A&A 390, 937
- (37) Landolt A.U., 1992, AJ 104, 340
- (38) Lee M.G., Freedman W.L., Madore B.F., 1993, ApJ 417, 553
- (39) Letarte B., Demers S., Battinelli P., Kunkel W.E., 2002, AJ 123, 832
- (40) Massey P., Armandroff T.E., 1995, AJ 109, 2470
- (41) Mouhcine M., Lançon A., 2003, MNRAS 338, 572
- (42) Pagel B.E., Edmunds M.G., Smith G., 1980, MNRAS 193, 219
- (43) Raimondo G., Cioni M.-R.L., Rejkuba M., Silva D., 2004, A&A, submitted
- (44) Rice W., 1993, AJ 105, 67
- (45) Roberts M.S., 1972, IAU Symp. 44, p. 12
- (46) Salaris M., Cassisi S., 1997, MNRAS 289, 406
- (47) Scalo G.M., Miller G.E., 1981, AJ 248, L65
- (48) Schlegel D.J., Finkbeiner D.P., Davis M., 1998, ApJ 500, 525
- (49) Skillman E.D., Terlevich R., Melnick J., 1989, MNRAS 240, 563
- (50) Tolstoy E., Irwin M.J., Cole A.A., et al., 2001, MNRAS 327, 918
- (51) Valenti E., Ferraro F.R., Origlia L., 2004, MNRAS accepted, astro-ph/0403563
- (52) Van den Berg S., 2000, in “The Galaxies of the the Local Group”, Cambridge Astr. Series
- (53) van der Marel R.P., Cioni M.-R.L., 2001, AJ 122, 1807
- (54) Vassiliadis E., Wood P.R., 1993, ApJ 413, 641
- (55) Venn K.A., Lennon D.J., Kaufer A., et al., 2001, ApJ 547, 765
- (56) Volders L., Högbom J.A., 1961, Bull. Astron. Inst. Netherlands 15, 307
- (57) Weldrake D.T.F., de Blok W.J.G., Walter F., 2003, MNRAS 340, 12
- (58) Wyder T.K., 2001, AJ 122, 2490