Complex X-ray Absorption and the Fe K Profile in NGC 3516
Abstract
We present data from simultaneous Chandra, XMM-Newton and BeppoSAX observations of the Seyfert 1 galaxy NGC 3516, taken during 2001 April and November. We have investigated the nature of the very flat observed X-ray spectrum. Chandra grating data show the presence of X-ray absorption lines, revealing two distinct components of the absorbing gas, one which is consistent with our previous model of the UV/X-ray absorber while the other, which is outflowing at a velocity of km s-1, has a larger column density and is much more highly ionized. The broad-band spectral characteristics of the X-ray continuum observed with XMM during 2001 April, reveal the presence of a third layer of absorption consisting of a very large column ( 2.5 x 1023 cm-2) of highly ionized gas with a covering fraction 50%. This low covering fraction suggests that the absorber lies within a few lt-days of the X-ray source and/or is filamentary in structure. Interestingly, these absorbers are not in thermal equilibrium with one another. The two new components are too highly ionized to be radiatively accelerated, which we suggest is evidence for a hydromagnetic origin for the outflow. Applying our model to the November dataset, we can account for the spectral variability primarily by a drop in the ionization states of the absorbers, as expected by the change in the continuum flux. When this complex absorption is accounted for we find the underlying continuum to be typical of Seyfert 1 galaxies. The spectral curvature attributed to the high column absorber, in turn, reduces estimates of the flux and extent of any broad Fe emission line from the accretion disk.
1 Introduction
It is now understood that intrinsic UV and X-ray absorption is present in the spectra of at least half of all Seyfert 1 galaxies (Reynolds 1997; George et al. 1998; Crenshaw et al. 1999). High resolution UV spectra obtained with the spectrographs aboard the Hubble Space Telescope and, most recently, X-ray spectra obtained with Chandra and XMM have revealed blueshifted absorption lines, signifying massive outflows of gas from the active nuclei of these galaxies (Crenshaw, Kraemer, & George 2003, and references therein). The fact that intrinsic absorption is so common among Seyfert galaxies suggests that the absorbers have large global covering factors and the inferred mass loss rates are comparable to the mass accretion rates of the supermassive black holes (SMBH) that power the active galactic nuclei (AGN). The X-ray and UV absorption is highly variable in a number of sources, which may be the result of changes in ionization state (Bromage et al. 1985; Crenshaw et al. 2000) or transverse motion (Crenshaw & Kraemer 1999; Kraemer, Crenshaw, & Gabel 2001a). Although it has been suggested that the X-ray and UV absorption arises in the same gas (Mathur et al., 1994), there is clearly a range of physical conditions in each component (e.g., Krolik & Kriss 2001; Kraemer et al. 2001b; Kaspi et al. 2000). Several dynamical models have been proposed for the physical nature of mass outflows in AGN including Compton-heated winds (Begelman, McKee, & Shields, 1983), radiatively driven flows (e.g., Murray & Chiang 1995; Proga, Stone & Kallman 2000), hydromagnetic (MHD) flows (e.g, Blandford & Payne 1982; Bottorff, Korista, & Shlosman 2000), and hybrids of the latter two (e.g., Konigl & Kartje 1994; de Kool & Begelman 1995; Proga 2003); most current models assume that the outflow originates at the accretion disk surrounding the SMBH.
NGC 3516 (z=0.008836; Keel 1996) is one of the few Seyfert 1 galaxies with UV absorption lines, specifically N v 1238.8, 1242.8, , C iv 1548.2, 1550.8, and Si iv 1393.8, 1402.8, strong enough to have been detected with the International Ultraviolet Explorer (IUE; Ulrich & Boisson 1983). IUE monitoring campaigns found evidence for absorption line variations on timescales as short as weeks (Voit, Shull, & Begelman 1987; Walter et al. 1990; Kolman et al. 1993), and the equivalent width of C iv appeared to be anti-correlated with the UV continuum flux, which suggests that the absorber was responding to changes in the strength of the ionizing radiation. This variability constrains the radial distance of the absorbers to be 10 pc (Voit, Shull, & Begelman 1987; Walter et al. 1990). Based on Hubble Space Telescope (HST)/Goddard High Resolution Spectrograph observations, Crenshaw, Maran, & Mushotzky (1998) determined that the C iv absorption lines consisted of four separate kinematic components: two relatively stable narrow components near the core of the line, and two broad, variable blueshifted components.
NGC 3516 also exhibits strong, highly variable X-ray absorption (Kolman et al. 1993; Nandra & Pounds 1994; Kriss et al. 1996; Mathur, Wilkes, & Aldcroft 1997). Based on their analysis of ROSAT observations, Mathur et al. (1997) suggested that the X-ray and UV absorption arose in the same component, although Kolman et al. (1993) argued that the X-ray absorption detected with Ginga consisted of at least two zones. Mathur et al. further argued that the absence of a highly blue-shifted broad UV absorption feature in IUE observations taken between 1989 and 1993 (Koratkar et al., 1996) was due to the drop in density, hence increase in ionization state of the absorber as it moved radially outwards. Recent observations have found NGC 3516 to be in a relatively low flux state. Chandra LETG data from 2000 October 6 suggested a model whereby a constant column of gas with reacts to changes in the nuclear ionizing flux (Netzer et al., 2002). Netzer et al. determined the radial distance of the absorber to be 6 x 1017 cm (for H0 75 km s-1 kpc-1). Based on their analysis of contemporaneous echelle spectra obtained with the HST/Space Telescope Imaging Spectrograph, Kraemer et al. (2002) argued that the strong Ly, N v, and C iv lines arose in the same column of gas. Furthermore, they concluded that the variability of the UV absorption was primarily due to changes in the ionizing flux, whose effect is amplified for the more distant absorbers, which are ionized by radiation that has been filtered by intervening gas. This is clearly illustrated by the re-appearance of the highly blue-shifted, broad UV absorption discussed by Mathur et al. With NGC 3516 in a low flux state, the combination of the weaker ionizing radiation and the higher opacity of the intervening gas induced such a large drop in ionization that a component of very highly ionized gas recombined sufficiently to produce observable UV lines.
We present here Chandra HETG spectra, XMM-Newton (hereafter XMM) EPIC CCD spectra and PDS data from simultaneous BeppoSAX observations of NGC 3516 from 2001 April and November. Previous analysis of a subset of these data concentrated on just the Fe K regime in data from 2001 November. The Fe K line showed interesting structure and rapid evolution during the 2001 November observation, and the combined HETG/EPIC data in the hard X-ray regime have been detailed by Turner et al. (2002). Initial analysis of the 2001 November data also revealed a very flat observed continuum shape. November data from the HETG showed no significant absorption lines, leaving ambiguity as to the nature of the flat observed spectrum that could be either intrinsically flat; have a ’normal’ photon index and appear flat due to complex layers of absorption or be dominated by reprocessed components mimicing a flat spectrum (i.e. a very broad line from the accretion disk, hereafter denoted a ’diskline’, of large equivalent width and associated Compton hump). As the ambiguity could not be broken using 2001 November data alone, Turner et al. (2002) used a simple flat powerlaw parameterization of those data, against which to examine the newly-discovered narrow and redshifted line emission from Fe.
Analysis of data from 2001 April has now shown footprints of highly-ionized absorbing gas, whose presence had been suggested but never unambiguously confirmed before in this source. We present a detailed parameterization of NGC 3516 based on data from both April and November epochs of 2001.
2 The Multi-satellite Observations
2.1 The Chandra Data
Chandra observations of NGC 3516 were performed at two epochs during 2001 using the High-Energy Transmission Grating Spectrometer (HETGS; e.g. Marshall, Dewey & Ishibashi 2004) in conjunction with the ‘S-array’ of the Advanced CCD Imaging Spectrometer (ACIS; e.g. Garmire et al 2003). We note that to-date, these are the only Chandra observations of NGC 3516 to have been performed with the HETGS/ACIS-S instrument configuration. The first observation (obsids 2431 and 2080) was performed over the period April 09 14:12 to April 11 14:53 UTC, but with an interruption (April 10 01:17–17:55 UTC) when solar activity led to sufficiently high background levels that the detectors were turned off. The second observation (obsid 2482) was performed between 2001 November 11 01:00 UTC to November 12 02:19 UTC. From the times of the observation listed above, it can be seen that the second period of Chandra observations in April (21 hr during obsid 2080) is simultaneous with XMM, as is 10 hr of the observation in November.
The Chandra data from both epochs were processed using the ciao (v3.0.1) and ftools (v5.3.1) software packages, along with calibration files from the CALDB (v2.26) release111Including the acisD1999-08-13contamN0003.fits file to correct for the time-dependent contamination on the surface of the CCDs (e.g. see Marshall et al. 2004).. We also made use of our own software for a number of the analysis tasks. The data were processed in the standard manner, including the removal of bad detector pixels and other detector artifacts, removal of events with detector ‘grades’ not equal to 0, 2, 3, 4, or 6. The selection criteria used resulted in exposures of 36 and 73 ks for the first and second segments of the April data, and 88 ks for the November observation.
The background was negligible and so no background subtraction was performed for the HETGS spectra. The mean count rates in the 0.7-8.0 keV band obtained for summed (positive and negative) 1st-orders of the Medium-Energy Grating (MEG) arm were and ct s-1 for the two segments of the April observations, and ct s-1 during the November observation. The corresponding values for the High-Energy Grating (HEG) arm were , , and ct s-1 (respectively). In the spectral analysis presented below we consider the data from obsid 2080, as this is simultaneous with the good subset of the PN observation.
2.2 The XMM Data
XMM observations of NGC 3516 were performed covering 2001 April 10 11:14 – April 11 23:02 UTC and November 09 23:13 – November 11 10:54 UTC. EPIC data utilized the thin filter with PN Prime Small Window mode. These data were processed using SAS v5.3.3. and were screened to remove hot and bad pixels and periods of high background. For the April epoch we took only the subset of PN data which were simultaneous with the second piece of Chandra coverage (April 10 17:56 - 14:53 UTC), yielding a 49 ks exposure. This is the period during which EPIC background levels were lowest, and data outside of this time range resulted in inadequate subtraction of the background spectrum. In November data screening yielded an exposure of 81 ks. At the flux level of NGC 3516 photon pileup is negligible in EPIC data. During the analysis we found the MOS spectra to have much lower signal-to-noise ratio than the PN data, thus we performed our analysis on the PN spectra alone. For the PN, instrument patterns 0 – 4 were selected and spectra were extracted from a cell diameter, centered on the source. Background spectra were extracted from a nearby region for the PN (% of the source count rate).
NGC 3516 yielded 5.48 ct s-1 during 2001 April and ct s-1 during 2001 November, over the 0.35 – 10 keV band. Table 1 shows source fluxes for the two epochs, and for the earlier LETG observation which we pulled from the archives and compared to our best-fitting model for extraction of fluxes. NGC 3516 occupied the lowest known X-ray flux state during the 2000 October and 2001 November epochs, and during the early part of the 2001 April Chandra observations (obsid2431), rising to a higher flux later in 2001 April. This time variability allowed us to track the source behavior with changing flux.
2.3 The BeppoSAX Data
BeppoSAX observed NGC 3516 2001 April 10 UT 16:05 – April 12 22:48 UTC and 2001 November 09 UT 20:27 – November 12 08:01 UTC. We utilized data from the Phoswich Detector System (PDS; Frontera et al. 1997) providing spectral data over – 200 keV. We used products from the BeppoSAX database, created using a standard data reduction using the SAXDAS software version 2.0. Data from the four PDS phoswich units were combined, after gain equalization and linearization. The instruments were switched off during SAA passages and PDS data acquired during the first 5 minutes after each SAA passage were rejected to exclude periods of highly variable risetime threshold. Standard screening of the BeppoSAX data yielded events files with effective exposure times of 40 ks (April) and 63 ks (November).
The PDS had a collimated with FWHM = 1.4 degrees. The region around NGC 3516 is free of contaminating hard X-ray sources of significant flux within this radius. The PDS instrument was rocked back and forth to obtain source and background data covering the period of the observation. The PDS rocking mode generally provides a very reliable background subtraction. We obtained, after background subtraction, 0.86 PDS cts -1 during 2001 April; 0.68 PDS cts -1 during 2001 November.
3 X-ray Spectral Analysis
3.1 Chandra Evidence for Multiple Components of Absorption
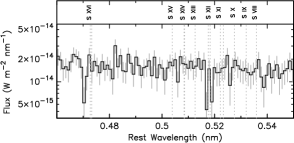
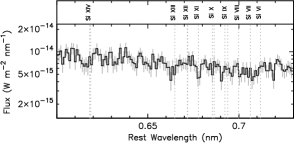
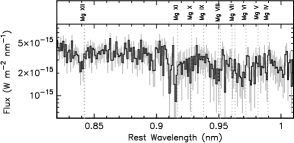
The HETGS data were compared to an absorbed continuum model which parameterized the curvature of the source, and then examined for residual features. In Fig. 1 we show some of the most interesting sections of the spectrum obtained during 2001 April, where we have combined the (flux-calibrated) -order spectra from the MEG and HEG arms and plotted the data using 0.01Å bins (corresponding to the width of the spectral resolution of the MEG, and twice that value for the HEG). Immediately evident are several deep absorption lines from highly ionized species of several elements, most notably the H-like species of Mg, Si and S.
As discussed in Section 1, based on an analysis of a Chandra Low-Energy Transmission Grating Spectrometer (LETGS) spectrum of NGC 3516 obtained on 2000 October 6, Netzer et al. (2002) argued for the presence of a relatively low-ionization (log U ) absorber, with a column density log NH 21.9. Kraemer et al. (2002) suggested the same gas was the source of the strong UV absorption lines of H i, C iv, and N v detected in contemporaneous HST/STIS medium-resolution echelle spectra. Since the 2001 April and November observations exhibited similar soft X-ray spectral characteristics, it is plausible that a column of low ionization gas (which we will refer to as the “UV component”) was still present. Assuming a sufficiently large velocity dispersion within the absorbing gas (we assume here), the ionization levels in such a component are sufficient to give rise to detectable absorption lines (due to inner-shell transitions) from Mg vii, viii, ix and Si vii, viii, ix. However, this UV component is not sufficiently-ionized to contain any H- and He-like species of these elements. Nevertheless, as can be seen from Fig. 1, we do see clear evidence for absorption lines from H-like Mg, Si and S. The presence of absorption lines from the He-like species is less clear, although the data are highly suggestive of a line due to Si xiii, and possibly also Mg xi. Thus we have strong evidence of at least one other, much more highly-ionized, component of absorption.
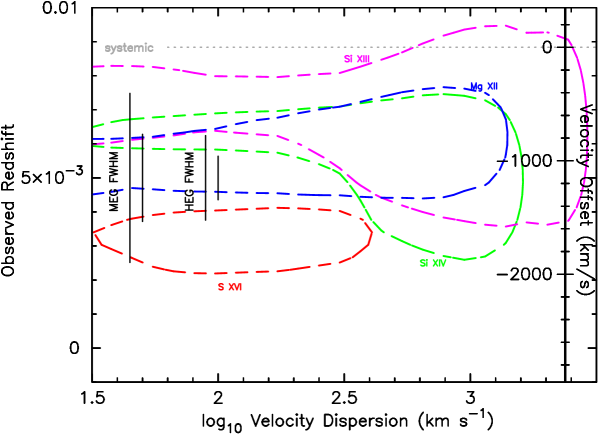
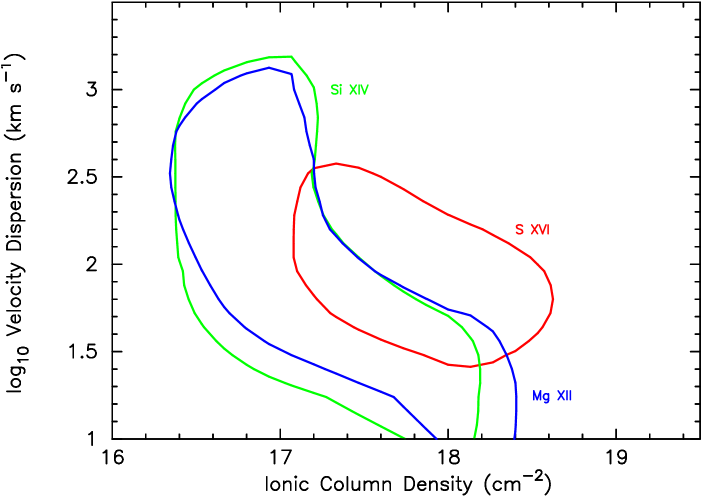
In Fig. 2 we show the kinematical constraints that can be obtained from the Mg xii, Si xiii, Si xiv, and S xvi lines (the He-like lines of Mg and S provided no useful constraints, primarily due to the signal-to-noise limitations). For this analysis we adopted the rest-wavelengths quoted in Verner, Verner & Ferland (1996),Verner et al. (1996), which are in good agreement with other compilations. Specifically for the H-like doublets (with oscillator strengths in the ratio 2:1) we assumed wavelengths of 4.7274 & 4.7328Å for S xvi, 6.1804 & 6.1858Å for Si xiv, and 8.4192 & 8.4246Å for Mg xii. For the Si xiii transition we adopted 6.6480Å. For each ion, we constructed high-resolution ’opacity spectra’ for various combinations of ionic column density, (ion), and velocity dispersion, . Fig. 3 shows the contours for ionic column density versus for these H-like lines, illustrating their significance at confidence, and the constraints attainable on ionic column and velocity dispersion.
Both absorption-line (assuming full Voigt profiles) and bound-free absorption were included in these grids, and we assumed that the absorbing material completely covers the underlying X-ray source (i.e. a covering-factor of unity). The grids were then used to construct model spectra by assuming an underlying continuum (see below). These spectra were then convolved using the instrumental spectral response and compared to the data using xspec (v.11.3.1), with the redshift of the opacity spectra (and hence the offset velocity, ) allowed to vary with respect to that expected given the recessional velocity of the host galaxy.
For the analysis presented in Fig. 2, for each ion we restricted consideration to the data within of the expected location (after correcting for the systemic velocity) of the transition, and to within the same velocity range of the corresponding bound-free edge. Given the limited signal-to-noise of the data in the vicinity of the lines, the data in the vicinity of the bound-free edge had to be included to prevent solutions in the low , very-high (ion) region of parameter-space. The MEG and HEG data within the above spectral ranges were fitted simultaneously (with the different instrumental responses taken into account). We adopted spectral bins of width 0.010 and 0.005Å for the MEG and HEG (respectively) and used a C-statistic minimization technique within xspec. In all cases a simple, smooth, underlying continuum was assumed, the normalization of which was allowed to vary during the spectral fitting.
The dashed curves in Fig. 2 show the 90% confidence regions in – space obtained from the individual Mg xii, Si xiii, Si xiv and S xvi ions. It can be seen that the results for the individual Mg xii, Si xiii and Si xiv ions are all consistent with in the range , but cannot be constrained. The results for S xvi appear to be slightly discrepant with , and . This discrepancy may be partly the result of statistical fluctuations in low signal-to-noise data or may be indicative of additional spectral complexity caused by additional kinematic components (see below). From a combined analysis of all four ions we found . By comparison, the UV absorption components show velocities up to km/s (Kraemer et al., 2002).
In contrast, the mean outflow velocity from the lower ionization S, Si and Mg lines was close to systemic, consistent with an origin within the UV absorbers. The strength of Si xi line (see Fig. 1) may indicate the presence of an additional, distinct layer of gas. However, the relative weakness of Six and Sixii features led us to question the significance of the Sixi absorption line and thus we note it but did not attempt to model it.
While Chandra grating spectra from 2001 April allowed detection of the discreet absorption lines, enabling us to pick out previously-unresolved layers of gas, there was still some ambiguity as to the physical conditions (i.e, column density and ionization) of each layer. The lines were not resolved by HETGS and thus we needed to fit the line profiles to obtain further constraints on the gas. There is a significant trade-off between the assumed turbulent velocity and the column density required to produce each line, as discussed in the next section.
Unfortunately the source was fainter during November and HETGS data from the 2001 November epoch showed no significant narrow absorption features although those data are consistent with the presence of the absorption lines found in 2001 April.
4 Modeling the Absorbers
4.1 Inputs to the Models
Our general approach to modeling is to start with a single-component absorption-model, including additional layers only as necessary. Hence, although it is entirely likely that the intrinsic absorption is more complex, we initially restricted our models to include only the two components whose footprints are clearly seen in the HETG spectra. Our next step was to generate model tables of the two zones of X-ray absorbing gas, and then we used these to fit the moderate resolution EPIC PN spectra, using the good signal-to-noise available there to constrain the broad spectral components.
The photoionization models for this study were generated using the Beta 5 version of Cloudy (G. Ferland 2003, private communication). We modeled the absorbers as single-zoned slabs of atomic gas, irradiated by the central source. We assumed a similar spectral energy distribution of the continuum radiation emitted by the central engine to that described in Kraemer et al. (2002), with the exception that we modified the spectral energy index, , above 500 eV based on our initial fitting of the 2001 April data, such that: for h 100 eV, over the range 100 eV h 500 eV, and above 500 eV. The models are parameterized in terms of the dimensionless ionization parameter , which is the ratio of ionizing photons per H atom at the illuminated face of the slab. Based on our models of the X-ray emission lines in NGC 3516 (Turner et al., 2003), we assumed solar elemental abundances (e.g. Grevesse & Anders 1989) with the exception of nitrogen, for which we adopted an N/H ratio of 2.5 times the solar value. The absorbing gas is assumed to be free of cosmic dust.
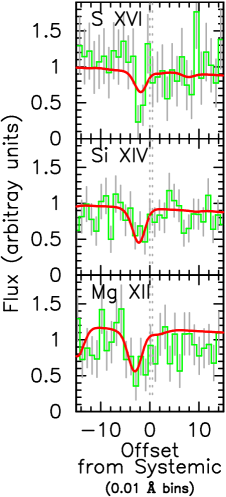
We initially generated a grid of photoionization models around values of and NH suggested by the Chandra detections of the H- and He-like lines discussed above (which we will refer to as the “High Ionization” component). For simplicity, we assumed a 300 km s-1 velocity dispersion for the model, consistent with HETG constraints on the gas, and applied the predicted ionic column densities to fit the absorption-line profiles, using the wavelengths and oscillator strengths from Behar & Netzer (2002) and Verner, Verner & Ferland (1996). The predicted Sixiv and MgXII lines from our “best-fit” model (log, Log) were compared to the Chandra spectra and showed reasonable agreement between the model and the data. Velocity spectra (Fig. 4) indicate a mean bulk velocity -1100 km s-1 for the High Ionization gas component.
While the lower-ionization inner shell lines were expected to arise in the UV absorber, the signal-to-noise in the data are too poor to allow for any detailed profile fitting. Therefore, we generated a grid of photoionization models around the values suggested by our analysis of the LETG spectra (Netzer et al., 2002). Along with the models generated for the High Ionization component, the tables of ionic column densities predicted by Cloudy were used to construct a grid of high-resolution spectra, including the effects of bound-free absorption (Verner et al., 1996), and resonance and inner shell absorption lines (Behar & Netzer, 2002). The spectral grids were used as an input to xspec in order to fit the XMM PN spectra.
4.2 Spectral fits to XMM PN data
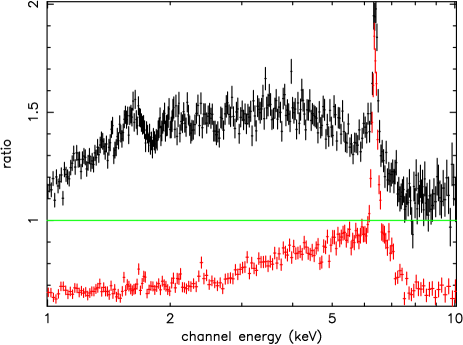
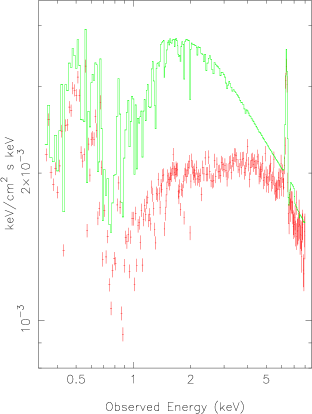
Fig. 5 shows the 2001 April and November data relative to the powerlaw model (fit across the 3-5 keV band). This illustrates the strong curvature in both spectra. It is also clear that during November, the source was fainter and more heavily absorbed. We investigated the spectral shape for both epochs in light of insight from the Chandra spectral results.
Prior to fitting we added to the model the set of emission features detected in our earlier analysis of the RGS data (Turner et al., 2003), which we suggested arose in gas outside the absorbers. Further, we discovered two emission features we had not picked up during our RGS analysis, one at 0.83 keV, which is likely an unresolved blend of Fe L-shell and high order Oviii resonance lines, and another at 1.23 keV, which is most likely the Ne ix RRC, for which we measured a width corresponding to 7.8 x 10⁻² keV. We used the xspec models zgauss and redge to parameterize these features in the model. We also included emission from the K-shell of Fe, the width was fixed to be eV and energy fixed at 6.40 keV, as determined from HEG fits (see later).
BeppoSAX data overlapped the XMM observations. The BeppoSAX data showed the spectrum of NGC 3516 to steepen to the canonical in the 10-200 keV regime covered by the PDS spectra. This is indicative of the flatness being due to (unmodeled) complex absorption or a high-energy cut-off to a flat powerlaw. In light of HETG detections of numerous absorption lines, we followed the former scenario. We found that when fitting BeppoSAX data simultaneously with PN data in xspec, the PN data almost entirely determined the fit parameters by statistical domination. Thus, to best estimate the strength of any reflection component relative to the primary spectrum, we used predominantly PN data from 3-10 keV, tying the line strength to that of the reflector. In this way we obtained an estimate of for both epochs, representing reflection from 2 steradians of material. This value was consistent with the spectral curvature observed in the BeppoSAX spectra. Therefore we included the reflected component fixed at in all subsequent spectral fits.
We constructed a model, using the parameters derived from the absorption lines for the High Ionization component and the Netzer et al. (2002) model for the UV absorber, compared to the April EPIC spectrum. The model drastically underpredicted the absorption at 2 keV and was unable to replicate the spectral curvature. Hence, there must be an additional large column of intervening gas (which we will refer to as the “Heavy” component). However, there did not seem to be any excess absorption in the soft band, which suggests that the Heavy component is in a high state of ionization (log) and that it may not fully cover the continuum source.
Including this third (Heavy) component, we refit the April spectrum. In doing so, we assumed a priori that the UV component fully covers the X-ray continuum source, as suggested by Netzer et al. (2002) and Kraemer et al. (2002), as does the High Ionization component, as required by our absorption line fits. However, we let the covering factor of the Heavy absorber component be a free parameter. The radial velocity of the High Ionization component was fixed at -1100 km s-1, as suggested by the observed energy of the H- and He-like absorption lines detected in the HETG data. The UV absorber was assumed to have an outflow velocity 200 km s-1 (the mean from the strong UV components). We set the radial velocity of the Heavy component to 1100 km s-1, however as we will show, the fit was not sensitive to the velocity. We obtained a statistically satisfactory fit with the complex model outlined above (Fig. 6a). The results are summarized in Table 2 (errors are ). Fig. 6b shows the effect of the Heavy absorber through a model plot with that component removed.
Our spectral fitting returned a solution for Heavy that includes a high ionization parameter and column density, but a covering factor of only 50%, which suggests this exists at a small radial distance, since the X-ray continuum source is 1 lt-day in extent. The other consequence is that at such a low covering fraction, any absorption lines formed in Heavy will be undetectable since the continuum is dominated by the uncovered fraction. Note that the attenuation of the transmitted continuum by Heavy amplifies this effect. For example, at the energies of the high ionization lines 1.5 – 3 keV, the uncovered continuum contributes 75% of the total flux. Hence, we have no constraint on the velocity of this component, as no discreet absorption lines are detectable with HETG.
We also tested the effects of screening of the continuum source by each of the components, as the photon input to each screen depends on any absorption of the nuclear flux by inner layers of gas. However, with such a low covering fraction we found little effect if the Heavy absorber was positioned closest to the nuclear source, with the UV and High Ionization components outside it. As this is a plausible radial ordering of the absorbers, we proceeded without worrying further about the effects of screening on the outer layers.
The UV component of the model predicts column densities for H i, 1.4 cm-2, C iv, 4.9 cm-2, and N v, 1.9 cm-2, which are in agreement with the upper limits determined from the STIS spectrum of 2000 October 1, taken when NGC 3516 was in a slightly lower flux state (Kraemer et al., 2002). While Kraemer et al. derived a lower limit for S iv of 1.8 cm2, the UV component model predicts an ionic column density only 1/100 as large, which is consistent with the presence of additional lower ionization gas along the line-of-sight to the nucleus, which does not contribute appreciably to the X-ray opacity. The High Ionization component of the model predicts an H i column density of 1.4 cm-2, which may be detectable in Ly if the absorber covered the BLR, although the predicted C iv and N v were negligible. However, while there were components of Ly at 1372 9 km s-1 and 994 16 km s-1 detected in the STIS spectrum (Kraemer et al., 2002), the presence of C iv and N v lines at these velocities suggests that the High Ionization component is not seen in the UV, hence may not cover the BLR. The fact that the ratios of the ionic columns to that of H i were anomalously low in these components rules out the possibility that the Ly lines arise in the X-ray absorber while the other lines form in lower ionization gas.
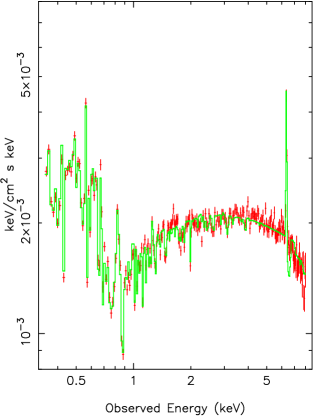
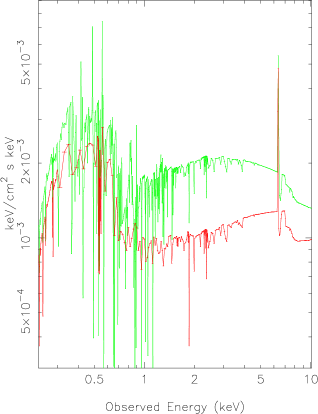
The model of Netzer et al. (2002) explains the historic spectra of NGC 3516 utilizing intrinsic absorption by the UV absorber, whose ionization changes in response to the continuum source. We modified the Netzer et al. (2002) model to account for the greater complexity in absorption than was evident from previous datasets and, having achieved a good fit to 2001 April PN data, we fit the same model to the 2001 November PN data to determine the cause of the spectral variations. The November data were consistent with no change in column density for any absorption component, although there was a slight increase in covering factor (Table 2). All three absorption zones are consistent with a decrease in ionization parameter by a factor , which would be expected as the gas responds to changes in illuminating ionizing radiation. Fig. 7 shows the best-fitting models to April and November PN data, overlaid, illustrating the spectral change.
Our final model, featuring three layers of intrinsic absorption, yielded a good fit to the overall shape of the X-ray spectrum. Another satisfactory aspect of the fit is that we recovered the canonical underlying photon index typical of AGN in the Seyfert class, and found a natural explanation for the slope observed above 10 keV in PDS data. This gave us an additional level of confidence that we had correctly explained the flat observed spectrum of NGC 3516 in this low flux state.
5 What of the Fe K Regime?
5.1 The Line Core
Having modeled the overall spectral shape we turned to a detailed examination of the residuals around 6.4 keV. From HEG data we found that comparison of the core of the Fe K line shows consistent fluxes in the 2001 April and November epochs, expected if the narrow line core is dominated by a contribution from the putative distant reflector (Fig. 8). HEG data yielded a core width eV, and energy 6.40 keV, as noted previously. The PN data, with superior signal-to-noise ratio, indicated an increase in core flux in November versus April, at confidence. If the core were simply velocity-broadened then a width of eV yields a gas velocity 1400 km/sec. This would occur for gas lying lt-days from the black hole (assumed to have mass , Wandel, Peterson, & Malkan 1999), consistent with the suggestion of variability on timescales of months. However we note a mis-match of the XMM-based model with the HEG data, suggestive that the fit to the PN spectrum missed some of the core flux in 2001 April spectra. Thus the question of core variability remains open.
5.2 The Broad Diskline
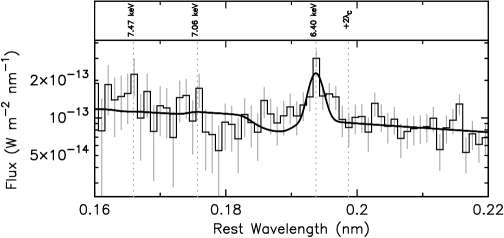
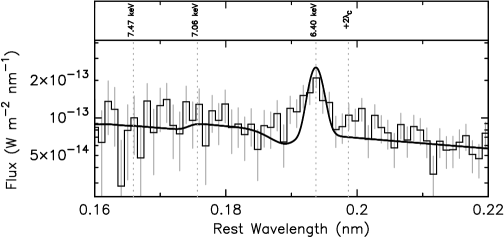
A long-standing question has been whether complex absorption of the continuum can mimic the broad red wing expected from Fe K contributions from the innermost accretion disk. It is clear that with our complex absorption model, whatever small excess of flux exists redward of 6.4 keV is not obviously characteristic of a diskline (Fig. 9a,b).
We attempted to fit the April “excess” using the xspec model of a diskline following the prescription of Stella (1990) for a non-spinning black hole. This model produced an improvement with inner and outer radii fixed at 6 and 1000 gravitational radii, respectively, disk inclination fixed at and emissivity index at . The line energy was keV, equivalent width eV. Thus we conclude the data are consistent with the presence of a substantial diskline, although the spectra do not provide compelling evidence for such.
5.3 Red or blue-shifted narrow components of Fe K emission
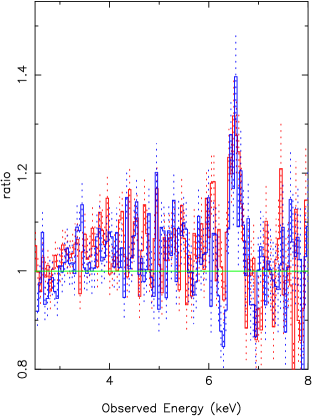
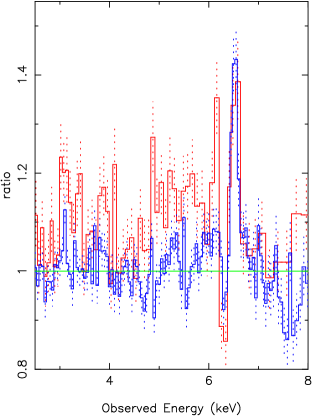
Turning to the question of narrow line emission, we examined the spectra for narrow red or blueshifted Fe k components, as reported previously for this source (Turner et al. 2002, Bianchi et al. 2004). We split the PN data from 2001 April, dividing the spectra ksec into the 49 ksec exposure, splitting the good interval into two sections, between which the source flux increased by .
Fig. 9a and b show the Fe K profile from the two time-selections sampling changes in flux within each epoch of data. There is evidence for a very weak feature at rest-energy 6.08 keV, which was reported by Bianchi et al. (2004). As previously reported for November data (Turner et al., 2002), spectral variability is evident in the Fe K regime down to timescales of a few tens of ksec and these are possibly related to changes in continuum flux. While it is tempting to attribute the variable spectral shape in the Fe K regime (most evident in November) to changes in a broadened line from the accretion disk, our insight from HEG spectra leads us to attribute this variability to rapid (tens of ksec or less) changes in the energy-shifted narrow components of Fe K. We also note the presence of additional varying features not previously reported, e.g. close to 3 keV (Fig. 9b). While it is tempting to speculate on their origin, much longer XMM observations are needed to progress on reliably characterizing the line identifications and behaviors.
6 Discussion and Conclusions
6.1 Nature of the Absorbers
We find a model for NGC 3516 which has three intrinsic layers of absorption with significantly different columns and ionization-states, and, when determined, outflow velocities. The UV absorber has previously been detected in both UV and soft X-ray regimes. A High Ionization absorber is required to produce the strong H- and He-like Mg, Si, and S lines detected in the 2001 April HETG spectrum. Finally, the Heavy absorber has been detected previously but we find the first constraint on its covering fraction.
The first evidence for the Heavy component came from Ginga data taken when NGC 3516 was observed several times in flux-states close to that found for 2001 April. In their modeling of the complex X-ray absorption detected in these data, one of the solutions suggested by Kolman et al. (1993) included a warm component which introduced an additional iron edge at 7.5 keV, with a column of a few . Using the same dataset, Nandra & Pounds (1994) determined the iron edge energy to be ke V and derived a warm absorber column density similar to that suggested by Kolman et al. The ionization-state suggested by the Ginga results is similar to the Heavy component in our models. Costantini et al (2000) also found the presence of a large column of highly ionized gas in BeppoSAX spectra, although at this is different to the Ginga solution and resembles our High Ionization rather than our Heavy component. Since the High Ionization component would be undetectable at low resolution if a significantly larger column of gas were present, the discrepancy may indicate that the Heavy column was absent during the earlier BeppoSax observations.
Based on our models, we can determine the densities, , of the High Ionization and Heavy components as a function of their radial distance, . For the High Ionization absorber, log 1.7, hence for a luminosity in ionizing photons of s-1 (Kraemer et al., 2002), , while for the Heavy absorber, log 1.2 and . Although we cannot deconvolve the densities and distances of the absorbers, it is implausible that the physical depth of the absorbers ( nH/NH) could be more than a small fraction of their radial distance. For example, for the High Ionization component, if 0.1 then nH 2.5 x 106 cm-3 and cm, which is approximately equal to the lower limit derived for the UV absorber (Kraemer et al., 2002). The same line of reasoning suggests that the Heavy component lies somewhat closer to the central black hole, which is consistent with partial covering. In fact, since the size of the X-ray continuum source is light-day, one might expect the radial distance of the Heavy absorber to be of the same order of magnitude. Alternatively, partial covering may result if the absorber is patchy or filamentary.
Although we cannot constrain the densities of the Heavy and UV components, the ratios of their mean electron temperatures to their ionization parameters can be used to estimate their relative thermal pressure. The model predicts T 105.63 K, 105.99 K and 104.44 K for the Heavy, High Ionization, and UV absorbers, respectively. The thermal pressure of the UV absorber is 6 times that of the Heavy absorber and 9 times that of the High Ionization absorber. Hence, these three components cannot be in thermal equilibrium with respect to each other. To examine the thermal stability of the absorbers, in Fig. 10 we show the relationship of T and the so-called “pressure” ionization parameter U/T (generally known as an S-Curve). As discussed most recently in Krolik & Kriss (2001), there are two regions where a photoionized gas is stable to thermal perturbations: at low ionization/temperature, when line cooling is efficient, and high ionization/temperature, when thermal balance is achieved via Compton processes. In the intermediate region, the gas can be unstable if . There is no such region for our models, in part due to the additional cooling provided by the over-abundance of nitrogen (in contrast, see the S-curve in Kraemer et al. 2002). Nevertheless, as a result of the large changes in temperature which result from small changes in , the intermediate region is only marginally thermally stable (for a more detailed discussion, see Krolik & Kriss 2001). While the UV absorber is within the line-cooled region, the two highly ionized components lie in the intermediate region, and should undergo large changes in temperature in response to variations in the incident continuum.
Given the high ionization state of the High Ionization and Heavy absorbers, they are quite transparent to the incident continuum, with the main source of opacity being bound-free transitions from highly ionized O, Ne, Mg, Si, S, and Fe. Our models predict an average force multiplier, the ratio of the radiation pressure force from all absorption and scattering process to that caused by Compton scattering, 3. As a consequence, the central source would have to be radiating at roughly 30% of its Eddington Luminosity in order to generate a radiatively driven outflow. Also, our models predict mean temperatures which are too low for a thermal wind to achieve such a high velocity (Balsara & Krolik, 1993). This suggests the possibility that these absorbers are associated with an MHD wind (e.g., Emmering, Blandford, & Shlosman 1992). As noted above, their high ionization state strongly suggests an origin close to the continuum source and Emmering, Blandford, & Shlosman (1992) predict that the outflow velocity in an MHD flow should increase as the radial distance of the launch pad decreases. Furthermore, based on their models of MHD flows in the BLR gas in NGC 5548, Bottorff et al. (1997a) predict line-of-sight velocities of the same order as that observed for the High Ionization absorber. Finally, as discussed above, these absorbers are only marginally thermally stable, although they appear to have been present in earlier observations. If the absorbers were permeated by magnetic fields of sufficient strength (i.e., on the same order as their thermal pressure), the magnetic pressure would act to stabilize them (Bottorff, Korista, & Shlosman, 2000). The presence of internal magnetic fields would also suggest an MHD origin.
In principal, given the line-of-sight distance of the absorber from the black hole, the line-of-sight velocity of the material, the disk orientation with respect to the observer, and the black hole mass, it may be possible to constrain parameters of a Blandford & Payne (1982) type MHD disk wind model applied to NGC 3516. This is the subject of future research efforts. We note that an early attempt to constrain Blandford & Payne (1982) model parameters in NGC 5548, using its BLR Civ emitting region, is described in Bottorff et al. (1997b) and was relatively successful in describing emission line shape and variability. This model was extended to the UV/X-Ray warm absorber of NGC 5548 but analysis was hampered by the then relatively low resolution X-Ray data of the pre-Chandra, pre-XMM era (Bottorff, Korista, & Shlosman, 2000). We also note that the masses of the black holes in NGC 3516 and NGC 5548 are similar. It would therefore be tempting to directly apply the results of the NGC 5548 model to NGC 3516. We caution however that slight differences in Blandford & Payne (1982) MHD flow parameters and/or orientation can lead to large differences in the radial velocity and line-of-sight position of absorbing material.
6.2 The Fe Emission
We note with interest the remarkable similarity between the Fe K profile of NGC 3516 and that of Mrk 766 (Pounds et al. 2003a,Turner et al. 2003). Mrk 766 and NGC 3516 are two of very few Seyfert galaxies known to exhibit narrow and highly-redshifted Fe emission lines (Turner et al. 2002, Turner et al. 2003). Another similarity is that Mrk 776 also shows evidence for a large column of ionized gas (Pounds et al., 2003a) with . If the emission is from ionized Fe then it would be natural to expect the heavy absorption and emission from ionized Fe to be observationally linked. It may be that we can only see the weak narrow Fe lines in sources with the largest columns of circumnuclear gas. If the narrow redshifted Fe emission lines (Turner et al., 2002) do originate in the highly-ionized gas components then previous speculations will have underestimated their velocity. The emission from the K-shell of Fe in NGC 3516 is expected to peak at Fe xx ( keV), perhaps raising estimates of the outflow velocity for the emitting gas responsible for the shifted features reported by Turner et al. (2002) up to , much higher than outflow velocities estimated for the absorption lines reported here.
Other AGN have shown evidence for zones of high-ionization gas, e.g. NGC 3783 (Reeves et al., 2004) which shows an Fe resonant absorption line, where again, the inclusion of the absorber significantly reduces the inferred equivalent width of any broad component to the diskline. Even higher column () outflows of gas have also been suggested with outflow velocities up to 0.1 in QSOs such as PG 1211 (Pounds et al., 2003b), PDS 456 (Reeves et al., 2003) and the NLSy1 NGC 4051 (Pounds et al., 2004). In those cases the column density is high enough that absorption edges + Fe K-shell resonant absorption lines can be detected.
While current data leave us tantalizingly close to answering the question as to whether high-column, high-ionization absorbers are masquerading as broad disklines, a conclusive answer will have to wait until long exposures are taken on AGN using the microcalorimeter on ASTROE-2.
7 Acknowledgments
We are grateful to Luigi Piro and the BeppoSAX satellite operation team for arranging simultaneous BeppoSAX coverage of NGC 3516 at short notice, to cover the XMM observations. We also thank the XMM and Chandra satellite operation teams. Thanks to Michael Crenshaw for useful discussions. T.J. Turner acknowledges support from NASA grant GO1-2099B.
| Epoch | 2-10 keVaaFluxes as ergs cm-2 s-1 in units of 10-11. | 0.5-10 keVaaFluxes as ergs cm-2 s-1 in units of 10-11. | 7 keVbbFluxes as keV cm-2 s in units of 10-3. |
|---|---|---|---|
| Observed fluxes | |||
| 2000 Oct | 1.04 | 1.23 | 0.78 |
| 2001 April | 2.27 | 2.70 | 1.72 |
| 2001 Nov | 1.63 | 1.92 | 1.35 |
| Absorption-Corrected Fluxes | |||
| 2000 Oct | 1.42 | 2.17 | 0.82 |
| 2001 April | 2.95 | 4.75 | 1.82 |
| 2001 Nov | 2.22 | 3.39 | 1.45 |
| Absorption-Corrected PowerLaw Flux | |||
| 2000 Oct | 1.21 | 1.95 | 0.61 |
| 2001 April | 2.72 | 4.50 | 1.62 |
| 2001 Nov | 1.89 | 3.05 | 1.15 |
| 2001 April | 2001 Nov | |
|---|---|---|
| 1.82 | 1.77 | |
| Cov aaFraction of nuclear source covered by the heavy absorber | 44% | 58% |
| Log NH,UV | 21.85 | 21.60 |
| Log UUV | 0.80 | 0.99 |
| Log NH,hi | 22.2bb denotes that a parameter was fixed in the fit | 22.2 |
| Log Uhi | 1.7 | 1.5 |
| Log NH,heavy | 23.40 | 23.40 |
| Log Uheavy | 1.21 | 1.09 |
| (keV) | 6.40 | 6.40 |
| ccPhotons in the line in units 10-5 | 3.64 | 4.91 |
| 1801/1521 | 3248/2770 |

References
- Balsara & Krolik (1993) Balsara, D.S., & Krolik. J.H. 1993, ApJ, 402, 109
- Begelman, McKee, & Shields (1983) Begelman, M.C., McKee, C.F., & Shields, G. A. 1983, ApJ, 271, 70
- Behar & Netzer (2002) Behar, E., Netzer, H., 2002, ApJ, 570, 165
- Blandford & Payne (1982) Blandford, R.D., & Payne, D.G. 1982, MNRAS, 199, 883
- Bianchi et al. (2004) Bianchi, S., Matt, G., Balestra, I., Guainazzi, M., Perola, G.C., 2004, astro-ph/0404308
- Bottorff et al. (1997a) Bottorff, M.C., Korista, K.T., Shlosman, I., & Blandford, R.D. 1997, in Mass Ejection from Active Galactic Nuclei, ASP Conf. Series 128, eds. N. Arav, I. Shlosman, & R.J. Weymann (San Francisco: ASP), 270
- Bottorff et al. (1997b) Bottorff, M.C., Korista, K.T., Shlosman, I., & Blandford, R.D. 1997, ApJ, 479, 200
- Bottorff, Korista, & Shlosman (2000) Bottorff, M.C., Korista, K.T.,& Shlosman, I. 2000, ApJ, 537, 134
- Bromage et al. (1985) Bromage, G.E., et al. 1985, MNRAS, 251, 1
- Chelouche & Netzer (2001) Chelouche, D., & Netzer, H. 2001, MNRAS, 326, 916
- Costantini et al. (2000) Costantini, E. et al. 2000, ApJ, 544, 283
- Crenshaw & Kraemer (1999) Crenshaw, D.M., & Kraemer, S.B. 1999, ApJ, 521, 572
- Crenshaw, Kraemer, & George (2003) Crenshaw, D.M., Kraemer, S.B., & George, I.M. 2003, ARA&A, 41, 117
- Crenshaw, Maran, & Mushotzky (1998) Crenshaw, D.M., Maran, S.P., & Mushotzky, R.F. 1998, ApJ, 496, 797
- Crenshaw et al. (1999) Crenshaw, D.M., Kraemer, S.B., Boggess,A., Maran, S.P., Mushotzky, R.F., & Wu, C.-C. 1999, ApJ, 516, 750
- Crenshaw et al. (2000) Crenshaw, D.M., Kraemer, S.B., Hutchings, J.B., Danks, A.C., Gull, T.R., Kaiser, M.E., Nelson, C.H., & Weistrop, D. 2000, ApJ, 545, L27
- de Kool & Begelman (1995) de Kool, M., & Begelman, M.C. 1995, ApJ, 455, 448
- Emmering, Blandford, & Shlosman (1992) Emmering, R.T., Blandford, R.D., & Shlosman, I. 1992, ApJ, 385, 460
- Frontera et al. (1997) Frontera, F., Costa, E., Dal Fiume, D., Feroci, M., Nicastro, L., Orlandini, M., Palazzi, E., Zavattini, G. 1997, SPIE 3114, 206
- Garmire et al. (2003) Garmire, G. P., Bautz, M. W., Ford, P. G., Nousek, J. A. Ricker, George R., 2003, in X-Ray and Gamma-Ray Telescopes and Instruments for Astronomy, eds J. E. Truemper & H. D. Tananbaum, SPIE 4851, 28
- George et al. (1998) George, I.M., Turner, T.J., Netzer, H., Nandra, K., Mushotzky, R.F., & Yaqoob, T. 1998, ApJS, 114, 73
- Grevesse & Anders (1989) Grevesse, N., & Anders, E. 1989, in Cosmic Abundances of Matter, ed. C.J. Waddington (New York: AIP), 1
- Kaspi et al. (2000) Kaspi, S. et al. 2002, ApJ, 574, 643
- Keel (1996) Keel, W.C., 1996, AJ, 111, 696
- Kolman et al. (1993) Kolman, M., Halpern, J.P., Martin, C., Awaki, H., & Koyama, K. 1993, ApJ, 403, 592
- Konigl & Kartje (1994) Konigl, A., & Kartje, J. 1994, ApJ, 424, 446
- Koratkar et al. (1996) Koratkar, A. et al. 1996, ApJ, 470, 378
- Kraemer, Crenshaw, & Gabel (2001a) Kraemer, S.B., Crenshaw, D.M., & Gabel, J.R. 2001a, ApJ, 557, 30
- Kraemer et al. (2001b) Kraemer, S.B., et al. 2001b, ApJ, 551, 671
- Kraemer et al. (2002) Kraemer, S. B., Crenshaw, D. M., George, I. M., Netzer, H., Turner, T. J., Gabel, J. R., 2002, ApJ, 577, 113.
- Kriss et al. (1996) Kriss, G.A. et al. 1996, ApJ, 467, 629
- Krolik & Kriss (2001) Krolik, J.H, & Kriss, G.A. 2001, ApJ, 561, 684
- Laor (1991) Laor, A., 1991, ApJ, 376, 90
- Marshall, Dewey & Ishibashi (2004) Marshall, H. L., Dewey, D., Ishibashi, K., 2004, in X-Ray and Gamma-Ray Instrumentation for Astronomy XIII, eds. K.A. Flanagan, O.H.W. Oswald, SPIE 5165, 457.
- Marshall et al. (2004) Marshall, H. L.,Tennant, A., Grant, C. E., Hitchcock, A. P., O’Dell, S. L., Plucinsky, P. P., in X-Ray and Gamma-Ray Instrumentation for Astronomy XIII, eds. K.A. Flanagan, O.H.W. Oswald, SPIE 5165, 497
- Mathur, Wilkes, & Aldcroft (1997) Mathur, S., Wilkes, B.J., & Aldcroft, T. 1997, ApJ, 478, 182
- Mathur et al. (1994) Mathur, S., Wilkes, B., Elvis, M., & Fiore, F. 1994, ApJ, 434, 493
- Murray & Chiang (1995) Murray, N. & Chiang, J. 1995, ApJ, 454, L105
- Nandra & Pounds (1994) Nandra, K., Pounds, K.A. 1994, MNRAS, 268, 405
- Netzer et al. (2002) Netzer, H., Chelouche, D., George, I. M., Turner, T. J., Crenshaw, D. M., Kraemer, S. B., Nandra, K., 2002, ApJ, 571, 256.
- Netzer et al. (2003) Netzer, H. et al. 2003, ApJ, 599, 933
- Proga (2003) Proga, D. 2003, ApJ, 585, 406
- Proga, Stone & Kallman (2000) Proga, D., Stone, J.M., & Kallman, T.R. 2000, ApJ, 543, 686
- Pounds et al. (2003a) Pounds, K.A., Reeves, J.N., Page, K.L., Wynn, G.A., O’Brien, P.T., 2003, MNRAS, 342, 1147
- Pounds et al. (2003b) Pounds, K.A., Reeves, J.N., King, A.R., Page, K.L., O’Brien, P.T., Turner, M.J.L., 2003, MNRAS, 346, 1025
- Pounds et al. (2004) Pounds, K.A., Reeves, J.N., King, A.R., Page, K.L., 2004, MNRAS, 350, 10
- Reeves et al. (2003) Reeves, J.N., O’Brien, P.T., Ward, M.J., 2003, ApJ, 593, 65
- Reeves et al. (2004) Reeves, J.N., Nandra, K., George, I. M., Pounds, K. A., Turner, T. J., Yaqoob, T. 2004, ApJ, 602, 648
- Reynolds (1997) Reynolds, C.S. MNRAS, 286, 513
- Stella (1990) Stella, L., 1990, Natur. 344, 747
- Turner et al. (2002) Turner, T.J., Mushotzky, R.F., Yaqoob, T., George, I.M., Snowden, S.L., Netzer, H., Kraemer, S.B., Nandra, K., Chelouche, D., 2002, ApJ, 574, 123
- Turner et al. (2003) Turner, T.J., Kraemer, S. B., Mushotzky, R.F., George, I.M., Gabel, J.R., 2003, ApJ, 594, 128
- Ulrich & Boisson (1983) Ulrich, M.-H., & Boisson, C. 1983, ApJ, 267, 515
- Verner, Verner & Ferland (1996) Verner, D. A., Verner, E. M., Ferland, G. A., 1996, Atomic Data Nucl. Data Tables, 64, 1
- Verner et al. (1996) Verner, D.A., Ferland, G.A., Korista, K.T., Yakovlev, D. G. 1996, ApJ, 465, 487
- Voit, Shull, & Begelman (1987) Voit, G.M., Shull, J.M., & Begelman, M.C. 1987, ApJ, 316, 573
- Walter et al. (1990) Walter, R., Ulrich, M.H., Courvoisier, T., J.-L., & Buson, L.M. 1990 A&A, 233, 53
- Wandel, Peterson, & Malkan (1999) Wandel, A., Peterson, B.M., & Malkan, M.A. 1999, ApJ, 526, 579