Multi-wavelength observations of the Galactic black hole transient 4U 154347 during outburst decay: state transitions and jet contribution
Abstract
Multiwavelength observations of Galactic black hole (GBH) transients during the state transitions and in the low/hard state may provide detailed information on the accretion structure of these systems. 4U 154347 is a GBH transient that was covered exceptionally well in X-ray and infrared (daily observations) and reasonably well in optical and radio during its outburst decay in 2002. When all the available information is gathered in the intermediate and the low/hard state, 4U 154347 makes an important contribution to our understanding of state transitions and the role of outflows on the high energy emission properties of black hole binaries. The evolution of the X-ray spectral and temporal properties and the IR light curve place strong constraints on different models for explaining the overall emission from accreting black holes. The overall spectral energy distribution is consistent with synchrotron origin for the optical and infrared emission, however, the X-ray flux is above the power-law continuation of the optical and infrared flux. The infrared light curve, the HEXTE light curve and the evolution of the X-ray photon index indicate that the major source of hard X-rays cannot be direct synchrotron radiation from an acceleration region in a jet for most of the outburst decay.
Subject headings:
black hole physics – X-rays:stars – accretion, accretion disks – binaries:close – stars:individual (4U 154347)1. Introduction
Galactic black hole (GBH) transients are binary systems that can show orders of magnitude increases in luminosity during outbursts caused by sudden, dramatic increases of mass accretion onto compact objects. During an outburst, a GBH transient often follows a specific sequence of X-ray spectral states; it is in the “hard” or “low-hard” state (LH) at the beginning, and also during the decay of an outburst. In between the rise and the decay, when the 2–10 keV luminosity is high, the system is usually in the “thermal dominant” state (TD, historically this state was called high/soft state), and sometimes in the “steep power-law state (historically very-high state, see McClintock & Remillard, 2003, for detailed discussion of spectral states). They can also be found in intermediate states (IS), where source characteristics do not fit into the TD, or LH states, but show various combinations of these states, especially close to state transitions (McClintock & Remillard, 2003). The sequence of spectral states might be complicated, or very simple as some sources stay in the LH state throughout their outbursts (Brocksopp, Bandyopadhyay & Fender, 2004; Kalemci, 2002, and references therein). However, they are almost always found in the LH state during outburst decay (Kalemci, 2002), before they return to their quiescent states (perhaps a continuation of the LH state at very low luminosities, Tomsick, Kalemci & Kaaret 2004; Kong et al. 2002; Corbel et al. 2000).
In terms of timing, the TD state is characterized by a lack of, or a very low level of variability (a few % rms in 0.04–4 Hz), whereas the LH state shows strong variability (30% rms in the same band), along with quasi-periodic oscillations (QPOs) in the power-density spectrum (PDS). Other Fourier-analysis related timing tools such as “coherence” and “lag” behavior are also different in each state (see Vaughan & Nowak 1997; Nowak et al. 1999 for detailed definitions of these quantities). The mean coherence is very high (1) in the LH state and the mean lag is either zero or very low between the 3–6 keV and 6–15 keV bands in the 1–10 Hz band. During the IS and during transitions, however, the coherence is lower and the lag is higher in the same frequency band and between the same energy bands (Kalemci, 2002; Pottschmidt et al., 2000).
The relation between the radio emission and the X-ray states has been well established (McClintock & Remillard 2003, see also Corbel et al. 2004, and a recent review by Fender 2003). In the TD state, the radio emission is often quenched (Fender et al., 1999; Corbel et al., 2000). Optically thin outflows are sometimes detected during state transitions (Fender & Kuulkers, 2001; Corbel et al., 2001), and powerful, compact jets are always observed in the LH state (Fender, 2001). In addition, there exists a global correlation between the X-ray flux and the radio flux for different sources at different luminosities in the LH state (Corbel et al., 2003; Gallo, Fender & Pooley, 2003). The base of the jet might provide the energetic electrons that would create the X-ray power-law in the spectrum, establishing the link between the radio and X-ray flux (Fender, 2001). The fact that the lags are higher during state transitions, when the optically thin, large outflows are observed, may also point out a relation between the radio jet and energetic electrons (Kalemci et al., 2003; Pottschmidt et al., 2000). An alternative model is that the X-ray emission is synchrotron in nature and comes directly from a shock region in the jet (Falcke & Biermann, 1999; Markoff, Falcke & Fender, 2001). This model can explain the radio - X-ray flux correlation naturally; however, it lacks any prediction on the details of X-ray spectrum 111Only recently, the reflection from the disk has been incorporated into the synchrotron jet model by Markoff & Nowak (2004). See also Körding & Falcke (2004) on a recent work on timing properties from this model..
The daily observations of the transients in the optical and the infrared (OIR) by the YALO consortium (Bailyn et al., 1999) provided another dimension in the study of GBHTs. A secondary maximum in , , , , and bands has been observed during the outburst decay of 4U 154347 (Buxton & Bailyn, 2004). A similar secondary maximum has also been observed in , and bands during the outburst decay of XTE J1550564 in 2000 (Jain et al., 2001a). The properties of the optical emission during the secondary maximum of the 2000 outburst of XTE J1550564 indicate a synchrotron origin from a jet (Corbel et al., 2001), rather than X-ray reprocessing at the outer parts of the accretion disk, which was suggested to explain the optical light curves of the same source in the 1998 outburst (and also other GBH transients, Jain et al., 2001a, b). The X-ray reprocessing for the origin of optical emission was also questioned by Brocksopp, Bandyopadhyay & Fender (2004) because of a lack of correlation between X-ray and the optical light curves of V404 Cyg, GRO J171924, GRO J042232, GS 135464 and XTE J1118480. The observations of GX 3394 in the optical and the near infra-red (nIR) in the LH state showed a non-thermal optically thin synchrotron component that extrapolates down to the X-ray spectrum (Corbel & Fender, 2002). A very recent study on GX 3394 with good optical, infrared and X-ray monitoring campaign points out that the nIR has a synchrotron origin from a jet in the LH state, however the origin of optical emission may be a combination of jet, disk and possibly a compact corona for this source (Homan et al., 2004). In addition, the LH state during the rise of the 2002 outburst of GX 3394 showed a strong correlation between X-ray flux and optical / nIR, similar to the radio - X-ray flux correlation (Homan et al., 2004).
One of the most interesting epochs of an outburst is its decay, because it is almost guaranteed that there will be a transition to the LH state which provides additional information about the system through various timing analysis techniques, and also through strong radio emission. Analysis of state transitions helps us probe the accretion dynamics of these systems. Our group has been observing GBH transients during outburst decays in X-rays with the Rossi X-ray Timing Explorer (RXTE) and in radio to understand the evolution before, during and after the transition to the LH (Kalemci et al., 2001; Tomsick, Corbel & Kaaret, 2001; Kalemci et al., 2003; Tomsick et al., 2003). A uniform analysis of all GBH transients observed with approximately daily coverage with RXTE between 1996 and 2001 resulted in a better understanding of the evolution of spectral and temporal parameters during the outburst decay (Kalemci et al., 2004). The most striking of all results is that the sharpest change indicating a state transition is observed in the timing properties (usually a jump in the rms amplitude of variability from less than a few percent to more than tens of percent in less than a day). This change in the rms amplitude is often (but not always) accompanied by a sharp increase in the power-law flux. This sharp change in rms amplitude of variability is noted as the time of state transition in Kalemci et al. (2004), and the same will be applied here.
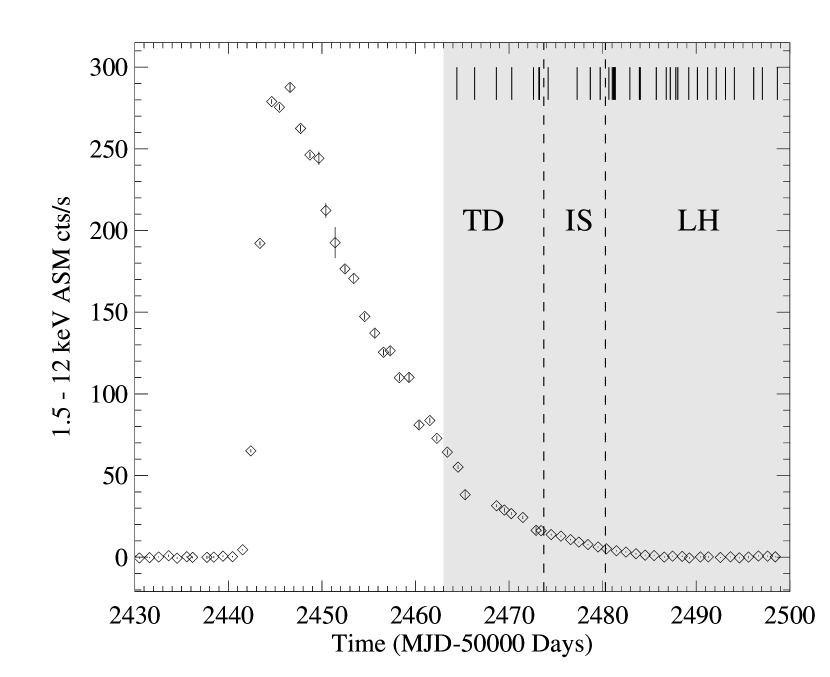
In this work, we will try to obtain a coherent picture of changes in physical properties of a GBH transient, 4U 154347, around state transitions and also deep in the LH state using multi-wavelength observations. 4U 154347 was discovered by the Uhuru satellite on August 17, 1971 (Matilsky et al., 1972). The source was observed again in outburst, in 1983, 1992, and also in 2002 (Kitamoto et al., 1984; Harmon et al., 1992; Brocksopp, Bandyopadhyay & Fender, 2004; Miller & Remillard, 2002). The optical counterpart was found by Pedersen (1983). Initial dynamical mass measurements during quiescence established this source as a black hole binary system with a compact object mass between 2.7 and 7.5 (Orosz et al., 1998). A more accurate value of is given in Park et al. (2004) based on a work in preparation by Orosz et al. The 2002 outburst was first detected by the All Sky Monitor (ASM) on RXTE on MJD 52442 (Miller & Remillard, 2002; Park et al., 2004). Around a month later, as the outburst was decaying, our group started its daily monitoring campaign with RXTE, and caught the transition to a harder state on MJD 52479 (Kalemci et al., 2002), although subsequent analysis in this work indicates that the transition started earlier. The analysis of RXTE data before the LH state, with an emphasis on broad iron reflection lines, is given by Park et al. (2004). Fig. 1 shows the ASM light curve of the overall outburst, the epoch we analyzed, and the dates of pointed observations used in this work. The source was also detected and observed in radio and optical bands (see Park et al., 2004; Buxton & Bailyn, 2004, 2.3, and 2.2 in this work for more details). Here, we report on the RXTE observations during outburst decay, and combine the results with the optical, IR and radio information to understand jet formation and its effects on spectral and temporal properties of 4U 154347.
2. Observations and Analysis
2.1. The RXTE observations
We triggered our monitoring program (P70124, PI Tomsick) with RXTE after the source’s ASM count rate dropped below 15 cts/s, and the first observation took place on MJD 52478.7. The source was already in transition from the TD to the LH state, showing broad band variability and QPOs (Kalemci et al., 2002). While the daily 1-3 ks monitoring from the program P70124 was going on, we triggered P70128 (PI Kalemci) which provided longer exposures (20 ks) to investigate spectral and temporal properties of the source in greater detail than the daily monitoring observations. For this work, we used the long observations, and the first 18 observations of the monitoring program that provide high quality spectral information. A very interesting part of the outburst, the onset of state transition, occurred before our monitoring observations had begun. To characterize this part, we used archival RXTE observations from P70133 (PI McClintock). Table 1 shows the list of the observations that we used in this work.
| Obs.#222A for observations from P70133 (PI McClintock), B for observations from P70124 (PI Tomsick), and C for observations from P70128 (PI Kalemci). Observation 14 from P70128 is divided into four. | Date | Power-law flux333in units of | DBB flux444in units of | Notes | ||
| 1A | 52464.42 | |||||
| 2A | 52466.32 | |||||
| 3A | 52468.64 | |||||
| 4A | 52470.28 | |||||
| 5A | 52472.61 | |||||
| 6A | 52473.19 | |||||
| 7A | 52473.25 | |||||
| 8A | 52474.17 | Variability, state transition 555The line above indicates a transition to the IS from TD state | ||||
| 9A | 52477.27 | QPO | ||||
| 10B | 52478.68 | QPO | ||||
| 11B | 52479.74 | QPO | ||||
| 12B | 52480.66 | Spectral hardening, QPO 666The line above indicates a transition from IS to LH state. | ||||
| 13C | 52481.03 | High energy cut-off, QPO | ||||
| 14C.a | 52481.16 | High energy cut-off, QPO | ||||
| 14C.b | 52481.23 | High energy cut-off, QPO | ||||
| 14C.c | 52481.29 | High energy cut-off, QPO | ||||
| 14C.d | 52481.36 | High energy cut-off ?, QPO | ||||
| 15B | 52482.91 | 0.35 | Smedge optical depth begins to drop, the disk temperature is fixed from this observation on. | |||
| 16B | 52483.93 | 0.35 | IR flux begins to rise | |||
| 17B | 52484.03 | 0.35 | ||||
| 18B | 52485.74 | 0.35 | ||||
| 19B | 52486.80 | 0.35 | ||||
| 20C | 52487.23 | 0.35 | MOST radio detection. | |||
| 21C | 52487.82 | 0.35 | ||||
| 22B | 52488.03 | 0.35 | Smedge is not required, Galactic ridge emission (5% of the total flux) is included | |||
| 23B | 52489.20 | 0.35 | ||||
| 24B | 52490.13 | 0.35 | Only PCA used from this obs on. ATCA radio detection. | |||
| 25B | 52491.22 | 0.35 | ||||
| 26B | 52492.14 | 0.35 | No timing after this observation, poor statistics. | |||
| 27B | 52493.13 | 0.35 | Galactic ridge emission 15% of the total flux. | |||
| 28B | 52494.08 | 0.35 | ||||
| 29B | 52496.14 | 0.35 | Galactic ridge emission 25% of the total flux. | |||
| 30B | 52497.07 | 0.35 | ||||
| 31B | 52498.67 | 0.35 |
2.1.1 X-ray spectral analysis
For the major part of the outburst, we used both the PCA and the HEXTE instruments on RXTE for the spectral analysis (see Bradt, Rothschild & Swank 1993 for instrument descriptions). For the PCA, the 3–25 keV band was used, and the response matrix and the background model were created using the standard FTOOLS (version 5.3) programs. We added 0.8% up to 7 keV, and 0.4% above 7 keV as systematic error based on the fits to Crab observations close to our observations (for the details of how we estimated systematic uncertainties, see Tomsick, Corbel & Kaaret, 2001). We used all available PCUs for each observation, choosing the combination that would provide the maximum number of counts.
The 15–200 keV band was used for the HEXTE data. We used the response created by the FTOOLS, and applied the necessary deadtime correction (Rothschild et al., 1998). The HEXTE background subtraction is performed by alternating between observations of source and background fields. The relative normalization between the PCA and the HEXTE is kept free. The HEXTE data was included in the spectral analysis until MJD 52489. After this date, the statistical quality of the HEXTE data was poor and was not included in the analysis. We are presenting the first analysis of the HEXTE data for this source.
For all the observations, our first spectral model consisted of absorption (“phabs” in XSPEC), smeared edge (“smedge” in XSPEC, Ebisawa et al., 1994), a multicolor disk blackbody (“diskbb” in XSPEC, Makishima et al., 1986), a power law (“pegpower” in XSPEC), and a narrow Gaussian to model the iron line. This model has been commonly used for the spectral analysis of GBHs in the LH state (Tomsick & Kaaret, 2000; Sobczak et al., 2000). A difference between our analysis and that of Park et al. (2004) is the modeling of the iron line. For most of our observations, the statistical quality of the data is not sufficient for reliable iron line studies, and including a narrow line instead of a broadened Laor model iron line (Laor, 1991) yielded acceptable fits. For consistency and simplicity, we left the iron line narrow, and we did not deduce any physical results from the iron line fits. The hydrogen column density was fixed to , as used by Park et al. (2004). The smeared edge width was fixed to 7 keV. Once we fit the observations with this model, we added a high energy cut-off (“highecut” in XSPEC) to the model and refit. We included a high energy cut-off in the overall model if the F-test indicates that adding this component significantly improves the fit.
At very low flux levels, the Galactic ridge emission becomes important. Although 4U 154347 is not very close to the plane (=+5.43∘), there was some contribution from the ridge, evident by the detection of a narrow iron line at 6.7 keV. However, even during the observations when 4U 154347 was at its faintest (after MJD 52500), it was still detectable by the PCA. We obtained a scanning observations on MJD 52547 that showed an increase in the count rate when the RXTE pointing position reached the 4U 154347 position. Therefore, we were not able to use any of our observations as background for Galactic ridge emission. Instead, we model the ridge emission using the description given in Revnivtsev (2003). We also utilized the XMM-Newton observation on MJD 52504.54 that is close to our faint RXTE observations (Miller, Fabian & Lewin, 2003). We fit our PCA observation close to the XMM-Newton observation with a model consisting of interstellar absorption, a power-law to represent the 4U 154347 with XMM-Newton parameters, a second power-law and a narrow Gaussian to represent the ridge emission. We fixed the second power-law index to 2.15 consistent with Revnivtsev (2003), which resulted in Galactic ridge contribution in the 3–25 keV band. If the index is not fixed, it results in harder ridge emission.
2.1.2 X-ray temporal analysis
For each observation, we computed the power density spectra (PDS) and the cross spectra from the PCA data using IDL programs developed at the University of Tübingen (Pottschmidt, 2002) for three energy bands, 3 – 6 keV, 6 – 15 keV, and 15 – 30 keV. We also computed PDS for the combined band of 3 – 30 keV. Above 30 keV, the source is not significantly above the background for timing analysis. The PDS was normalized as described in Miyamoto & Kitamoto (1989) and corrected for the dead-time effects according to Zhang et al. (1995) with a dead-time of per event. Using 256 second time segments, we investigated the low frequency QPOs and the timing properties of the continuum up to 256 Hz. We fit all our PDSs with Lorentzians of the form:
| (1) |
where subscript denotes each Lorentzian component in the fit, is the rms amplitude of the Lorentzian in the frequency band of - to +, is the full-width-half-maximum, and is the resonance frequency. A useful quantity of the Lorentzian is the “peak frequency” at which the Lorentzian contributes maximum power per logarithmic frequency interval:
| (2) |

An example power spectrum of 4U 154347 in the form of PDS frequency is shown in Fig. 2.a. The PDS consists of broad and narrow Lorentzian fit components. In this figure, the Lorentzians peak at , demonstrating the easy identification of characteristic frequencies as peak frequencies of Lorentzian components. The peak frequencies are shown with solid vertical lines in Fig. 2.a. A Lorentzian with quality value is denoted as a QPO (like the narrow feature in the middle in Fig. 2). The rms amplitudes are calculated over a frequency band from zero to infinity.
The cross spectrum leading to coherence function and time lag constitutes another tool that is available as part of Fourier analysis. The coherence function is a Fourier-frequency-dependent measure of the degree of linear correlation between two concurrent light curves measured simultaneously in two energy bands (Nowak et al., 1999). The Fourier time lag is a Fourier-frequency-dependent measure of the time delay between two concurrent time series (Miyamoto & Kitamoto, 1989; Nowak et al., 1999). It is related to the phase of the average cross power spectrum between the soft and hard band light curve. We use the convention that the sign of the lag is positive when hard photons lag soft photons. Observations of hard lags in GBHs have often been interpreted as evidence for Compton upscattering in a hot electron gas (Payne, 1980), however simple Comptonization models have difficulty explaining the magnitude of lags (Ford et al., 1999).
We calculated the coherence and lag spectrum between 3-6 keV and 6-15 keV band light curves for all observations. Not all observations yielded meaningful coherence measurements; and the lag measurements are only meaningful when the coherence is well defined (Nowak et al., 1999). Fig. 2 shows the coherence spectrum in the middle panel (b) and the lag spectrum in the bottom panel (c) for Obs. 9A. For observations close to the transition (such as the one in Fig. 2), meaningful (not noisy) coherence and lag values were observed between 1–10 Hz. To understand the trends in the amplitude of these quantities, we calculated the mean lag and the mean coherence, similar to what was done in Kalemci et al. (2003).
2.2. Optical, and Infrared observations
The OIR datasets were taken directly from Buxton & Bailyn (2004), therefore we give a short summary of how these observations were obtained. The details can be found in Buxton & Bailyn (2004). Daily - and - band images were taken using the YALO 1.0 m telescope from MJD 52423. Daily band observations were initiated on MJD 52440. The optical observations with , , and filters were conducted between MJD 52442.9 and MJD 52500.8 using the 74 inch telescope at Mount Stromblo Observatory. In this work, only the band light curve is shown, as the important features are most visible in the infrared. The light curves of the remaining bands can be found in Buxton & Bailyn (2004).
2.3. Radio observations
The source was also observed at radio frequencies, and the details of MOST and the Giant Metrewave Radio Telescope (GMRT) observations are discussed in Park et al. (2004). Here, we give a summary of these observations. The source was detected in radio several times between MJD 52443 and MJD 52447 by MOST and GMRT. After MJD 52447, the source was radio quiet until MJD 52487. The upper limits for MOST and GMRT observations on MJD 52480 are 3.0 mJy and 3.2 mJy respectively. On MJD 52487, in the LH state, MOST detected the source at mJy. The final observation by MOST on MJD 52496.33 did not detect the source with an upper limit of 2.4 mJy (Park et al., 2004).
We observed 4U 154347 five times during 2002 June and August with ATCA. In each case the primary calibrator was PKS 1934638 and the secondary calibrator was PMN J1603-4904. Observations took place at 4.80 and 8.64 GHz with a bandwidth of 128 MHz. The data were reduced in the standard way with (minimal) flagging, flux and phase calibration and finally mapping using miriad. A point source was fitted to the detected emission and the flux density measured. A radio source was detected twice, firstly on MJD 52445 at 3.180.19 mJy (4.80 GHz), 2.760.07 mJy (8.64 GHz) and secondly on MJD 52490 at 4.000.05 mJy (4.80 GHz), 4.190.06 mJy (8.64 GHz). On MJD 52450, MJD 52451, and MJD 52453, during the TD state, the source was radio quiet with upper limits ranging between 0.2 and 3.0 mJy.
3. Results
3.1. Evolution in the X-ray regime
To be able to determine the sequence of events during the decay of the outburst, we investigated the evolution of several spectral and temporal fit parameters as well as the IR and the radio fluxes. To establish the time of state transition(s), we plotted several parameters as a function of time in Fig. 3. The main spectral fit parameters are also tabulated in Table 1.
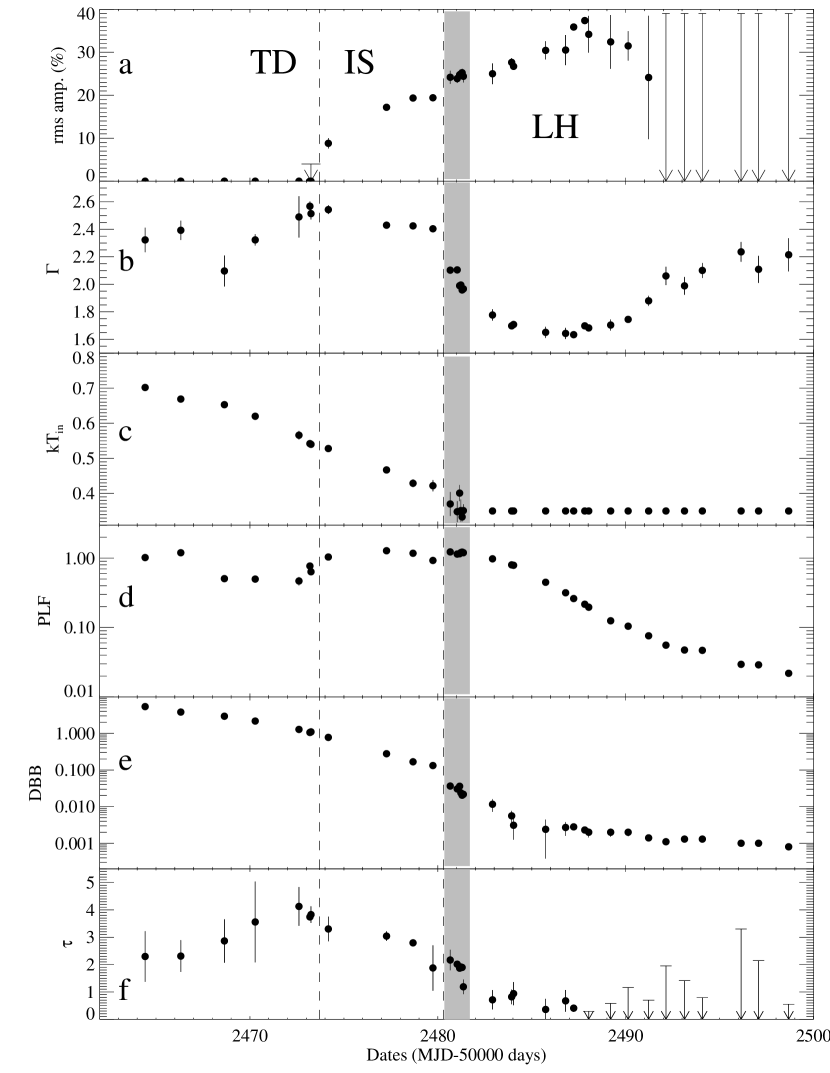
3.1.1 States and transitions
In Fig. 3, we marked the time of the first state transition on MJD 52474 (between observations 7A and 8A in Table 1), when the source showed a sharp increase in the rms amplitude of variability, accompanied by a sharp increase in the power-law flux. Before this date, the spectra were dominated by the disk component (more than 80% of the total flux in 3–25 keV band), and hence the source was in the TD state. Within a few days, the power-law became the dominant component in the spectrum, and the rms amplitude of variability increased to 18%. A QPO appeared in the PDS (see Fig. 4). Note that during this time, while the rms amplitude of variability and the power-law flux were changing rapidly, the photon index remained almost constant, and the inner disk temperature () and the disk-blackbody (DBB) flux decayed smoothly, consistent with the observations reported in Kalemci et al. (2004). The source was in the IS during this time based on the softness of the photon index and the relatively comparable contributions of the hard and the soft components to the spectrum.
Around MJD 52480 (Obs.12B in Table 1), another set of sharp changes occurred; the rms amplitude of variability jumped to 24% level, accompanied by a sharp hardening of the photon index, and rapid cooling of the inner disk temperature. The power-law flux increased slightly, and the DBB flux decreased, still smoothly, but more rapidly. The overall effect was total dominance of the power-law flux over the whole spectrum. After all these rapid changes (shown by the gray area in Fig. 3), the source was in the LH state. In this state, the rms amplitude of variability continued to increase, before leveling off at 35%. The photon index stayed around 1.7, and then increased slightly after MJD 52490. The power-law flux decayed smoothly. We fixed to 0.35 as the fit did not produce meaningful errors when we let vary. The disk component was only affecting the first spectral bin in our fit. As long as the value was fixed, the DBB component was required by the F-test in the fit, although its relative contribution to the overall flux is less than 5 % (see Table 1).
The evolution of the smeared edge component in the spectral fits is also worth mentioning (see Fig. 3.f for the evolution of the optical depth). This component was required in the fit until MJD 52488, although its effects are less and less pronounced after MJD 52481. For observation 14C.d, the optical depth (which may be related to reflection fraction) in the smedge component was 2. It dropped down to 0.8 on MJD 52483, and stayed between 0.5–0.7 for the next six observations. This evolution may indicate that the reflection fraction dropped as the source went into the LH state. After MJD 52488, the smedge component was not required in the fit, although the reduced quality of the spectra did not permit us to place strong upper limits on the optical depth of the component after MJD 52492.
3.1.2 Short time scale evolution
The first long observation of the program P70128 was well-timed, such that it was conducted when the source was in transition to the LH state while changes were happening rapidly. In order to quantify these changes, we divided the long observation into five sections (naturally separated by occultations, with each piece having three PCUs on). Including these pieces, we show that the QPO frequency and the photon index has a strong correlation (with linear correlation coefficient of 0.995) in the IS and during the transition (see Fig. 4). Note that the last six observations are only 2-3 hours apart! The QPO frequency - photon index correlation has been known (Kalemci, 2002; Vignarca et al., 2003), but for the first time, we show that it holds on timescales as short as hours.

| Obs. # | Date | (keV) | (keV) |
|---|---|---|---|
| 13C | 52481.03 | ||
| 14C.a | 52481.16 | ||
| 14C.b | 52481.23 | ||
| 14C.c | 52481.29 | ||
| 14C.d | 52481.36 |
Another very important result that came out from the long observation is the presence of a high energy cut-off in the HEXTE spectrum during the state transition. The cut-off is only detected significantly during the observations for which the power-law index was changing rapidly, and the transition was taking place (gray area in Fig. 3). The cut-off and the folding energies for those observations are given in Table 2. Errors are too large to establish a pattern in the folding energy, except for observation 14C.d for which the folding energy increased. This increase is probably a sign of going back to regular power-law shape. After this observation, the fit values for the folding energy are far beyond the HEXTE energy range, and a cut-off component is not required by the F-test. This is not the first time that the existence of a high energy cut-off has been observed during a state transition. XTE J1550564 during its decay in 2000 outburst shows similar behavior: the cut-off was only significant during the transition (Tomsick, Corbel & Kaaret, 2001; Rodriguez, Corbel & Tomsick, 2003).
3.1.3 Evolution in temporal parameters

The evolutions of the total rms amplitude of variability and the QPO frequencies are shown in Figs. 3 and 4. The QPO has been detected only for the IS and during the transition to the LH state. In the LH state, the PDS can usually be characterized with 2 broad Lorentzians. Therefore, to understand the evolution of characteristic frequencies, we used the broad Lorentzian with the lowest peak frequency that is present for all observations (, see Equation 2). This evolution is shown in Fig. 5.b. In this figure, we also show the evolution of the photon index (Fig. 5.a), which is known to correlate with the temporal parameters that are discussed in this section. There is a good correlation between the photon index and , which is also observed for other sources (Kalemci, 2002; Pottschmidt et al., 2003). The decrease of characteristic frequencies in time after the transition to the LH is also a known effect (Kalemci et al., 2004). Note that the characteristic frequency levels off as the photon index also levels off at low flux levels.
We also included the evolution of mean coherence and lags in 1–10 Hz band in Fig. 5. It was necessary to merge the light curves of the 5 observations in the LH state (15B through 19B in Table 1) to improve statistics. In the IS, the coherence is relatively low, whereas the lags are high. As the source enters the LH state, the coherence increases and approaches unity, and the lag decreases. In the LH state, the coherence is high, and the mean lag is low. These results are in agreement with the analysis of other black hole transients; high lag, low coherence during the IS, and high coherence, low (usually consistent with zero) lag in the LH state, along with a correlation between photon index and the 1–10 Hz mean lag when they are measurable (Kalemci, 2002).

3.2. Multi-wavelength observations
Although some of the radio, optical and IR data from this source were presented before (Park et al., 2004; Buxton & Bailyn, 2004), additional information is available when they are combined with the data from pointed RXTE observations. The evolution of the band infrared fluxes, along with the radio information is shown in Fig 6.b. In this figure, we also show the rms amplitude of variability, the photon index (same as Fig. 3.a, b respectively), and also the HEXTE Cluster A count rate in 16–100 keV band. The band flux decreases steadily in the TD state as the source flux was decaying. Unfortunately, there was no coverage during the first transition, making it impossible for us to determine if there was a response in the OIR emission. On the other hand, there was strong response after the transition to the LH state such that the band flux started to increase sharply 3 days after the time of transition, and peaked in 3 days. A two-sided Gaussian fit to the band light curve during the secondary maximum results in a peak time of MJD (Buxton & Bailyn, 2004). After staying at the peak for a few days, it started to decay, and reached the pre-secondary peak levels in 7 days. As shown in Buxton & Bailyn (2004), both the optical (, , ) and the infrared light curves show this peak. The peak is most pronounced in the and the bands as the strength of emission increases with wavelength. The spectrum of the OIR points is best fit by a power-law rather than a blackbody, or a disk-blackbody model (Buxton & Bailyn, 2004). This strongly suggests that the origin of the OIR emission is optically thin synchrotron. From the beginning of our observations (MJD 52464) to MJD 52487, there was only one radio observation that resulted in no detection. The detections occurred in the LH state, during the secondary maximum. The radio emission most likely originates from an outflow, possibly a compact jet based on the inverted spectrum of the observation 24B (see Fig. 8).
While the band flux increased, the rms amplitude of variability (Fig. 6.a) also increased slightly. It is not clear what happened to the rms amplitude of variability after MJD 52492, as the count rate was too low to constrain the timing properties. The photon index (Fig. 6.c), on the other hand, seemed to show an anti-correlation with the band flux. There is a 2 day time lag between the time where the photon index began to harden and the band flux began to increase. As the band flux decreased, the photon index began to soften. 777When not fixed in the fit, indices of the Galactic ridge emission were consistently harder than 2.15 for the last two points. We fixed the ridge power-law index to 2.15 so the fit resulted in a harder index for the source. The actual photon indices for these two points were probably higher.
Another interesting change with respect to the changes in the OIR is the evolution of the hard flux. This is represented by the HEXTE cluster A count rate in 16–100 keV band in Fig. 6.d. First of all, there was a sharp increase in the count rate right at the transition (probably caused by sharp hardening of the X-ray spectrum). By the time HEXTE count rate peaked, the power-law index dipped, and the band flux started to rise. The lag between the time that hard X-rays peaked and the OIR peaked was about 2 days.
3.3. Spectral Energy Distribution
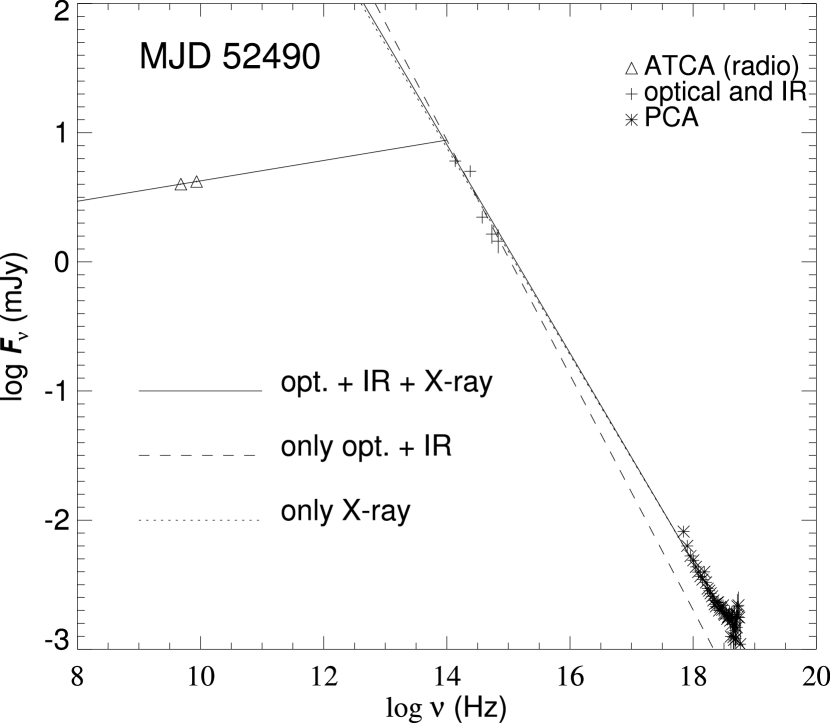
We have constructed two spectral energy distributions (SED) close to the peak of the IR maximum for the dates of the MOST (MJD 52487) and ATCA (MJD 52490) observations. We first corrected the OIR magnitudes for interstellar extinction using E( – ) = 0.50 0.05 (Orosz et al., 1998), = 3.2 E( – ) = 1.60 0.16 (Zombeck, 1990), = 1.324, = 0.482, = 0.282, = 0.112 (Rieke & Lebofsky, 1985). There were no , , or observations on MJD 52487 (Buxton & Bailyn, 2004). The source was observed in , , and bands on MJD 52486, and again on MJD 52490. We used linear interpolation to estimate the peak fluxes on MJD 52487. For each band, we fitted a line to the underlying magnitudes using the points before and after the peak to estimate the underlying flux during the secondary maximum. We converted the peak and underlying magnitudes into fluxes using the irradiation factors and description in Zombeck (1990), and then subtracted the underlying flux from the peak flux to obtain the residual flux representing the emission from the peak only (similar to what was done in Buxton & Bailyn, 2004). We used a measurement error of 0.05 magnitudes in each band. In addition, we calculated the error due to uncertainty in extinction using the uncertainty in E( – ). We also obtained 0.05 and 0.08 magnitude uncertainties in determining the baseline fluxes for an bands, and for , , and bands, respectively, from the fitting process. For MJD 52487, an additional 0.05 magnitude uncertainty is estimated in , , and bands due to interpolation in finding the peak flux. All the error components were added in quadrature to estimate the total uncertainty in the measurements. The unabsorbed PCA and HEXTE fluxes for MJD 52487, and the unabsorbed PCA fluxes for MJD 52490 are converted into mJy to complete the SEDs shown in Figs 7 and 8.
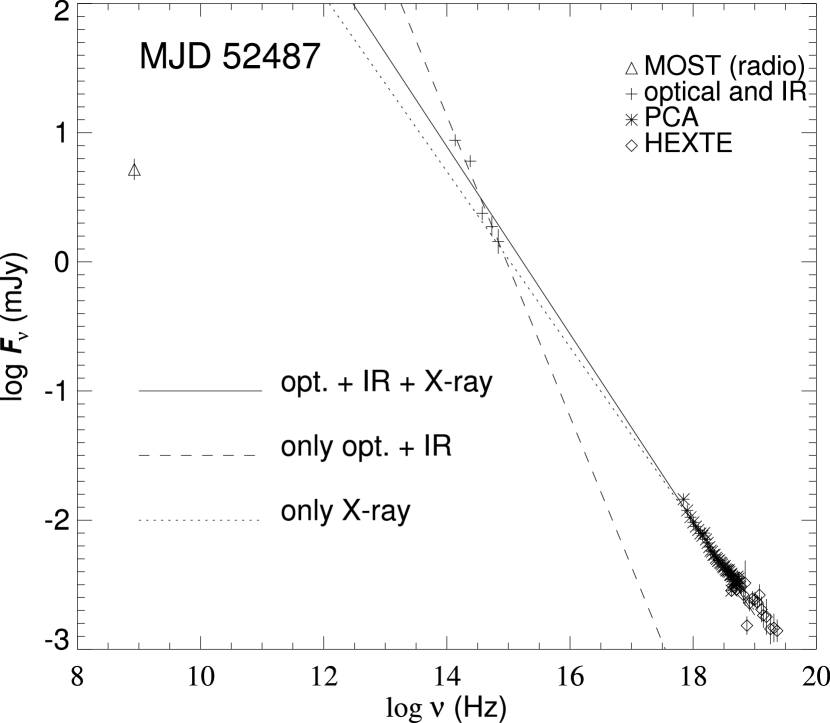
For each case, we fit a power law to the three sets of data; OIR set only, X-ray set only, and OIR and X-ray (overall) set. Fig. 7 shows the SED at MJD 52487 which includes the MOST observation, optical and IR data, as well as PCA and HEXTE data, and the power-law fits (see Table. 3 for fit parameters). Statistically, the OIR points are not the continuation of the power-law of the X-ray data as the high quality PCA+HEXTE data has a photon index of -1.63 with reduced value of 0.64 (XSPEC fit, including all other model components). The optical and IR points alone result in a much steeper power law index of 2.16.
| MJD 52487 | ||
|---|---|---|
| Data set | photon index | /DOF |
| Opt. and IR only | 8.74 / 3 | |
| X-ray only888X-ray only fits for both dates are from XSPEC fits, with all other model components | 39.78 / 62 | |
| Opt., IR, and X-ray | 164.30 / 64 | |
| MJD 52490 | ||
| Opt. and IR only | 14.66 / 3 | |
| X-ray only | 47.68 / 43 | |
| Opt., IR, and X-ray | 80.39 / 42 | |
Although the OIR points do not follow the power-law fit of the X-ray data again for the SED of MJD 52490 shown in Fig. 8, the discrepancy is much less compared to MJD 52487 observation. The X-ray and OIR power-law indices are consistent within 2- uncertainty. Unlike the first case, this SED provides the break point of the spectrum as there are two radio points. The turnover is around Hz. This value is similar to the observed values of other sources (Corbel & Fender, 2002; Homan et al., 2004).
For the B, V, and the I bands, the largest contribution to the error estimate is from the reddening factor. We investigated whether an underestimated error in the reddening could cause the discrepancy between the OIR slope and X-ray slope for our SEDs. For the SED on MJD 52490, an uncertainty of 15% in instead of the quoted 10% is enough to make the OIR slope and the X-ray slope be consistent within 1 uncertainty. However, for the SED on MJD 52487, the uncertainty of the reddening factor must be as high as 60% to make OIR slope and X-ray slope be consistent, which is highly unlikely.
3.4. Summary of results
In this section we summarize our main results that will be discussed in detail in § 4.
-
•
4U 154347 showed two state transitions during its decay in the 2002 outburst:
-the first transition was from the TD state to the IS on MJD 52474, and was marked by a jump in rms amplitude of variability and power-law flux.
-the second transition was from the IS to the LH state, and was marked by a sharp hardening of the X-ray spectrum, and an increase in rms amplitude of variability.
-
•
During the IS and the transition to the LH state a QPO was detected. The resonance frequency (see Eq. 1) of the QPO showed a very strong correlation with the photon index on time scales of hours.
-
•
A high energy cut-off was detected in the X-ray spectrum only during the transition to the LH state, whereas after the transition and during the LH state, the cut-off was either absent or beyond the HEXTE detection range.
-
•
The spectrum softened at very low flux levels in the LH state.
-
•
The characteristic frequencies decreased during the transition and in the LH state before they leveled off. The characteristic frequencies and the photon index showed a good correlation.
-
•
The mean coherence was low during the IS, and then increased and approached unity as the source made the transition to the LH state. The mean lag, on the other hand, was high in the IS, and decreased during the transition.
-
•
The OIR light curves started peaking 3 days after the transition to the LH state. The radio detections occurred during the OIR secondary maximum.
-
•
The HEXTE 16-100 keV light curve increased during the transition to the LH state while the photon index hardened. It did decay, however, while the IR flux was rising.
-
•
The SEDs show that the OIR part of the spectrum can be represented by a power-law. For the SED on MJD 52487, the hard X-ray points are not a continuation of the OIR points and have a different index. For the SED on MJD 52490, the difference is less, and the X-ray and OIR power-law indices are consistent within 2- uncertainty.
4. Discussion
The multi-wavelength observations of the 2002 outburst of 4U 154347 have provided a wealth of information on the physical processes during state transitions and the LH state of GBH transients. In this section, using our observational results, previous experience from other sources, and some theoretical models, we try to place constraints on the X-ray emission geometry, the hard X-ray emission mechanism (power-law part of the X-ray spectrum), and we try to identify the origin of seed photons (if seed photons are required). These three properties constitute the fundamental differences between various models of X-ray emission from GBHs (Tomsick, 2004).
One set of models considers a corona (which could be in a form of an ADAF) inside a transition radius (that can move) as the accretion geometry (e.g, see Esin, McClintock & Narayan, 1997). In this case, the base of the jet may be the whole corona, or the base may be small compared to the overall size of the corona (Fender, 2001; Markoff & Nowak, 2004). We note that the jet has not been incorporated into the ADAF or ”sphere+disk” models in a self consistent way. In the “magnetic corona” model, active, optically thin regions above the disk are responsible for the hard X-ray emission and the outflow formation (Merloni & Fabian, 2002). In this model, the position of the inner edge of the accretion disk does not necessarily change significantly. For these cases where the main hard X-ray producing mechanism is Compton scattering, the seed photons could either be produced in the accretion disk as blackbody radiation or in the corona as synchrotron radiation (synchrotron self-Compton, Markoff & Nowak, 2004). On the other hand, the main hard X-ray emission mechanism may not be Compton scattering, but synchrotron radiation originating in the optically thin shock region in the jet (Falcke & Biermann, 1999; Markoff, Falcke & Fender, 2001; Markoff & Nowak, 2004). A combination of emission mechanisms is also possible (see, for example Rodriguez et al., 2004), synchrotron radiation and Compton scattering may contribute simultaneously, also, the seed photons for Compton scattering may be a combination of synchrotron at the base of a jet or accretion disk. However, unless these mechanisms conspire to result in very similar observational properties, it may still be possible to determine the major emission mechanism and major contributor of seed photons.
The transition of 4U 154347 to the IS from the TD state shows the characteristics that many other sources also show, namely a strong jump in the rms amplitude of variability (from less than 4% to 9%) accompanied by an increase in the power-law flux in a few days timescale. Note that during this transition, the change in the power-law photon index is smooth. Based on similar evolution of spectral and temporal parameters of other GBH transients, Kalemci et al. (2004) concluded that a threshold volume for a hot corona is required to observe variability. The second transition during which the photon index and the inner disk temperature decrease very rapidly, and the multi-wavelength observations in the LH state provide more insight into understanding the origin of hard X-ray emission mechanism for this source. Below, we describe how the sequence of observational changes may be explained by different hard X-ray emission mechanisms and geometries.
4.1. Compton scattering - recessing accretion disk
In the IS, the inner edge of the disk is close to the black hole, the high reflection fraction indicates that the disk and the corona have some overlap, and there is strong cooling of coronal electrons by the accretion disk seed photons. The electron distribution is more likely not Maxwellian (Coppi, 1999), as no cut-off is detected in the HEXTE spectrum. It is possible that an outflow may already be present in this state which provides an“elongated” and variable corona structure at its base which could explain large lags and small coherence values, as well as the non-thermal nature of the electron population (Pottschmidt et al., 2000; Kalemci et al., 2003).
At some critical combination of physical parameters (mass accretion rate has been shown not to be the only parameter determining when the transition occurs, Homan et al., 2001; Kalemci et al., 2004), the inner parts of the disk evaporate rapidly into a hot corona and the transition radius moves outward. During this process, the optical thickness of the corona increases and the thermal electrons dominate the system, causing a harder spectrum with a cut-off in the HEXTE band. As the disk moves outward, the hardening of the spectrum continues because of a lower level of cooling by the disk (the cut-off becomes undetectable), the disk temperature decreases as the hotter inner parts of the disk evaporates. The recession of the disk could also explain the evolution of the QPO frequency and if they are related to some dynamical timescale of the inner disk. This model may further explain the correlation between the photon index and the QPO if the hardening is a direct result of less cooling by increasing inner disk radius that the QPO frequency is linked. Similar arguments had been put forward to explain the well established photon index-reflection fraction correlation in GBHs and AGNs (Zdziarski et al., 2002, and references therein). The relation between the photon index and the QPO frequency could also be due to increasing optical depth of the corona as it expands (Titarchuk & Fiorito, 2004).
The detection of the inverted radio spectrum, and also the IR peak indicate that a compact jet is present deep in the LH state. The high coherence and low lag values, and the indication of low reflection fraction may point out that the size of the jet is now small compared to the transition radius. According to Meier, Koide & Uchida (2001), the production region for a MHD driven compact jet is 7 - 8 for a Schwarzchild hole, and even smaller for a Kerr hole. More than one order of magnitude decrease in characteristic frequency between the IS and the deep LH state may also indicate that the transition radius is away from the jet production region. The similarity of the PDS in the IS with the detection of the QPOs, and the photon index - QPO frequency correlation point to accretion disk as the major source of seed photons in the IS and during the transition. Also, once the spectrum reaches its hardest point on MJD 52483, the HEXTE count rate starts to decrease, in parallel with the decrease in the DBB flux, again indicating that the major source of seed photons is the accretion disk. However, the source of seed photons deep in the LH state is unclear, and the synchrotron-self Compton may be contributing to the hard X-ray emission after MJD 52487. The spectral softening at the end of the outburst may be due to a decrease of the optical thickness of the Comptonizing medium as the mass accretion rate decreases, and the energetic electrons either advectively accrete onto the black hole, or leave the vicinity of the black hole in the form of an outflow (Esin, McClintock & Narayan, 1997). We note that this type of softening is observed in many sources (Kalemci, 2002; Tomsick, Corbel & Kaaret, 2001).
4.2. Compton scattering - stable inner disk (magnetic flares):
The fits to the PCA spectrum, even at very low flux levels, require a disk component to be able to fit the first bin. However, we cannot reliably constrain disk parameters after MJD 52485 with PCA observations when only one bin is affected. The XMM-Newton observation that took place on MJD 52504.5 indicates that a disk component is required in the fit at 3 level with a temperature of 0.19 keV. After converting the normalization of the diskbb fit to an inner disk radius, Miller, Fabian & Lewin (2003) claimed that the disk may still be very close to the last stable orbit. If the disk is not moving, as in the magnetic flares model, the explanation of the spectral evolution is different than the case of the moving disk. In the stable disk case, after the transition to the IS, the active regions increase in number compared to before the transition and the variability is observed due to short lived flares in the active regions (Merloni & Fabian, 2001). A non-Maxwellian distribution of electrons in the corona is again required in the IS state. During the transition to the LH state, a larger and larger portion of the accretion energy is used to buoy the magnetic flux tubes and to heat the corona. This results in cooling the disk, and hardening the photon index. At lower mass accretion rates, the accretion energy might be channeled into launching and sustaining the jet rather than heating the electrons which may explain the softening at the end of the outburst (Merloni & Fabian, 2002). The decrease in the reflection fraction could be explained if the surface of the disk becomes ionized which washes away the features (Nayakshin & Dove, 2001). However, a recent study showed that the magnetic flares model cannot explain the high energy emission of Cyg X-1, even with the the ionization effect (Barrio, Done & Nayakshin, 2003). It is also not clear what determines the QPO frequency, what causes the temporal evolution, why the characteristic frequencies decrease in time, and what causes the QPO frequency - photon index correlation.
4.3. Direct synchrotron radiation
It is hard to explain the sequence of events in this source if the main hard X-ray emission mechanism is direct synchrotron from a shock region (first acceleration zone) in a jet for most of the outburst decay. The origin of the OIR peak emission is probably synchrotron from a shock region in the jet (where the hard X-rays would also originate) as indicated by SEDs (Buxton & Bailyn, 2004). The IR peak shows that the shock region has formed after the transition to the LH state. Even though there is no coverage in the OIR during the IS, the IR emission between MJD 52480 and MJD 52483 is the continuation of the decay in IR before the IS, and it is unlikely that another IR peak is present in the IS. The outflow may be present after the first transition to the IS; however, the formation of the shock region did not take place before the source was in the LH state. If the assessment above is correct, the synchrotron X-ray emission from the jet region could not have been produced before the source is deep in the LH state. But it is possible that the synchrotron emission becomes the dominant X-ray emission mechanism after the formation of the shock region. The synchrotron model results in very low reflection fraction (3%, Markoff & Nowak, 2004). There is a sharp drop in smeared edge optical depth just before the IR flux begins to rise. It is also intriguing that the QPO disappears, the structure of the power spectrum changes as the reflection decreases. However, there is also evidence against the synchrotron interpretation even after the IR flux begins to rise. The SEDs indicate that, even without an exponential cut-off, the X-ray contribution from synchrotron is below the observed levels. More importantly, the HEXTE light curve does not follow the IR light curve, decreasing while the IR is still rising, and the photon index is hardening between MJD 52483 and MJD 52487 (see Fig. 6). This is very hard to explain in the synchrotron model when the IR and optical emission comes from the optically thin part of the SED as in 4U 154347 (see Figs 7 and 8). We emphasize that the synchrotron radiation from the jet may still be contributing to the overall X-ray emission, but it cannot be the dominant emission mechanism until MJD 52490. It is hard to make a claim about the dominant emission mechanism after this date. Note that, the discrepancy in the power-law index of the OIR points and X-ray points on MJD 52490 is also much less than that of MJD 52487 (see Figs. 7 and 8).
4.4. Comparison with GX 3394
When only evolution of X-ray properties are considered, 4U 154347 is a very typical source showing characteristics of many other GBH transients (Kalemci et al., 2004). However, this does not translate easily into generalizing the results from this work to all GBH transients as few objects had daily simultaneous IR and X-ray coverage that one could compare the details of spectral evolution. GX 3394 had such coverage during its 2002 outburst. It is also a very typical GBH transient in its spectral and timing properties. In fact, its 2002 outburst decay shows very similar spectral and temporal characteristics in X-rays to the decay of 4U 154347 (Kalemci et al., in preparation). However, in the LH state during the outburst rise, GX 3394 shows a correlation between the X-ray flux and the OIR flux (Homan et al., 2004), whereas 4U 154347 shows an anti-correlation in the LH state during the decay. Although somewhat speculative, the main difference between the behavior in 4U 154347 and in GX 3394 could be the origin of seed photons for Compton upscattering. For 4U 154347, the decay part of the HEXTE light curve seems to have two slopes, a sharp decay until MJD 52486, and a more gradual decay after this date. This could be a sign of the major seed photon emission mechanism changing from DBB from the accretion disk to synchrotron self-Compton at the base of the jet after MJD 52489 as the IR and X-rays correlate after this date. Complete multi-wavelength analysis (including OIR data) of other black hole transients is necessary to generalize the relation between the OIR and X-ray flux.
5. Summary and Conclusion
Using X-rays, OIR, and radio observations, we characterized the outburst decay of the GBHT 4U 154347, and placed constraints on several emission models. A large, non-thermal, and radiatively inefficient outflow could explain the spectral and temporal evolution in the IS. The presence of high energy cut-off in the X-ray spectra during the transition to the LH state is indicative of a thermal electron distribution. In general, our observations are consistent with a recessing accretion disk + hot corona + “compact” jet geometry with the main hard X-ray emission mechanism of Compton upscattering of soft accretion disk seed photons by energetic electrons in the corona. Here we used the word “compact” to also emphasize the size of the base of the jet, which most likely is small compared to the overall size of the corona. This interpretation can reasonably explain all aspects of our observations until deep in the LH state.
Our results do not strongly rule out the possibility of accretion disk being always close to the last stable orbit as in magnetic flares model; however, the QPO frequency - photon index correlation, and the decrease of characteristic frequencies in time are two results from this and other sources that need to be understood for this model (Zdziarski et al., 2003; Tomsick, 2004).
Our observations disfavor synchrotron from a shock region in the jet as major source of hard X-rays until deep in the LH state. We cannot place constraints on different emission models after MJD 52490.
References
- Bailyn et al. (1999) Bailyn, C. D., Depoy, D., Agostinho, R., Mendez, R., Espinoza, J., & Gonzalez, D., 1999, Bulletin of the American Astronomical Society, 31, 1502
- Barrio, Done & Nayakshin (2003) Barrio, F. E., Done, C., & Nayakshin, S., 2003, MNRAS, 342, 557
- Bradt, Rothschild & Swank (1993) Bradt, H. V., Rothschild, R. E., & Swank, J. H., 1993, A&AS, 97, 355
- Brocksopp, Bandyopadhyay & Fender (2004) Brocksopp, C., Bandyopadhyay, R. M., & Fender, R. P., 2004, New Astronomy, 9, 249
- Buxton & Bailyn (2004) Buxton, M., & Bailyn, C. D., 2004, ApJ, in press
- Coppi (1999) Coppi, P. S., 1999, in ASP Conf. Ser. 161: High Energy Processes in Accreting Black Hole, eds. Poutanen, J. and Svensson, R.
- Corbel & Fender (2002) Corbel, S., & Fender, R. P., 2002, ApJ, 573, L35
- Corbel et al. (2004) Corbel, S., Fender, R. P., Tomsick, J. A., Tzioumis, A. K., & Tingay, S., 2004, ApJ, in press
- Corbel et al. (2000) Corbel, S., Fender, R. P., Tzioumis, A. K., Nowak, M., McIntyre, V., Durouchoux, P., & Sood, R., 2000, A&A, 359, 251
- Corbel et al. (2001) Corbel, S., et al., 2001, ApJ, 554, 43
- Corbel et al. (2003) Corbel, S., Nowak, M. A., Fender, R. P., Tzioumis, A. K., & Markoff, S., 2003, A&A, 400, 1007
- Ebisawa et al. (1994) Ebisawa, K., et al., 1994, PASJ, 46, 375
- Esin, McClintock & Narayan (1997) Esin, A. A., McClintock, J. E., & Narayan, R., 1997, ApJ, 489, 865
- Falcke & Biermann (1999) Falcke, H., & Biermann, P. L., 1999, A&A, 342, 49
- Fender et al. (1999) Fender, R., et al., 1999, ApJ, 519, L165
- Fender (2001) Fender, R. P., 2001, MNRAS, 322, 31
- Fender (2003) Fender, R. P., 2003, in to appear in Compact Stellar X-Ray Sources, eds. W.H.G. Lewin and M. van der Klis, Cambridge University Press, astro-ph/0306213
- Fender & Kuulkers (2001) Fender, R. P., & Kuulkers, E., 2001, MNRAS, 324, 923
- Ford et al. (1999) Ford, E. C., van der Klis, M., Méndez, M., van Paradjs, J., & Kaaret, P., 1999, ApJ, 512, L31
- Gallo, Fender & Pooley (2003) Gallo, E., Fender, R., & Pooley, G., 2003, MNRAS, 344, 60
- Harmon et al. (1992) Harmon, B. A., Wilson, R. B., Finger, M. H., Paciesas, W. S., Rubin, B. C., & Fishman, G. J., 1992, IAU Circular, 5510
- Homan et al. (2004) Homan, J., Buxton, M., Markoff, S., Bailyn, C., Nespoli, E., & Belloni, T., 2004, ApJ, submitted
- Homan et al. (2001) Homan, J., Wijnands, R., van der Klis, M., Belloni, T., van Paradijs, J., Klein-Wolt, M., Fender, R., & Méndez, M., 2001, ApJS, 132, 377
- Hunstead & Webb (2002) Hunstead, R. W., & Webb, J., 2002, IAU Circular, 7925
- Jain et al. (2001a) Jain, R. K., Bailyn, C. D., Orosz, J. A., McClintock, J. E., & Remillard, R. A., 2001a, ApJ, 554, L181
- Jain et al. (2001b) Jain, R. K., Bailyn, C. D., Orosz, J. A., McClintock, J. E., Sobczak, G. J., & Remillard, R. A., 2001b, ApJ, 546, 1086
- Kalemci (2002) Kalemci, E., 2002, Ph.D. Thesis, University of California, San Diego
- Kalemci et al. (2002) Kalemci, E., Tomsick, J., Rothschild, R., Corbel, S., Kaaret, P., & McClintock, J., 2002, The Astronomer’s Telegram, 103
- Kalemci et al. (2003) Kalemci, E., Tomsick, J. A., Rothschild, R. E., Pottschmidt, K., Corbel, S., Wijnands, R., Miller, J. M., & Kaaret, P., 2003, ApJ, 586, 419
- Kalemci et al. (2001) Kalemci, E., Tomsick, J. A., Rothschild, R. E., Pottschmidt, K., & Kaaret, P., 2001, ApJ, 563, 239
- Kalemci et al. (2004) Kalemci, E., Tomsick, J. A., Rothschild, R. E., Pottschmidt, K., & Kaaret, P., 2004, ApJ, 603, 231
- Kitamoto et al. (1984) Kitamoto, S., Miyamoto, S., Tsunemi, H., Makishima, K., & Nakagawa, M., 1984, PASJ, 36, 799
- Kong et al. (2002) Kong, A. K. H., Charles, P. A., Kuulkers, E., & Kitamoto, S., 2002, MNRAS, 329, 588
- Körding & Falcke (2004) Körding, E., & Falcke, H., 2004, A&A, 414, 795
- Laor (1991) Laor, A., 1991, ApJ, 376, 90
- Makishima et al. (1986) Makishima, K., Maejima, Y., Mitsuda, K., Bradt, H. V., Remillard, R. A., Tuohy, I. R., Hoshi, R., & Nakagawa, M., 1986, ApJ, 308, 635
- Markoff, Falcke & Fender (2001) Markoff, S., Falcke, H., & Fender, R., 2001, A&A, 372, L25
- Markoff & Nowak (2004) Markoff, S., & Nowak, M. A., 2004, ApJ, 609, 972
- Matilsky et al. (1972) Matilsky, T. A., Giacconi, R., Gursky, H., Kellogg, E. M., & Tananbaum, H. D., 1972, ApJ, 174, 53
- McClintock & Remillard (2003) McClintock, J. E., & Remillard, R. A., 2003, in Compact Stellar X-ray Sources, eds. W. H. G. Lewin and M. van der Klis, Cambridge University Press, astro-ph/0306213
- Meier, Koide & Uchida (2001) Meier, D. L., Koide, S., & Uchida, Y., 2001, Science, 291, 84
- Merloni & Fabian (2001) Merloni, A., & Fabian, A. C., 2001, MNRAS, 321, 549
- Merloni & Fabian (2002) Merloni, A., & Fabian, A. C., 2002, MNRAS, 332, 165
- Miller, Fabian & Lewin (2003) Miller, J. M., Fabian, A. C., & Lewin, W. H. G., 2003, The Astronomer’s Telegram, 212
- Miller & Remillard (2002) Miller, J. M., & Remillard, R. A., 2002, IAU Circular, 7920
- Miyamoto & Kitamoto (1989) Miyamoto, S., & Kitamoto, S., 1989, Nature, 342, 773
- Nayakshin & Dove (2001) Nayakshin, S., & Dove, J. B., 2001, ApJ, 560, 885
- Nowak et al. (1999) Nowak, M. A., Vaughan, B. A., Wilms, J. ., Dove, J. B., & Begelman, M. C., 1999, ApJ, 510, 874
- Orosz et al. (1998) Orosz, J. A., Jain, R. K., Bailyn, C. D., McClintock, J. E., & Remillard, R. A., 1998, ApJ, 499, 375
- Park et al. (2004) Park, S. Q., et al., 2004, ApJ, 610, 378
- Payne (1980) Payne, D., 1980, ApJ, 237, 951
- Pedersen (1983) Pedersen, H., 1983, The Messenger, 34, 21
- Pottschmidt (2002) Pottschmidt, K., 2002, PhD Thesis, Univ. of Tübingen
- Pottschmidt et al. (2000) Pottschmidt, K., Wilms, J., Nowak, M. A., Heindl, W. A., Smith, D. M., & Staubert, R., 2000, A&A, 357, L17
- Pottschmidt et al. (2003) Pottschmidt, K., et al., 2003, A&A, 407, 1039
- Revnivtsev (2003) Revnivtsev, M., 2003, A&A, 410, 865
- Rieke & Lebofsky (1985) Rieke, G. H., & Lebofsky, M. J., 1985, ApJ, 288, 618
- Rodriguez et al. (2004) Rodriguez, J., Corbel, S., Hannikainen, D. C., Belloni, T., Paizis, A., & Vilhu, O., 2004, ApJ, accepted, astro-ph/0407076
- Rodriguez, Corbel & Tomsick (2003) Rodriguez, J., Corbel, S., & Tomsick, J. A., 2003, ApJ, 595, 1032
- Rothschild et al. (1998) Rothschild, R. E., et al., 1998, ApJ, 496, 538
- Sobczak et al. (2000) Sobczak, G. J., McClintock, J. E., Remillard, R. A., Cui, W., Levine, A. M., Morgan, E. H., Orosz, J. A., & Bailyn, C. D., 2000, ApJ, 544, 993
- Titarchuk & Fiorito (2004) Titarchuk, L., & Fiorito, R., 2004, ApJ, 612, 988
- Tomsick (2004) Tomsick, J. A., 2004, in X-Ray Timing 2003: Rossi and Beyond, Vol. astro-ph/041189, (Melville, NY: American Institute of Physics)
- Tomsick, Corbel & Kaaret (2001) Tomsick, J. A., Corbel, S., & Kaaret, P., 2001, ApJ, 563, 229
- Tomsick & Kaaret (2000) Tomsick, J. A., & Kaaret, P., 2000, ApJ, 537, 448
- Tomsick et al. (2003) Tomsick, J. A., Kalemci, E., Corbel, S., & Kaaret, P., 2003, ApJ, 592, 1100
- Tomsick, Kalemci & Kaaret (2004) Tomsick, J. A., Kalemci, E., & Kaaret, P., 2004, ApJ, 601, 439
- Vaughan & Nowak (1997) Vaughan, B. A., & Nowak, M. A., 1997, ApJ, 474, L43
- Vignarca et al. (2003) Vignarca, F., Migliari, S., Belloni, T., Psaltis, D., & van der Klis, M., 2003, A&A, 397, 729
- Zdziarski et al. (2003) Zdziarski, A. A., Lubiński, P., Gilfanov, M., & Revnivtsev, M., 2003, MNRAS, 342, 355
- Zdziarski et al. (2002) Zdziarski, A. A., Poutanen, J., Paciesas, W. S., & Wen, L., 2002, ApJ, 578, 357
- Zhang et al. (1995) Zhang, W., Jahoda, K., Swank, J. H., Morgan, E. H., & Giles, A. B., 1995, ApJ, 449, 930
- Zombeck (1990) Zombeck, M. V., 1990, Handbook of space astronomy and astrophysics, Cambridge: University Press, 1990, 2nd ed.)