Spectroscopic Properties of the Ly–emitters11affiliation: Based in part on observations made at the W.M. Keck Observatory, which is operated as a scientific partnership among the California Institute of Technology, the University of California, and the National Aeronautics and Space Administration. The Observatory was made possible by the generous financial support of the W.M. Keck Foundation.
Abstract
We present Keck/LRIS optical spectra of 17 Ly–emitting galaxies and one Lyman break galaxy at discovered in the Large Area Lyman Alpha (LALA) survey. The survey has identified a sample of candidate Ly–emitting galaxies at in a search volume of comoving Mpc3. We targeted 25 candidates for spectroscopy; hence, the 18 confirmations presented herein suggest a selection reliability of 72%. The large equivalent widths (median Å) but narrow physical widths ( km s-1) of the Ly emission lines, along with the lack of accompanying high–ionization state emission lines, suggest that these galaxies are young systems powered by star formation rather than by AGN activity. Theoretical models of galaxy formation in the primordial Universe suggest that a small fraction of Ly–emitting galaxies at may still be nascent, metal–free objects. Indeed, we find with 90% confidence that 3 to 5 of the confirmed sources show Å, exceeding the maximum Ly equivalent width predicted for normal stellar populations. Nonetheless, we find no evidence for He II 1640 emission in either individual or composite spectra, indicating that though these galaxies are young, they are not truly primitive, Population III objects.
Subject headings:
galaxies: high–redshift — galaxies: evolution1. Introduction
Ly emission has recently begun to fulfill its long–awaited role as a tracer of young galaxies in the high–redshift universe. Although early predictions based on monolithic collapse models (Partridge & Peebles 1967) over–estimated characteristic Ly line luminosities by factors of , the basic insight that Ly is a good tracer of young stellar populations in association with the gas from which they formed remains valid. Because Ly photons are resonantly scattered by neutral hydrogen, their effective optical depth to dust absorption in the interstellar medium is greatly enhanced compared to continuum photons of slightly different wavelength. This effect was one of the first proposed to explain non–detections in Ly protogalaxy searches (Meier & Terlevich 1981), and now that Ly emission has been detected in high redshift field galaxies (e.g. Hu & McMahon 1996; Cowie & Hu 1998; Dey et al. 1998; Hu et al. 1998; Pascarelle et al. 1998; Hu et al. 1999; Steidel et al. 2000; Kudritzki et al. 2000; Rhoads et al. 2000; Fynbo et al. 2001; Dawson et al. 2001, 2002; Lehnert & Bremer 2003; Bunker et al. 2003; Kodaira et al. 2003), we can turn the effect to our advantage. The line is produced by the interaction of ionizing radiation with hydrogen, and is quenched by dust. Thus, on the simplest interpretation, Ly–selected samples will likely include galaxies with hot, young stellar populations and little dust, properties which are expected in primitive systems where little chemical evolution has yet occurred.
The Large Area Lyman Alpha (LALA) survey (Rhoads et al. 2000) has recently identified in deep narrow band imaging a large sample of Ly–emitting galaxies at redshifts (Malhotra & Rhoads 2002), (Rhoads & Malhotra 2001; Rhoads et al. 2003), and (Rhoads et al. 2004). The rest frame equivalent widths () of the Ly emission measured in the narrow band images generally exceed the maximum expected for a normal stellar population, with 60% of the sample showing Å (Malhotra & Rhoads 2002). Such large equivalent widths suggest that the Ly–emission is produced in one of two scenarios: (1) young (age years) galaxies undergoing star formation in primitive conditions, where metal–free (or low metallicity) gas results in stellar populations biased toward massive, UV–bright stars; or (2) Ly–emission powered by AGN activity.
We report on the spectroscopic confirmation of 18 narrow band–selected galaxies at . The narrow physical widths (when resolved, km s-1) of the observed Ly–emission lines rule out conventional broad–lined (Type I) AGN as the central engines of the Ly–emitters. Moreover, the general lack of accompanying high–ionization state emission lines (e.g. N V 1240, Si IV 1398, C IV 1549, He II 1640), along with the recent non–detection of the sources in deep Chandra imaging (Malhotra et al. 2003; Wang et al. 2004), also rules out the comparatively rarer high–redshift narrow–lined (Type II) AGN. These findings leave massive star formation in low metallicity gas as the likely Ly emission mechanism. The tantalizing limit of such systems — star formation in zero–metallicity gas — represents the first bout of star formation in the pre–galactic Universe, and would be recognizable in optical spectroscopy by weak He II 1640 emission.
We describe our imaging and spectroscopic observations in § 2, and we summarize the results of the spectroscopic campaign in § 3. In § 4, we use our spectroscopic confirmations to update the statistics of the population, and we discuss the implications of C IV 1549 and He II 1640 non–detections in composite spectra for the possibility of AGN activity and/or zero–metallicity star formation among the sample. Throughout this paper we adopt a –cosmology with and , and km s-1 Mpc-1. At , such a universe is 1.3 Gyr old, the lookback time is 90.2% of the total age of the Universe, and an angular size of 10 corresponds to 6.61 kpc.
2. Observations
2.1. Narrow band and Broad band Imaging
The LALA survey concentrates on two primary fields, “Boötes” (14:25:57 35:32; J2000.0) and “Cetus” (02:05:20 04:55; J2000.0). Each field is arcminutes in size, corresponding to a single field of the 8192 8192 pixel Mosaic CCD camera on the 4m Mayall Telescope at Kitt Peak National Observatory and on the 4m Blanco Telescope at Cerro Tololo Inter–American Observatory. The search uses five overlapping narrow band filters each with full width at half maximum (FWHM) Å. The central wavelengths are , , , , and Å, giving a total redshift coverage of and a survey volume of comoving Mpc3 per field. In roughly 6 hours per filter per field, we achieve 5 line detections in 23 apertures of erg cm-2 s-1.
The primary LALA survey fields were chosen to lie within the NOAO Deep Wide Field Survey (NDWFS; Jannuzi & Dey 1999). Thus, deep NDWFS broad band images are available in a custom filter ( Å, Å) and in the Harris set Kron–Cousins and , as well as , , , and . The LALA Boötes field benefits from additional deep and SDSS filter imaging. The imaging data reduction is described in Rhoads et al. (2000), and the candidate selection is described in Malhotra & Rhoads (2002). Briefly, candidates are selected based on a 5 detection in a narrow band filter, the flux density of which must be twice the –band flux density, and must exceed the –band flux density at the 4 confidence level. To guard against foreground interlopers, we set a minimum observed equivalent width of Å, and the candidate must not be detected in the –band.
| Ly FluxbbThe line flux was determined by totaling the flux of the pixels that fall within the line profile. No attempt was made to model the emission line or to account for the very minor contribution of the continuum to the line. Quoted uncertainties account for photon counting errors alone, excluding possible systematic errors. Despite these caveats, the Ly line fluxes measured from the spectra agree to in all but one case with those measured in the narrow band imaging. | ccThe rest frame equivalent widths were determined with , where is the flux in the emission line and is the measured red–side continuum flux density. The error bars and are confidence intervals determined by integrating over the probability density functions described in § 4.2. The error bars are symmetric in probability density–space in the sense that . | FWHMddThe FWHM was measured directly from the emission line by counting the number of pixels in the unsmoothed spectrum which exceed a flux equal to half the flux in the peak pixel. No attempt was made to account for the minor contribution of the continuum to the height of the peak pixel. | eeThe velocity width was determined by subtracting in quadrature the effective instrumental resolution for a point source, and is therefore an upper limit, as the target may have angular size comparable to the seeing of these data. Where the emission line is unresolved, the velocity width is an upper limit set by the effective width of the resolution element itself. | Continuum (Jy)ffRed and blue side continuum measurements are variance–weighted averages made in 1200 Å wide windows beginning 30 Å from the wavelength of the peak pixel in the emission line. A small correction factor was subtracted from the variance–weighted averages based on the detection of residual signal remaining in extractions of source–free, sky–subtracted regions of the two–dimensional spectra (see text, § 2.2). Quoted uncertainties account for photon counting errors in the source extractions added in quadrature to the photon counting errors derived in the blank–sky extractions. | Continuum (Jy)ffRed and blue side continuum measurements are variance–weighted averages made in 1200 Å wide windows beginning 30 Å from the wavelength of the peak pixel in the emission line. A small correction factor was subtracted from the variance–weighted averages based on the detection of residual signal remaining in extractions of source–free, sky–subtracted regions of the two–dimensional spectra (see text, § 2.2). Quoted uncertainties account for photon counting errors in the source extractions added in quadrature to the photon counting errors derived in the blank–sky extractions. | ||
|---|---|---|---|---|---|---|---|
| Target | aaThe redshift was derived from the wavelength of the peak pixel in the observed line profile. We estimate the error in this measurement to be , depending on the spectroscopic configuration. However, we note that this measurement may overestimate the true redshift of the system since the blue wing of the Ly emission is absorbed by foreground neutral hydrogen. | ( erg cm-2 s-1) | (Å) | (Å) | (km s-1) | Blue side | Red side |
| 150/mm–grating observationsgg Å; 4.8 Å pix-1 dispersion; Å.: | |||||||
| J020518.1045616 | 4.396 | 3.79 0.34 | 80 | 18.1 1.1 | 1140iiLine is unresolved. | 0.028 0.018 | 0.126 0.022 |
| J020521.2045920 | 4.451 | 2.52 0.22 | 79 | 16.8 1.1 | 1130iiLine is unresolved. | 0.030 0.016 | 0.086 0.019 |
| J020525.7045927 | 4.491 | 2.15 0.24 | 55 | 22.0 1.1 | 1120iiLine is unresolved. | 0.017 0.016 | 0.106 0.020 |
| J142342.3354607 | 4.31: | 0.032 0.008 | 0.152 0.009 | ||||
| J142350.8354512 | 4.376 | 3.40 0.18 | 82 | 15.2 1.1 | 1150iiLine is unresolved. | 0.021 0.011 | 0.110 0.085 |
| J142541.7353351 | 4.409 | 5.83 0.25 | 335 | 26.3 1.1 | 370 | 0.041 0.010 | 0.046 0.034 |
| J142542.0353347 | 4.400 | 0.66 0.16 | 111 | 12.9 1.1 | 1140iiLine is unresolved. | 0.009 0.009 | 0.016 0.012 |
| 400/mm–grating observationshh Å; 1.86 Å pix-1 dispersion; Å.: | |||||||
| J020432.3050917 | 4.454 | 1.96 0.14 | 29 | 10.2 0.3 | 370 | 0.069 0.015 | 0.182 0.015 |
| J020439.0051116 | 4.446 | 8.32 0.18 | 291 | 11.3 0.3 | 440 | 0.027 0.020 | 0.077 0.017 |
| J020605.8050441 | 4.497 | 5.98 0.29 | 58 | 11.8 0.3 | 460 | 0.166 0.039 | 0.279 0.035 |
| J020611.7050457 | 4.489 | 3.01 0.22 | 111 | 8.6 0.3 | 280 | 0.015 0.021 | 0.073 0.029 |
| J020611.7050627 | 4.460 | 1.39 0.20 | 96 | 8.3 0.3 | 260 | 0.044 0.019 | 0.039 0.022 |
| J020614.1050032 | 4.466 | 1.52 0.20 | 22 | 7.7 0.3 | 220 | 0.124 0.028 | 0.186 0.027 |
| J142432.6353825 | 4.428 | 4.33 0.26 | 277 | 7.4 0.3 | 190 | -0.011 0.051 | 0.042 0.057 |
| J142439.8353801 | 4.484 | 0.68 0.42 | 16jj lower limit. The measurement of the red–side continuum for this source is formally consistent with no observable flux. The equivalent width limit was then set by using a upper limit to in the expression given in footnote (c). | 7.8 0.3 | 230 | -0.035 0.059 | -0.004 0.060 |
| J142545.5352259 | 4.452 | 1.42 0.09 | 110 | 10.3 0.3 | 380 | 0.010 0.012 | 0.035 0.009 |
| J142624.4353832 | 4.457 | 2.71 0.11 | 60 | 3.3 0.3 | 270iiLine is unresolved. | 0.078 0.013 | 0.122 0.013 |
| J142628.5353808 | 4.407 | 6.54 0.16 | 517 | 7.7 0.3 | 220 | -0.094 0.011 | 0.034 0.021 |
2.2. Spectroscopic Observations
Between 2000 April and 2003 May, we obtained deep spectra of a cross–section of emission line candidates with the Low Resolution Imaging Spectrometer (LRIS; Oke et al. 1995) at the Cassegrain foci of the 10m Keck I and Keck II telescopes (pixel scale 0.215″pix-1). The observations were divided between two spectrograph configurations: low resolution, red channel–only observations employing the 150 lines mm-1 grating ( Å; 4.8 Å pix-1 dispersion; Å km s-1), and higher resolution observations employing simultaneously the blue–channel 300 lines mm-1 grism ( Å; 2.64 Å pix-1 dispersion; 14 Å km s-1) and the red–channel 400 lines mm-1 grating ( Å; 1.86 Å pix-1 dispersion; Å km s-1) with a dichroic splitting the channels at 5000 Å. The data were taken with slitmasks designed to obtain spectra for targets simultaneously; we employed slit widths from to ″. Total exposure times ranged from 1.5 hours to 4.3 hours. In each case, the total exposure was broken into a small number of individual integrations between which we performed spatial offsets to facilitate the removal of fringing at long wavelengths. The airmass never exceeded 1.3 during the observations, and the seeing ranged from 0.7″ to 1.0″. There was no overlap between the objects targeted for 150/mm–grating observations and objects targeted for 400/mm–grating observations.
We used the IRAF111IRAF is distributed by the National Optical Astronomy Observatory, which is operated by the Association of Universities for Research in Astronomy, Inc., under cooperative agreement with the National Science Foundation. package (Tody 1993) to process the data following standard slit spectroscopy procedures. Some aspects of treating the two–dimensional data were facilitated by a custom software package, BOGUS222BOGUS is available online at http://zwolfkinder.jpl.nasa.gov/stern/homepage/bogus.html., created by D. Stern, A.J. Bunker, and S.A. Stanford. We extracted one–dimensional spectra using the optimal extraction algorithm described in Horne (1986). Wavelength calibrations were performed in the standard fashion using Hg, Ne, Ar, and Kr arc lamps; we employed telluric sky lines to adjust the wavelength zero–point. We performed flux calibrations with longslit observations of standard stars from Massey & Gronwall (1990) taken with the instrument in the same configuration as the corresponding slitmask observation. As the position angle of an observation was set by the desire to maximize the number of targets on a given slitmask, the observations were generally not made at the parallactic angle. Moreover, the data were generally not collected under photometric conditions: five of our six observing runs were affected by light to moderate cirrus.

To investigate the possibility that the sky–subtraction performed during object extraction introduced systematic errors, we made twenty extractions of ostensibly source–free regions in the two–dimensional spectra, employing the same trace used on the neighboring Ly–emitting candidate. We then fit the resulting “blank–sky” spectra in exactly the same way and over exactly the same wavelength region that we fit for continuum redward and blueward of the emission line in the object extractions (see § 3 and Table 1). In the complete absence of systematic errors, we expect the blank–sky fits to be zero, barring photon counting statistics. In fact, we find a tiny residual signal: Jy 0.002 Jy blueward of the emission lines, and Jy 0.001 Jy redward of the emission lines. These values and their error bars constitute the weighted–averages of the residual signals measured in the 20 extractions, where the weights are the uncertainty in each fit. The error bars represent the uncertainty in the mean residual level (i.e. rather than the scatter among the twenty measurements). The residual signals were subtracted from the object continuum fits, and the errors were adjusted accordingly.
3. Spectroscopic Results
Of 25 spectroscopic candidates, 18 were confirmed as galaxies at . All but one of the 18 confirmed galaxies show Ly in emission; the remaining galaxy lacks an emission line but shows a large spectral discontinuity identified as the onset of foreground Ly–forest absorption at Å. Of the 7 targets that were not confirmed as Ly–emitters, 6 were non–detections (to a 5 upper limit of ergs cm-2 s-1), and one was a clear [O II] 3727–emitter at , based on the presence of continuum blueward of the emission line. Table 1 gives the redshifts of the confirmed Ly–emitters and summarizes the properties of the emission lines. Figures 1 and 2 contain the confirming spectra.

We note that each confirmation of a Ly–emitter originates in the spectroscopic detection of a single emission line, the interpretation of which can be problematic. In general, a single, isolated line could be any one of Ly, [O II] 3727, [O III] 5007, or H, though given sufficient spectral coverage most erroneous interpretations can be ruled out by the presence of neighboring emission lines: H and [O III] 4959 for [O III] 5007; [N II] 6548,6583 and [S II] 6716,6731 for H. Hence, the primary threat to determining one–line redshifts is the potential for misidentifying Ly as [O II] 3727, or vice versa. Even so, [O II] 3727 at is generally accompanied by the H plus [O III] 4959,5007 complex, redshifted to Å. Such a detection is challenging, owing to heavy contamination by night–sky emission lines in this region of the spectrum. Nonetheless, each spectrum described herein is consistent with an [O III] 5007 non–detection, with a typical 5 upper limit to [O III] 5007 flux of ergs cm-2 s-1. One source has a 5 upper limit of ergs cm-2 s-1; the search region for [O III] 5007 in this case happens to fall directly on prominent sky line residuals. Ignoring this outlier, the scatter in the 5 upper limits for the remaining 17 sources is just ergs cm-2 s-1.
3.1. Results from the 400/mm–Grating Observations
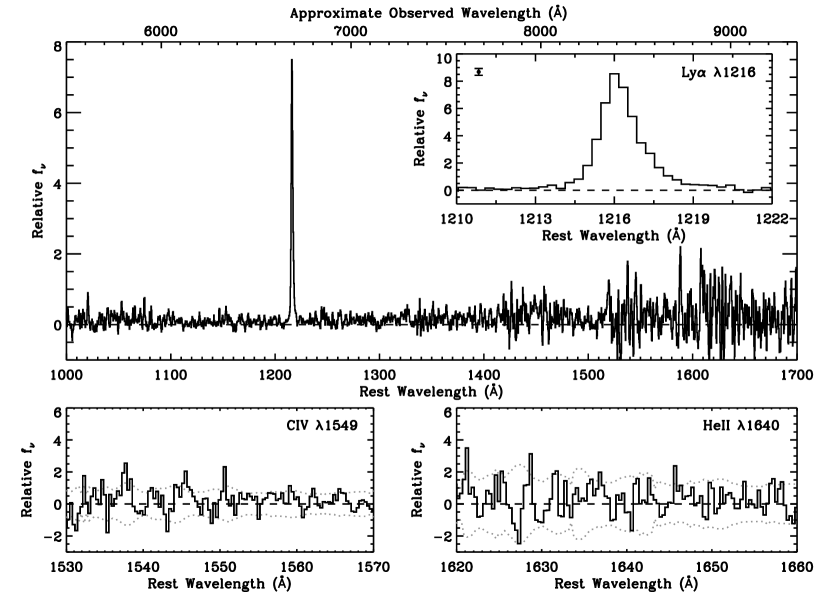
The confirmed sources observed in our higher–resolution (400/mm) spectroscopic configuration typically show the asymmetric emission line profile characteristic of high–redshift Ly, where neutral hydrogen outflowing from an actively star–forming galaxy imposes a sharp blue cutoff and broad red wing (e.g. Stern & Spinrad 1999; Manning et al. 2000; Dawson et al. 2002; Hu et al. 2004; Rhoads et al. 2003). The opposite profile is expected for [O II] 3727 observed at this resolution (e.g. see Rhoads et al. 2003); hence, the asymmetry typically detected in our higher–resolution sample is good evidence for the Ly–interpretation.

To quantify this conclusion, we consider two measures of line asymmetry (see Rhoads et al. 2003, 2004). For both, we determine the wavelength of the peak of the emission line (), and where the line flux exceeds 10% of the peak on the blue side () and on the red side (). The “wavelength ratio” is then , and the “flux ratio” is 333The error bars on and were determined with Monte Carlo simulations in which we modeled each emission line with the truncated Gaussian profile described in Hu et al. (2004) and Rhoads et al. (2004), added random noise in each pixel according to the photon counting errors, and measured the widths and of the resulting distributions of and for the given line. That is, for each , the error , and similarly for each .. As in Rhoads et al. (2004), we experimented with raising and lowering the flux threshold but found no clear benefit to using values other than 10%. Lowering the threshold results in enhanced contamination from continuum noise, increasing the scatter and uncertainty in the measurements; raising the threshold diminishes the contribution of the broad, red Ly wing to the measurement, reducing the ability of the asymmetry measures to discriminate Ly from symmetric interlopers. Figure 3 compares the distribution in – space of 28 [O II] 3727–emitters (provided by the DEEP2 team; Davis et al. 2003, A. Coil 2004, private communication) to 22 confirmed and putative high–redshift Ly–emitters. As a population, the Ly–emitters are systematically segregated from the [O II] 3727–emitters. While the [O II] 3727–emitters are distributed according to and , all save one of the Ly–emitters satisfies or , and more than half satisfy both.
We note that one source included herein as a confirmed Ly–emitter (J020611.7050457) falls in the region of – space characteristic of the [O II] 3727–emitters. With () and (), the asymmetry measures do not favor the Ly–interpretation for this source, while the lack of blue continuum emission, on the other hand, does not favor the [O II] 3727–interpretation. The large equivalent width measured for the line is similarly ambiguous. For Ly, the redshift is and the observed frame equivalent width of Å 200 Å () implies a rest frame equivalent width of Å 37 Å (). This value is consistent with for other high–redshift Ly–lines presented here and elsewhere (Hu & McMahon 1996; Cowie & Hu 1998; Hu et al. 1998; Malhotra & Rhoads 2002; Rhoads et al. 2003). Alternatively, interpreting the emission line as [O II] 3727 implies a rest frame equivalent width of Å. Such a large value for [O II] 3727 is rare but not wholly unprecedented: large continuum–selected (Cowie et al. 1996; Hogg et al. 1998) and H–selected (Gallego et al. 1996) samples indicate that [O II] 3727 very rarely exceeds Å, but at least one exceptional source with Å at is known (Stern et al. 2000). The [O II] 3727–interpretation would further imply the presence of [O III] 5007 at a redshifted wavelength of 8980 Å; no such line is detected to a 5 upper limit of ergs cm-2 s-1. Though we tentatively include this source among our confirmed Ly–emitters, the reader is encouraged to keep the foregoing caveat concerning its interpretation in mind.
3.2. Results from the 150/mm–Grating Observations
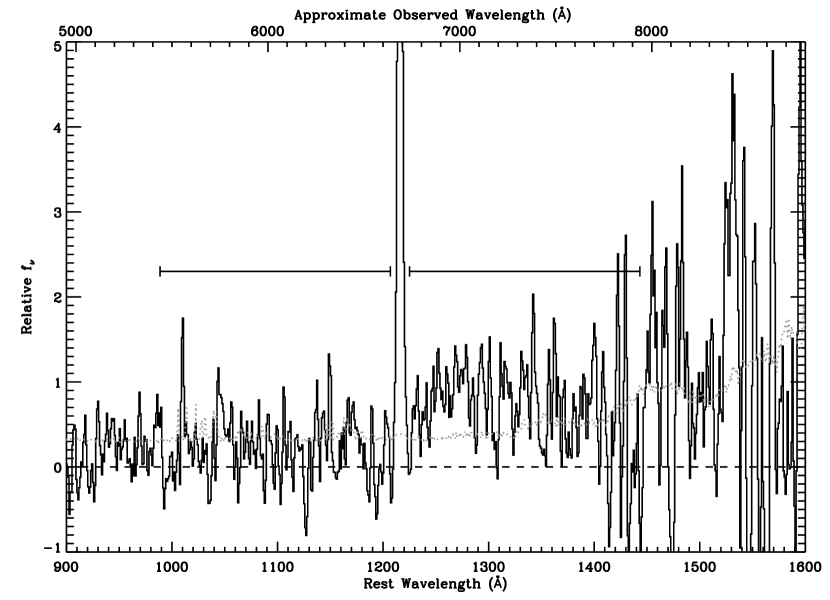
Our lower resolution (150/mm) spectroscopic configuration trades sensitivity to line shape for sensitivity to continuum. Therefore, while the (typically unresolved) line profiles in this sample are less useful for discriminating Ly from [O II] 3727, the continuum detection (if any) can be used to measure the amplitude of the discontinuity at the emission line. On the Ly–interpretation, we expect a continuum break owing to the onset of absorption by the Ly–forest at Å, a robust spectral signature used extensively in the photometric selection of galaxies at (e.g. Dey et al. 1998; Weymann et al. 1998; Spinrad et al. 1998; Lehnert & Bremer 2003). The likely low–redshift interloper in this case is the 4000 Å break [], resulting from the sudden onset of stellar photospheric opacity shortward of 4000 Å. We characterize the break amplitude in the 150/mm–grating observations with , where is the variance–weighted average flux density in a 1200 Å window beginning 30 Å below the emission line, and is the same, but above the emission line. The median of the 1 lower limits to the amplitude of the flux decrement in our candidates, calculated from Monte Carlo simulations of the flux densities with the constraint , is then . This value is entirely consistent with both theoretical models of the Ly break amplitude at (e.g. Madau 1995; Zhang et al. 1997) and with measurements from existing data sets (see Stern & Spinrad 1999, and references therein). By contrast, a sample of 43 galaxies in the redshift range (roughly corresponding to the resulting redshift if [O II] 3727 has been misidentified as Ly) has amplitudes of (Dressler & Gunn 1990). We take Ly as the most likely line identification under these circumstances.
We present an unweighted coaddition of the 11 400/mm spectra in Figure 4 and of the 7 150/mm spectra in Figure 5. With its higher resolution, the 400/mm composite spectrum highlights the asymmetry of the Ly emission line. We find () and () for the composite. With its greater sensitivity to continuum, the 150/mm composite highlights the spectral discontinuity at the emission line. We find () for the composite. The rest frame equivalent widths of the composite emission lines are Å 13 Å () and Å 13 Å (), respectively.
3.3. Spectroscopic Non–Detections
Of the six spectroscopic non–detections, three candidates fell on slitmasks observed under adverse conditions for which the general spectroscopic yield was low. As such, our failure to confirm these targets as Ly–emitters should not be interpreted as a reflection on the efficacy of candidate selection. The remaining three non–detections were observed under acceptable or photometric conditions, for which the general spectroscopic yield was high. However, each of these targets was suboptimal for one of a variety of reasons: one target sits on a weak satellite residual; one target is very close to a bright star; one target appears in an initial epoch of imaging but not in subsequent epochs and is therefore likely a variable source or a spurious detection. For the remainder of this paper, we will cite a selection reliability of 72%, but the reader is cautioned that this is the most conservative estimation; it does not discriminate between spurious candidates produced at the stage of narrow band–selection, or failures in the spectroscopic follow–up. That is, this figure for the selection reliability does not imply that 28% of candidate Ly–emitters in narrow band imaging surveys are unsound.
4. Discussion
4.1. The Statistics of the Population
The spectroscopic confirmation of 17 Ly–emitters out of 25 candidates allows us to update the statistics of this population as they were presented in Malhotra & Rhoads (2002). By applying a correction factor to the observed source counts, we find a number density of Ly–emitters per square degree per unit redshift above a detection threshold of ergs cm2 s-1. This figure translates to a Ly–luminosity density at of Mpc-3 for sources with . Hu et al. (1999) give a conversion factor of 1 yr ergs s-1 for converting Ly–luminosities into star formation rates (but see the caveats in Rhoads et al. 2003); together with the Ly–luminosity density estimate, this yields a star formation rate density at of yr-1 Mpc-3, with individual star formation rates ranging from 1 yr-1 to 16 yr-1. These results are roughly consistent with previous studies with similar limiting fluxes (e.g. Hu et al. 1998; Ouchi et al. 2003).
4.2. The Equivalent Width Distribution
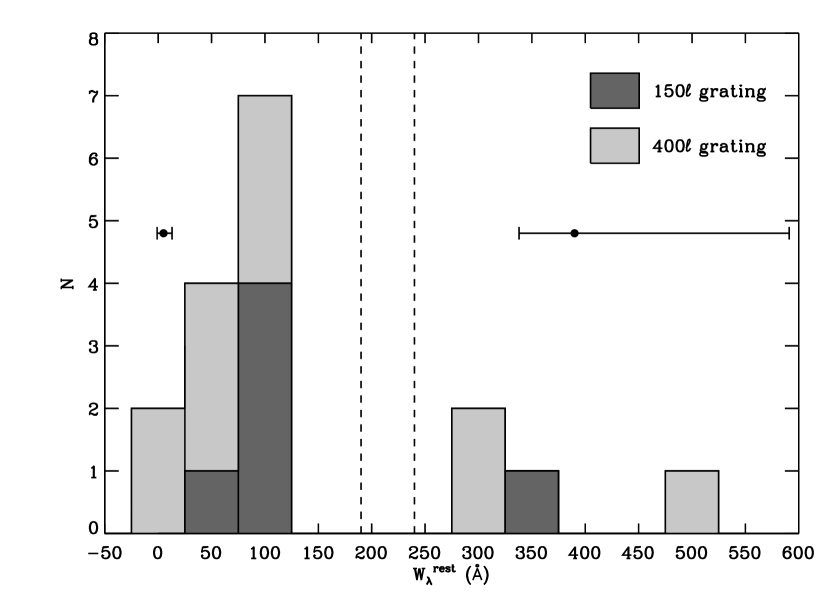
The rest frame equivalent widths reported for each source in Table 1 were determined directly from the spectra according to , where is the flux in the emission line and is the measured red–side continuum flux density. For the one case with formally consistent with zero, we derive a lower limit to the equivalent width. The resulting equivalent width distribution is plotted in Figure 6, with individual measurements keyed to the grating with which each source was observed. There is no obvious systematic difference between equivalent widths measured in our lower resolution spectroscopic configuration and those measured in our higher resolution configuration.
Using Starburst99 models (Leitherer et al. 1999) with a Salpeter initial mass function (IMF), an upper mass cutoff of 120 , and a metallicity of 1/20th solar, Malhotra & Rhoads (2002) calculated maximum equivalent widths of 300 Å for a one Myr–old stellar population, 150 Å for a 10 Myr–old population, and 100 Å for populations older than years. Owing to the lower metallicity, these values are slightly higher than the previous calculations of Charlot & Fall (1993), who present 240 Å as the highest equivalent width achievable by a stellar population.
To properly compare these model predictions to the equivalent width distribution presented herein, one must first account for absorption in the intergalactic medium (IGM), which affects the observations but is not included in the models. Equivalent widths determined from spectroscopy are based on the flux in the observed emission line (which may be affected by intergalactic absorption), and on the red–side continuum flux density (which is unaffected by intergalactic absorption). Malhotra & Rhoads (2002) used the prescription for IGM absorption given by Madau (1995) to derive a flux decrement of a factor of 0.64 for an intrinsically symmetric Ly emission line centered on zero velocity. Of course, this calculation neglects the effects of the dust content and detailed kinematics of the galaxy ISM, which increasingly appear to play a significant role in determining the emergent Ly profile (e.g. Kunth et al. 1998; Stern & Spinrad 1999; Mas–Hesse et al. 2003; Shapley et al. 2003; Ahn 2004). Nonetheless, adopting this correction factor as an upper limit on possible IGM effects dictates that the limiting model equivalent widths measured spectroscopically would be 190 Å, 100 Å, and 60 Å for populations of ages and years respectively.
A second concern regarding the equivalent width determination in spectroscopy is the high sensitivity to uncertainty in the continuum measurement. Since the continuum estimate enters into the denominator of the expression for , the characteristically small continuum values, along with their considerable error bars, tend to cause large scatter in the results. Not surprisingly, the sources in our sample with the largest measured equivalent widths tend also to have the largest fractional uncertainty therein.
With these caveats in mind, we performed a careful statistical analysis designed to place rigorous constraints on the number of galaxies in our sample with equivalent widths in excess of the maximum values allowed by stellar population models. First, we associated each measured line flux with a Gaussian probability density function (PDF) centered on with width ; we proceeded similarly for the measured continuum fluxes. We then generated a grid of line flux versus continuum flux on which each node has an associated equivalent width and is assigned a weight according to the Gaussian error distribution on each of its fluxes. Next we collapsed the grid into a histogram of equivalent widths, adding the weight from each grid point to the appropriate equivalent width bin. The result is a non–Gaussian PDF for which is the probability of observing in the interval . We used the final ensemble of to determine the likelihood that exactly galaxies in our sample exceed some limiting , and we added these likelihoods to determine the confidence with which a range of galaxies exceed that limit.
Proceeding in this fashion, we find with 90% confidence that 3 to 5 galaxies in our sample exceed the fiducial Charlot & Fall (1993) upper limit of Å, and with 91% confidence that 4 to 6 galaxies exceed Å, the upper limit of Malhotra & Rhoads (2002), with the largest reasonable correction for IGM absorption. Thus, no matter how one treats the effects of IGM absorption on the maximum equivalent widths predicted by stellar population models, we find a significant fraction of our sample in excess of those limits. These galaxies are required to be very young (age years), or to have skewed IMFs, or perhaps to harbor AGN producing stronger–than–expected Ly emission.
4.3. AGN Among the Population?
Given the large equivalent widths measured for the high–redshift Ly emission in this sample and elsewhere (Kudritzki et al. 2000; Rhoads et al. 2003, 2004), one intriguing scenario is the possibility that our narrow band selection has identified a large population of high–redshift AGN. However, the recent non–detections in deep ( ks) Chandra/ACIS imaging of the narrow band–selected sources in the LALA Boötes field (Malhotra et al. 2003) and the LALA Cetus field (Wang et al. 2004) have placed strong constraints against AGN activity among the Ly–emitters. No individual Ly candidate was detected with Chandra/ACIS to a 3 limiting X–ray luminosity of erg s-1. The constraint is even stronger in the stacked X–ray image, which suggests a 3 limit to the average X–ray luminosity of erg s-1. This limit is roughly an order of magnitude fainter than what is typically observed for even the heavily obscured, Type II AGN (e.g. Stern et al. 2002; Norman et al. 2002; Dawson et al. 2003).
The case against AGN activity among the Ly–emitters is further borne out by the optical spectroscopy presented herein. The narrow physical widths of the Ly emission lines ( km s-1) definitively rule out conventional broad–lined (Type I) AGN, and also disfavor narrow–lined (Type II) AGN, which have typical km s-1. Furthermore, no individual spectrum shows evidence of the high–ionization state UV emission lines symptomatic of AGN activity (e.g. N V 1240, C IV 1549, He II 1640) nor is there evidence of such lines in the composite spectra (Figures 4 and 5). In particular, C IV 1549 flux in the /mm composite spectrum is constrained to be () of the flux in Ly, implying a flux ratio of . By contrast, the three Type II AGNs cited above span only .
4.4. Population III Among the Population?
The identification of a population of large equivalent width Ly–emitters evidently powered by star formation in low metallicity gas suggests that we are closing the gap between the first, little–enriched primordial galaxies and the higher metallicities of massive galaxies in the local universe. Indeed, recent numerical studies of the rest frame UV and optical properties of very low metallicity stellar populations indicate that Ly emission increases strongly with decreasing metallicity, far exceeding Å for (e.g. Schaerer 2003). The tantalizing limit of such studies is star formation in zero metallicity gas, the so–called Population III, which constitutes the first bout of star formation in the pre–galactic Universe.
The striking features of massive Population III stars are their high effective temperatures ( K for ) and consequent hard ionizing spectra, resulting in the production of 60% more H I–ionizing photons than their Population II counterparts, and up to times more He II–ionizing photons (Tumlinson et al. 2003). As a consequence, in addition to high equivalent width Ly emission, a unique observational signature of this primeval population is emission from He II recombination lines. These lines are particularly attractive for a detection experiment since they suffer minimal effects of scattering by gas and benefit from decreasing attenuation by dust. That said, the possibility for the direct detection of He II 1640 in the present data set boils down to two questions: Is Population III star–formation occurring at the comparatively late epoch occupied by the Ly–emitters? And if so, is the resulting He II emission of sufficient luminosity to be detected?
As for the first question, if star formation feedback in the Universe is sufficiently weak that metal production proceeds very inhomogeneously, then Population III star formation may continue to surprisingly low redshifts, occurring in regions that have not yet been polluted by previous episodes of star formation. To this end, the analytical models of Scannapieco et al. (2003) designed to investigate the detectability of primordial star formation indicate that Population III objects tend to form in the – mass range, just large enough to cool within a Hubble time, but small enough that they are not clustered near areas of previous star formation. The result is that somewhere between 1% and 30% of strong Ly–emitters at should owe their Ly emission to Population III star formation, depending on the strength of feedback in these systems.
As for the detectability of the resulting He II emission, early predictions of Ly and He II recombination luminosities in metal–free stellar clusters suggest He II 1640 emission in excess of 13% that of Ly, with Å (Bromm et al. 2001). Notably, Schaerer (2002) points out that the prediction of such a large equivalent width likely results from neglecting the contribution of nebular continuum emission to the model Population III spectrum, which dominates the SED for Å and therefore reduces the expected equivalent width. More recent models are indeed more conservative in their predictions of the strength of He II emission. Tumlinson et al. (2003) suggest He II fluxes for a Population III cluster at ranging from 0.001% to 5% of the flux in Ly, where the low extremum is set by the limiting case of an instantaneous starburst, and the high extremum is set by constant star formation at rate of yr-1. Schaerer (2003) predicts He II 1640 equivalent widths in excess of 80 Å for very young zero–metallicity instantaneous starbursts, though at ages greater than Myr, values Å are expected only at metallicities .
Physically, the best prospect for detecting He II 1640 in our spectroscopic sample lies with the spectra containing Ly at the highest equivalent widths. However, He II 1640 at the suggested flux levels is undetectable in any of our individual spectra, leaving only the possibility that a constraint to He II 1640 emission may be derived from the composite spectrum, where we benefit from a –reduction in Poission noise. Accordingly, we performed Monte Carlo simulations aimed at measuring He II 1640 emission in the /mm composite, searching over a distribution of potential He II 1640 line widths set by the width of the composite Ly line. The result is a He II 1640 flux which is formally consistent with zero, with a 2 (3) upper limit of 13% (20%) of the flux in Ly. The corresponding 2 (3) upper limit to the He II 1640 rest frame equivalent width is 17 Å (25 Å). This equivalent width limit is sufficient to rule out the youngest zero–metallicity instantaneous burst and continuous SFR models of Schaerer (2003), though metallicities of are still permissible. We therefore conclude that this data set cannot corroborate the proposition (e.g. Tumlinson et al. 2003) that the high equivalent widths of the narrow band–selected Ly–emitters suggest that the first metal–free stars have already been found.
5. Conclusion
Out of 25 narrow band–selected candidates, we have spectroscopically confirmed 18 galaxies at , implying a selection reliability of 72%. The resulting sample of confirmed Ly emission lines show large equivalent widths (median Å) but narrow physical widths ( km s-1), supporting the conclusion of Malhotra et al. (2003) and Wang et al. (2004) that the Ly emission in these sources derives from star formation, not from AGN activity. Moreover, though the expectation from theoretical models of galaxy formation in the primordial Universe is that a small fraction of Ly–emitting galaxies at may be nascent, metal–free objects, we do not detect He II 1640 emission in either individual or composite spectra, indicating that though these galaxies are young, they show no evidence of being truly primitive, Population III objects. Of course, this last result may be a function of our comparatively small sample size, which could only be reasonably expected to yield a He II 1640 detection if the frequency of Population III objects among Ly–emitters exceeds . Clearly, increasing our sample size with future spectroscopy will provide a far tighter constraint on the make–up of the galaxy population.
One heretofore unexplored consideration is the possibility that galactic–scale winds may be required to work in concert with sub–solar metallicities to facilitate the escape of Ly radiation from a system (e.g. Kunth et al. 1998; Ahn 2004). In this scenario, the low metallicity acts to reduce the dust opacity, and the wind acts to Doppler shift the absorbers, minimizing resonant scattering of Ly photons. The detailed geometry of the interstellar medium (ISM) doubtless plays several roles in this process. As one example, a galactic wind driven by star formation has its origin in an over–pressured cavity of hot gas inside the star–forming galaxy. This superbubble ultimately expands and bursts out into the galaxy halo; naturally this expansion, and hence the galactic wind, proceeds in the direction of the vertical pressure gradient (Heckman et al. 2000; Tenorio–Tagle et al. 1999). As a second example, if dust and neutral gas in the ISM have a high covering factor but a low volume filling factor, it is possible for continuum radiation to be strongly absorbed while an appreciable fraction of Ly line radiation escapes (Neufeld 1991).
Observationally, the extent to which the emission of Ly photons in a star forming galaxy depends on not only the distribution and kinematics of gas and dust in its ISM, but also on the inclination of the system, remains an open question. Since significant Ly emission in SCUBA sources (Chapman et al. 2003) offers evidence that the deleterious effect of dust on Ly emission may be mitigated by strong starburst–driven winds, it appears unlikely that spectroscopy of the rest frame UV of high redshift Ly–emitters alone will be able to fully disentangle these effects. By contrast, a detailed understanding of the rest frame optical properties of the these systems would offer a strong lever arm on their dust contents and star formation histories. Hence, resolution of these issues may await infrared observations of the galaxy sample.
References
- Ahn (2004) Ahn, S. 2004, ApJ, 601, L25
- Bromm et al. (2001) Bromm, V., Kudritzki, R. P., & Loeb, A. 2001, ApJ, 552, 464
- Bunker et al. (2003) Bunker, A. J., Stanway, E. R., Ellis, R. S., McMahon, R. G., & McCarthy, P. J. 2003, MNRAS, 342, L47
- Chapman et al. (2003) Chapman, S. C., Blain, A. W., Ivison, R. J., & Smail, I. R. 2003, Nature, 422, 695
- Charlot & Fall (1993) Charlot, S. & Fall, S. M. 1993, ApJ, 415, 580
- Cowie & Hu (1998) Cowie, L. L. & Hu, E. M. 1998, AJ, 115, 1319
- Cowie et al. (1996) Cowie, L. L., Songaila, A., Hu, E. M., & Cohen, J. G. 1996, AJ, 112, 839
- Davis et al. (2003) Davis, M. et al. 2003, in Discoveries and Research Prospects from 6- to 10-Meter-Class Telescopes II. Edited by Guhathakurta, Puragra. Proceedings of the SPIE, Volume 4834, pp. 161-172 (2003)., 161–172
- Dawson et al. (2003) Dawson, S., McCrady, N. Stern, D., Eckart, M., Spinrad, H., Liu, M., & Graham, J. 2003, AJ, 125, 1236
- Dawson et al. (2002) Dawson, S., Spinrad, H., Stern, D., Dey, A., van Breugel, W., de Vries, W., & Reuland, M. 2002, ApJ, 570, 92
- Dawson et al. (2001) Dawson, S., Stern, D., Bunker, A. J., Spinrad, H., & Dey, A. 2001, AJ, 122, 598
- Dey et al. (1998) Dey, A., Spinrad, H., Stern, D., Graham, J. R., & Chaffee, F. H. 1998, ApJ, 498, L93
- Dressler & Gunn (1990) Dressler, A. & Gunn, J. E. 1990, in ASP Conf. Ser. 10: Evolution of the Universe of Galaxies, 200–208
- Fynbo et al. (2001) Fynbo, J. U., Möller, P., & Thomsen, B. 2001, A&A, 374, 443
- Gallego et al. (1996) Gallego, J., Zamorano, J., Rego, M., Alonso, O., & Vitores, A. G. 1996, A&AS, 120, 323
- Heckman et al. (2000) Heckman, T. M., Lehnert, M. D., Strickland, D. K., & Armus, L. 2000, ApJS, 129, 493
- Hogg et al. (1998) Hogg, D. W., Cohen, J. G., Blandford, R., & Pahre, M. A. 1998, ApJ, 504, 622
- Horne (1986) Horne, K. 1986, PASP, 98, 609
- Hu & McMahon (1996) Hu, E. & McMahon, R. G. 1996, Nature, 382, 281
- Hu et al. (2004) Hu, E. M., Cowie, L. L., Capak, P., McMahon, R. G., Hayashino, T., & Komiyama, Y. 2004, AJ, 127, 563
- Hu et al. (1998) Hu, E. M., Cowie, L. L., & McMahon, R. G. 1998, ApJ, 502, L99
- Hu et al. (1999) Hu, E. M., McMahon, R. G., & Cowie, L. L. 1999, ApJ, 522, L9
- Jannuzi & Dey (1999) Jannuzi, B. T. & Dey, A. 1999, in ASP Conf. Ser. 191, Photometric Redshifts and High Redshift Galaxies, ed. R. J. Weymann, L. J. Storrie-Lombardi, M. Sawicki, & R. J. Brunner (San Francisco: ASP), 111
- Kodaira et al. (2003) Kodaira, K. et al. 2003, PASJ, 55, L17
- Kudritzki et al. (2000) Kudritzki, R.-P. et al. 2000, ApJ, 536, 19
- Kunth et al. (1998) Kunth, D., Mas-Hesse, J. M., Terlevich, E., Terlevich, R., Lequeux, J., & Fall, S. M. 1998, A&A, 334, 11
- Lehnert & Bremer (2003) Lehnert, M. D. & Bremer, M. 2003, ApJ, 593, 630
- Leitherer et al. (1999) Leitherer, C. et al. 1999, ApJS, 123, 3
- Madau (1995) Madau, P. 1995, ApJ, 441, 18
- Malhotra & Rhoads (2002) Malhotra, S. & Rhoads, J. E. 2002, ApJ, 565, L71
- Malhotra et al. (2003) Malhotra, S., Wang, J. X., Rhoads, J. E., Heckman, T. M., & Norman, C. A. 2003, ApJ, 585, L25
- Manning et al. (2000) Manning, C., Stern, D., Spinrad, H., & Bunker, A. J. 2000, ApJ, 537, 65
- Mas–Hesse et al. (2003) Mas–Hesse, J. M., Kunth, D., Tenorio–Tagle, G., Leitherer, C., Terlevich, R. J., & Terlevich, E. 2003, ApJ, 598, 858
- Massey & Gronwall (1990) Massey, P. & Gronwall, C. 1990, ApJ, 358, 344
- Meier & Terlevich (1981) Meier, D. L. & Terlevich, R. 1981, ApJ, 246, L109
- Neufeld (1991) Neufeld, D. A. 1991, ApJ, 370, L85
- Norman et al. (2002) Norman, C. et al. 2002, ApJ, 571, 218
- Oke et al. (1995) Oke, J. B. et al. 1995, PASP, 107, 375
- Ouchi et al. (2003) Ouchi, M. et al. 2003, ApJ, 582, 60
- Partridge & Peebles (1967) Partridge, R. B. & Peebles, P. J. E. 1967, ApJ, 147, 868
- Pascarelle et al. (1998) Pascarelle, S. M., Windhorst, R. A., & Keel, W. C. 1998, AJ, 116, 2659
- Rhoads & Malhotra (2001) Rhoads, J. E. & Malhotra, S. 2001, ApJ, 563, L5
- Rhoads et al. (2000) Rhoads, J. E., Malhotra, S., Dey, A., Stern, D., Spinrad, H., & Jannuzi, B. T. 2000, ApJ, 545, L85
- Rhoads et al. (2003) Rhoads, J. E. et al. 2003, ApJ, 125, 1006
- Rhoads et al. (2004) —. 2004, ApJ, 611, 59
- Scannapieco et al. (2003) Scannapieco, E., Schneider, R., & Ferrara, A. 2003, ApJ, 589, 35
- Schaerer (2002) Schaerer, D. 2002, A&A, 382, 28
- Schaerer (2003) —. 2003, A&A, 397, 527
- Shapley et al. (2003) Shapley, A. E., Steidel, C. C., Pettini, M., & Adelberger, K. L. 2003, ApJ, 588, 65
- Spinrad et al. (1998) Spinrad, H., Stern, D., Bunker, A., Dey, A., Lanzetta, K., Yahil, A., Pascarelle, S., & Fernández–Soto, A. 1998, AJ, 116, 2617
- Steidel et al. (2000) Steidel, C. C., Adelberger, K. L., Shapley, A. E., Pettini, M., Dickinson, M., & Giavalisco, M. 2000, ApJ, 532, 170
- Stern et al. (2000) Stern, D., Eisenhardt, P., Spinrad, H., Dawson, S., van Breugel, W., Dey, A., de Vries, W., & Stanford, S. A. 2000, Nature, 408, 560
- Stern & Spinrad (1999) Stern, D. & Spinrad, H. 1999, PASP, 111, 1475
- Stern et al. (2002) Stern, D. et al. 2002, ApJ, 568, 71
- Tenorio–Tagle et al. (1999) Tenorio–Tagle, G., Silich, S. A., Kunth, D., Terlevich, E., & Terlevich, R. 1999, MNRAS, 309, 332
- Tody (1993) Tody, D. 1993, in ASP Conf. Ser. 52, Astronomical Data Analysis Software and Systems II, ed. R. Hanisch, R. Brissenden, & J. Barnes (San Francisco: ASP), 173
- Tumlinson et al. (2003) Tumlinson, J., Shull, J. M., & Venkatesan, A. 2003, ApJ, 584, 608
- Wang et al. (2004) Wang, J. X. et al. 2004, ApJ, 608, L21
- Weymann et al. (1998) Weymann, R. J., Stern, D., Bunker, A., Spinrad, H., Chaffee, F. H., Thompson, R. I., & Storrie–Lombardi, L. J. 1998, ApJ, 505, L95
- Zhang et al. (1997) Zhang, Y., Anninos, P., Norman, M. L., & Meiksin, A. 1997, ApJ, 485, 496