AMBIPOLAR-DIFFUSION TIMESCALE, STAR-FORMATION TIMESCALE, AND THE AGES OF MOLECULAR CLOUDS: IS THERE A DISCREPANCY ?
Abstract
We re-examine critically the estimates of the duration of different phases of star formation and the lifetimes of molecular clouds, based on the ages of T-Tauri stars, age spreads of stars in clusters, and statistics of pre-stellar cores. We show that all available observational data are consistent with lifetimes of molecular clouds comparable to yr, as well as with the predictions of the theory of self-initiated, ambipolar-diffusion–controlled star formation. We conclude that there exists no observational support for either “young” molecular clouds or “rapid” star formation.
Subject headings:
accretion – IS dust – magnetic fields – MHD – molecular clouds: ages – star formation1. Introduction
According to the theory of self-initiated, ambipolar-diffusion–controlled star formation, ambipolar diffusion is responsible for the fragmentation of molecular clouds and the formation of thermally and eventually magnetically supercritical protostellar fragments (or cores) in initially magnetically subcritical parent clouds (see reviews by Mouschovias 1987, 1996, and references therein). The formation of supercritical fragments takes place on a timescale between and a few yr, depending on the initial mass-to-flux ratio, and degree of ionization of the parent cloud. The subsequent contraction of the supercritical cores and the formation of stars within them is dynamic but slower than free-fall.
A number of authors have recently claimed that a series of observational results on the ages of molecular clouds and the timescale of star formation suggest that molecular clouds are “young” compared to the ambipolar-diffusion timescale, and hence these observations contradict the predictions of the ambipolar-diffusion theory (e.g., Hartmann et al. 2001; Elmegreen 2000). We re-examine these underlying observations and show that the timescales they claim to be measuring are severely underestimated, because they only represent part of the relevant processes (star formation and lifetimes of molecular clouds). We then show that the quantitative predictions of the ambipolar-diffusion theory for the timescales of the observed phases of star formation are in excellent agreement with observations. There is no observational support for a scenario of “rapid star formation”.
2. Age of T-Tauri Stars and its Relation to the Star-Formation Timescale and the Age of Molecular Clouds
It has been argued that the sound-crossing time in molecular clouds, given their observed typical size and temperature, is yr and that (1) this places a lower limit on the lifetime of molecular clouds, and (2) that the clouds are expected to harbor a stellar population of comparable age (Hartmann et al. 1991). Yet, based on Hayashi-track age estimates, the pre-main–sequence stars found in surveys are typically younger ( yr) (Herbig, 1978; Cohen & Kuhi, 1979; Herbig et al. , 1986). This apparent discrepancy is known as the “Post–T-Tauri Problem”.
Hartmann et al. (1991) estimated the age of T-Tauri stars in the Taurus molecular cloud using pre-main–sequence evolutionary tracks to obtain their masses and from that the Kelvin-Helmholtz timescale. They found a relatively short mean age ( yr) and they concluded that the mass estimates from standard Hayashi pre-main-sequence evolutionary tracks are not reliable. Gomez et al. (1992) repeated the study for a larger sample of newborn stars at different parts of the Taurus cloud with the same results. However, this time the conclusion was that the molecular clouds must be younger than previously thought. Subsequent work focused on refining the pre-main–sequence evolutionary tracks, but comparison between different sets of tracks for low-mass pre-main–sequence stars yield only a factor of 2 difference in the age estimates (White et al. , 1999; Simon et al. , 2001). Hence the consensus is that the expected population of older ( 5 Myr) pre-main–sequence stars is missing.
The above considerations have led to the “Rapid Star Formation” scenario (Ballesteros-Paredes et al. 1999; Elmegreen 2000; Hartmann 2001; Hartmann et al. 2001), which favors short-lived ( a few Myr) molecular clouds and consequently a short ( Myr) timescale of star formation. According to this scenario, giant molecular clouds form rapidly (in a time yr) due to colliding streams of turbulent flows. “Cores” (of sizes ) within giant molecular clouds then also form rapidly due to supersonic turbulence and immediately collapse dynamically to form stars.
2.1. Star-Formation Timeline
Although the observations cited above have significantly contributed to a better understanding of the T-Tauri phase of star formation, the conclusions that have been drawn from them concerning the overall duration of the star-formation process and the ages of molecular clouds are not valid. They are based on a fundamentally flawed understanding of the star formation timeline.
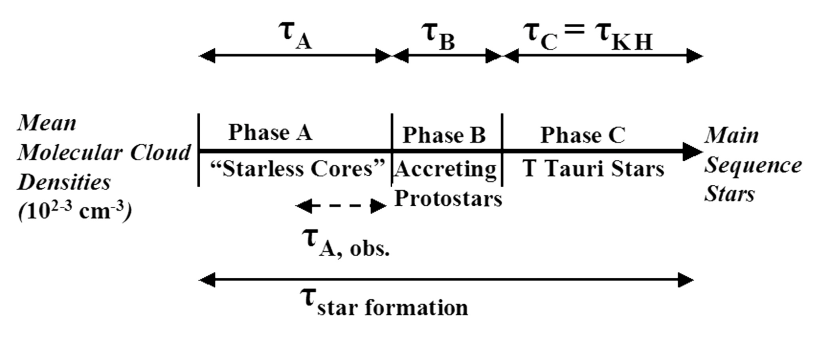
To demonstrate this point, we show in Figure 1 a star-formation timeline depicting the star-formation process as a whole, starting at mean molecular cloud densities and ending with the emergence of zero-age main-sequence stars. We distinguish three different phases. In phase A, which has a duration , typical “starless cores” form and contract toward the creation of protostars. At the end of phase A, hydrostatic protostellar cores (protostars) have formed, and accrete mass through phase B, which has a duration . Finally, when mass accretion stops, the pre-main–sequence stars contract, almost at constant mass, at the Kelvin-Helmholtz timescale . These objects are known as T-Tauri stars, and the time interval during which the Kelvin-Helmholtz contraction takes place is phase C, with duration . At the end of phase C, the stars reach the zero-age main-sequence.
All the aforementioned observational work estimates the duration of the T-Tauri phase, or phase C in Figure 1. The “zero point” of what the authors call “age” of the T-Tauri stars is the beginning of phase C. Therefore, all the quoted estimates for the “ages” are only estimates of . These measurements offer no information at all on the duration of phases A and B, and hence on the duration of the star-formation process as a whole, or on the ages of molecular clouds.
The notion that phases A and B are short compared to phase C (T-Tauri phase) and therefore the duration of phase C sets the timescale for the star formation process as a whole is not (and cannot be) supported by observations measuring only the duration of phase C. In fact, as we discuss in §4, measurements of the duration of phase A yield . Consequently, neglecting phase A leads to a serious underestimate of the timescale of star formation and to erroneous conclusions about the age of molecular clouds.
If the neglected time interval corresponding to phase A is long compared to the Kelvin-Helmholtz timescale (as is typically, but not always, the case in ambipolar-diffusion–induced core formation in magnetically subcritical clouds), then the overall ages of the pre-main–sequence stars are yr, and the “post-T-Tauri” problem no longer exists.
3. Age Spreads of Stars in Clusters
Observations of the age spreads of stars in Galactic open clusters have yielded diverse results. Some observations showed significant age spreads (e.g., NGC 3293, Herbst & Miller 1982; NGC 6231, Sung et al. 1998), while others found no appreciable age spreads (e.g. NGC 6531, Forbes 1996; NGC 3293, Baume et al. 2003). Similarly, attempts to use the spread of the estimated ages of T-Tauri stars to study the history of star-forming regions (Palla & Stahler 2000) were hampered by observational errors and uncertainties (Hartmann 2001). Still, results suggesting small age spreads in star clusters have been used to draw support for the idea that molecular clouds are younger than their sound crossing times ( yr) and for the rapid star-formation scenario (e.g., Elmegreen 2000).
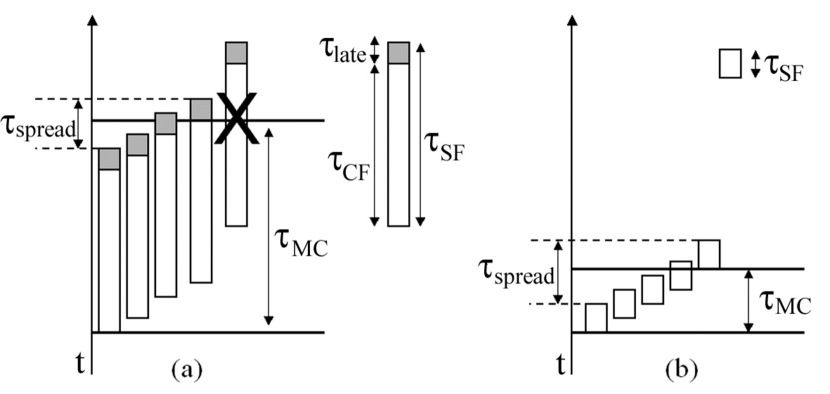
These conclusions are based on the implicit assumption that the cluster age spread is always comparable to the molecular cloud lifetime, , which, as shown in Figure 2, is not true. Figure 2 is a sketch of the star formation history of a molecular cloud according to the ambipolar-diffusion theory (Fig. 2a), and according to the rapid star-formation scenario (Fig. 2b). Time increases upward along the vertical axes. The two solid horizontal lines represent the instances of birth and dispersion of the parent cloud. Each parallelogram represents the time for the formation of stars from material of mean cloud density. The first star forms after the birth of the cloud. In Figure 2a, (longer, unshaded part of each parallelogram) is the time required for the formation of a magnetically supercritical core and is comparable to the ambipolar-diffusion timescale, ; and (shorter, shaded part of each parallelogram) is the duration of the later stages of star formation. No stars can form after the dispersion of the parent cloud unless a supercritical core has already formed by the time of dispersion. Hence, the rightmost parallelogram in Figure 2a is not realizable in nature and is crossed out in the figure. Altogether then, if the age spread of the stars formed during the lifetime of a particular molecular cloud is determined observationally, the general relation allowing the determination of the parent molecular cloud lifetime is (see Fig. 2a):
Using equation (3), the observed values of , and the ambipolar-diffusion theory of star formation ( ), we find molecular cloud lifetimes to be consistent with molecular cloud age estimates based on cloud crossing times ( yr) 111This result does not depend on the duration of the late stages of star formation, ..
The interpretation of observations of age spreads according to the proponents of the rapid star-formation scenario is shown in Figure 2b. In this case, the core formation phase is essentially non-existent, , so equation (3) gives and the molecular clouds are found to be young. However, such an interpretation cannot possibly be considered as observational support for the rapid star-formation scenario because the assumption of rapid star formation, , is already built in.
4. Statistics of Pre-Stellar Cores and the Timescale of Star Formation
Another technique for inferring the timescale of star formation has its origin in the following simple statistical argument: Since a core with an embedded point source (hydrostatic protostellar object) is preceded, in an evolutionary sense, by a starless core, then the ratio of the number of cores with embedded point sources and the number of starless cores should reflect the ratio of the duration of each phase; i.e.,
| (1) |
(Beichman et al. 1986). This method has been employed to estimate the evolutionary timescale of prestellar cores (Ward-Thompson et al. 1994; Jijina et al. 1999; Lee & Myers 1999; Jessop & Ward-Thompson 2000).
Lee & Myers (1999) presented an all-sky survey of optically selected cores and found an overall ratio of cores with embedded point sources and starless cores of about 0.3. Using values for the evolutionary timescale of the embedded point-source phase between yr (Class 0 and Class I objects), they concluded that the duration of the starless core phase is about years. Based on a survey of NH3 cores, Jijina et al. (1999) found a similar result. In both cases, the authors concluded that the number of detected prestellar cores is too small to be consistent with ambipolar-diffusion–initiated star formation predictions.
Ward-Thomson et al. (1994) and Jessop & Ward-Thompson (2000) used 100 and 60 all sky surveys and found a ratio of cores with embedded point sources and starless cores. From this result, using a value years (including in this phase Class 0, Class I, and Class II objects), they found years and concluded that this value is consistent with the ambipolar-diffusion theory of the starless core phase.
Caution should be exercised when using the results obtained in the way described above. Observationally, only the ratio of and can be determined. A specific estimate for either one of the two timescales requires a theoretical value for the other. Any theoretical uncertainty in the assumed timescale is carried over to the estimated one. However, even if one accepts the value for as derived from an assumed , one should be very careful in comparing it with ambipolar-diffusion–induced core formation and evolution timescales. First, typical starless cores spend an appreciable fraction of phase A in Figure 1 having column-density contrasts with the parent cloud too low to be identified as “cores”. Second, the actual duration of the starless core phase is not a universal number in the ambipolar-diffusion theory. It depends on the mass-to-flux ratio () of the parent molecular cloud (Fiedler & Mouschovias, 1993; Ciolek & Basu, 2001).

To demonstrate the first point, we plot in Figure 3 the column density of a model ambipolar-diffusion–controlled “core”, in units of the background column density of the parent cloud, as a function of time. The solid line represents the value of the average column density of the oblate fragment when observed face-on out to a radius where a magnetically supercritical core eventually forms. The dot-dashed line corresponds to the value of the central column density of the core.
In all the observational work reviewed above, a density contrast of at least a factor 2 - 4 is required in order to identify an object as a “core”. As seen clearly in Figure 3, the model cloud requires years before it reaches a column-density contrast of 2 with respect to the background (parent cloud), during which time it would not be identified as a core in observational surveys. A density contrast of a factor of 3 is not developed until after about years. Hence, observational surveys miss a large part of the evolutionary phase preceding the formation of a supercritical core, and the actual duration of phase A is therefore severely underestimated; i.e., the fraction of phase A observable by these surveys is only a small fraction of the entire duration of phase A ( of Fig. 1).
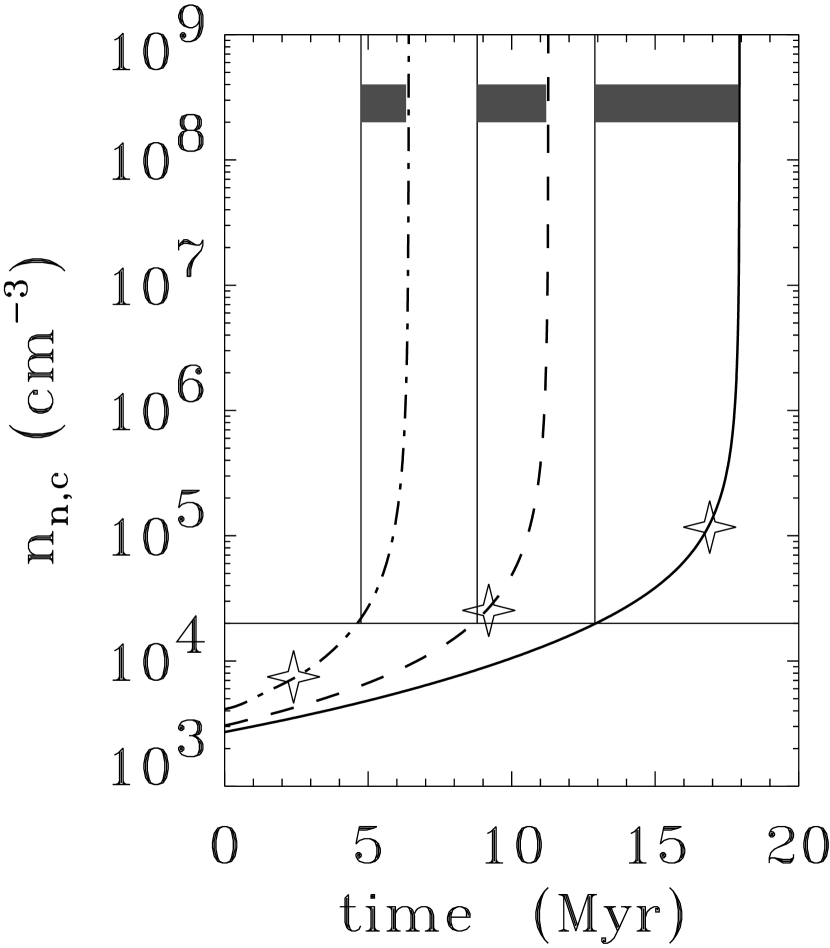
The model cloud of Figure 3 is characterized by a relatively small initial mass-to-flux ratio [ 0.25]. To demonstrate the dependence of the duration of phase A on , we plot in Figure 4 the time evolution of the central number density of the core for three different values of (see, also, Fiedler & Mouschovias 1993, Fig. 9a). The horizontal solid line corresponds to the minimum central density of a well-defined ammonia core (). The shaded bands represent the duration of the observable (using ammonia cores) part of phase A. For the most subcritical cloud (, solid line), Myr, while it is only Myr for the case (dashed line), and Myr for the case (dot-dashed line). Thus the lifetime of the observable “starless core” predicted by the ambipolar-diffusion theory depends on the value of the mass-to-flux ratio of the parent molecular cloud, and can be Myr, in complete agreement with observations. The closer to the critical value the mass-to-flux ratio is, the smaller the observable starless-core lifetime, with a lower limit being the magnetically diluted free-fall timescale.
5. Conclusions
We have re-examined the observational estimates of the lifetimes of molecular clouds and the timescale of star formation (based on ages of T-Tauri stars, age spreads of stars in clusters, and statistics of pre-stellar cores). All available measurements or estimates of the duration of different phases of the star formation process and of molecular-cloud lifetimes are completely consistent with the theoretical predictions of the ambipolar-diffusion–controlled fragmentation of molecular clouds and evolution of the protostellar fragments.
Observations of ages of T-Tauri stars only measure the duration of the late stages of star formation (after the formation of a hydrostatic core) and offer no information on the earlier stages, which can be (and, according to the ambipolar-diffusion theory, typically are) of much longer duration. These observations are consistent with molecular-cloud lifetimes Myr.
Observations of age spreads of stars in clusters can only be used to derive molecular-cloud lifetimes under some assumption concerning the core formation timescale (see Eq. [3]). In the ambipolar-diffusion–induced star formation theory, is the ambipolar-diffusion timescale, and observations suggesting are consistent with molecular-cloud lifetimes of .
In a typical molecular cloud, ambipolar diffusion requires to produce a core with a factor of 2 density contrast with respect to the parent cloud. It is only after this time that the object can be identified as a core in observational surveys. The remaining, observable lifetime of a “starless core” is only a few Myr, a value consistent with observations measuring the ratio of starless-core and embedded-point–source lifetimes. The observable lifetime of a starless core depends, according to the ambipolar-diffusion theory, on the initial mass-to-flux ratio of the parent cloud. The closer to critical this ratio is, the shorter the observable “starless core” lifetime (which can be for nearly-critical clouds).
Altogether, there is no observational evidence suggesting that molecular clouds are younger than their sound-crossing times. Therefore, “rapid” star formation is not an “observational requirement”, all statements to the contrary notwithstanding.
References
- Ballesteros-Paredes et al. (1999) Ballesteros-Paredes, J., Hartmann, L., & Vazquez-Semadeni, E. 1999, ApJ, 527, 285
- (2) Baume, G., Vázquez, R. A., Carraro, G., & Feinstein, A. 2003, A&A, 402, 549
- Beichman et al. (1986) Beichman, C. A., Myers, P. C., Emerson, P. J., Harris, S., Mathieu, R., Benson, P. J., & Jennings, R. E. 1986, ApJ, 307, 337
- Ciolek & Basu (2001) Ciolek, G. E. & Basu, S. 2001, ApJ, 547, 272
- Cohen & Kuhi (1979) Cohen, M. & Kuhi, L. V. 1979, ApJS, 41, 743
- Elmegreen (2000) Elmegreen, B. G. 2000, ApJ, 530, 277
- Fiedler & Mouschovias (1993) Fieldel, R. A. & Mouschovias, T. Ch. 1993, ApJ, 415, 680
- (8) Forbes, D. 1996, AJ, 112, 1073
- Gomez et al. (1992) Gomez, M., Jones, B. F., Hartmann, L., Kenyon, S. J., Stauffer, J. R., Hewett, R., & Reid, I. N. 1992, ApJ, 104, 762
- Hartmann et al. (1991) Hartmann, L., Jones, B. F., Stauffer, J. R., & Kenyon, S. J. 1991, ApJ, 101, 1050
- Hartmann (2001) Hartmann, L. 2001, ApJ, 121, 1030
- Hartmann et al. (2001) Hartmann, L., Ballesteros-Paredes, J., & Bergin, E. A. 2001, ApJ, 562, 852
- Herbig (1978) Herbig, G. H. 1978, Problems of Physics and Evolution of the Universe (Academy of Science of the Armenian SSR, Yerevan), 171
- Herbig et al. (1986) Herbig, G. H., Vrba, F. J., & Rydgren, A. E. 1986, AJ, 91, 575
- (15) Herbst, W. & Miller, D. P. 1982, ApJ, 87, 1478
- Jessop & Ward-Thompson (2000) Jessop, N. E. & Ward-Thompson, D. 2000, MNRAS, 311, 63
- (17) Jijina, J., Myers, P. C., & Adams, F. C. 1999, ApJS, 125, 161
- Lee & Myers (1999) Lee, C. W. & Myers, P. C. 1999, ApJS, 123, 233
- (19) Mouschovias, T. Ch. 1987, in Physical Processes in Interstellar Clouds, ed. G. E. Morfill & M. Scholer (Dordrecht: Reidel), 453
- Mouschovias (1996) Mouschovias, T. Ch. 1996, in Solar and Astrophysical Magnetohydrodynamic Flows, ed. K. Tsiganos (Dordrecht: Kluwer), 505
- Palla & Stahler (2000) Palla, F. & Stahler, S. W. 1965, ApJ, 540, 255
- Simon et al. (2001) Simon, M., Dutrey, A., & Guilloteau, S. 2001, ApJ, 545, 1034
- (23) Sung, H., Bessell, M. S., & Lee, S.-W. 1998, AJ, 115, 734
- Ward-Thompson et al. (1994) Ward-Thomson, D., Scott, P. F., Hills, R. E., & André, P. 1994, MNRAS, 268, 276
- Wood et al. (1994) Wood, D. O. S., Myers, P. C., & Daugherty, D. A. 1994, ApJS, 95, 457
- White et al. (1999) White, R. J., Ghez, A. M., Reid, I. N., & Schultz, G. 1999, ApJ, 520, 811