The small Blue Straggler star population in the dense Galactic Globular Cluster NGC 6752 111Based on observations with the NASA/ESA HST, obtained at the Space Telescope Science Institute, which is operated by AURA, Inc., under NASA contract NAS5-26555. Also based on WFI observations collected at the European Southern Observatory, La Silla, Chile, within the observing programme 62.L-0354 and 64.L-0439.
Abstract
We have used high resolution WFPC2-HST and wide field ground-based observations to construct a catalog of blue straggler stars (BSS) which spans the entire radial extent of the globular cluster NGC 6752. The BSS sample is the most extensive ever obtained for this cluster. Though NGC 6752 is a high density cluster with a large binary population, we found that its BSS content is surprisingly low: the specific number of BSS is among the lowest ever measured in a cluster. The BSS distribution is highly peaked in the cluster center, shows a rapid decrease at intermediate radii, and finally rises again at larger distances. This distribution closely resembles those observed in M3 and 47Tuc by Ferraro et al., (1993, 2004). To date, BSS surveys covering the central regions with HST and the outer regions with wide field CCD ground-based observations have been performed for only these three clusters. Despite the different dynamical properties, a bimodal radial distribution has been found in each. A detailed comparison of observed BSS luminosity and temperature distributions with theoretical models reveals a population of luminous, hot BSS which is not easily interpreted.
1 Introduction
Blue straggler stars (BSS) were first detected in the Galactic Globular Cluster (GGC) M3 (Sandage,, 1953) as a sparsely populated sequence extending to higher luminosity than the turnoff (TO) point of normal hydrogen–burning main sequence stars in the Color–Magnitude diagram (CMD). Therefore their position in the CMD suggests that they are massive stars still burning hydrogen in their core in an old star cluster. Since no other evidence of subsequent star formation episodes into the GGCs stellar populations can be found, one of the great challenges of the last 50 years was to understand the origin of BSS.
The first surveys for BSS, done with photographic plates, were limited to the outer parts of the clusters and no tendency for the BSS to concentrate toward the central regions was observed. The advent of telescopes of higher resolution and in particular the launch of the Hubble Space Telescope (HST) allowed the inspection of the cores of GGCs, revealing that BSS are more centrally concentrated than the normal stars, e.g., the subgiants, of the same luminosity. This suggests that these stars are generally more massive than the cluster subgiants, leading many authors to consider BSS as the offspring of binary systems. Two mechanisms for making BSS have been suggested: (i) mass transfer between or the merger of two stars in a primordial binary (where“primordial” refers to binaries created when the cluster formed) and (ii) collisions in regions of very high stellar density (Hills & Day,, 1976; Fusi Pecci et al.,, 1992; Ferraro et al.,, 1993; Ferraro Fusi Pecci & Bellazzini,, 1995; Bailyn,, 1995; Meylan & Heggie,, 1997). The class of collisional BSS can be further subdivided into those produced by direct collisions, those created as collisions harden primordial binaries until they merge, and those resulting when binaries are produced in a collision and merge later.
The study of BSS in stellar clusters provides new insights not only into dynamical interaction and evolution of individual stars, but also of the cluster as a whole. Indeed gravitational interactions between cluster stars force the GGCs to evolve dynamically on timescales generally smaller than their ages. The first evidence of dynamical processes within a GGC is the segregation toward the center of the more massive stars (or binaries) (see Bailyn,, 1995, and references therein, for a review). A star cluster can undergo other dynamic evolution: galactic tidal stripping continuously removes stars from the outer region of the cluster, and other stars are lost because their velocities are higher than the escape velocity of the cluster. As a consequence the cluster is forced to adjust its structure and the core must contract. In some cases this process can lead to a catastrophic collapse of the core. Binaries are thought to play a fundamental role in the core collapse—binary-binary collisions could be effective in delaying the collapse of the core, avoiding infinite central density. In this case, while the core tries to collapse, most of the binaries in the central regions will be destroyed by close encounters, and the survivors will become tightly bound, producing an overabundance of BSS (i.e. the case of M80, Ferraro et al., 1999b, ).
The GGC NGC 6752 is a very interesting target to study the role of dynamical effects on stellar evolution. The cluster hosts many faint X-ray sources in the core, which may be cataclysmic variables (Pooley et al.,, 2002). In addition there are at least five millisecond pulsars (MSPs), two of which are in the outer part of the cluster. These two are the most radially distant MSPs gravitationally bound to a GC. Moreover, two of the three central MSPs display an anomalous acceleration (D’Amico et al.,, 2002), which suggests a very high cluster central mass-to-light ratio (Colpi Possenti & Gualandris,, 2002). Ferraro et al., 2003a showed that NGC 6752 is a dynamically evolved cluster, probably undergoing a post-core-collapse bounce. They investigated scenarios for simultaneously explaining both anomalous acceleration of the inner MSPs and the ejection of the most external MSPs, concluding that the existence of a binary black hole of intermediate mass could be a viable possibility (see also Colpi Possenti & Gualandris,, 2002; Colpi Mapelli & Possenti,, 2003).
Since BSS are excellent tools to investigate the dynamical status of a cluster, in this paper we will focus our attention on this population. As done in previous work (Ferraro et al.,, 1993, 1997, 2004), we have combined high resolution HST data with wide field images in order to study the behavior of populations over the entire cluster extent. The data are presented in §2, while in §3 the BSS candidates and the criteria of selection are shown. The radial distribution of the BSS is presented in §4, while we have compared our results with those of other clusters (§5). The results of the collisional models are shown in §6. These results are discussed in §7.
2 Observations and data analysis
To search for BSS in NGC 6752 we have used two data sets:
(i) High resolution set— a series of high-resolution WFPC2-HST images were obtained on March 2001, using the F555W (), F336W () and F255W () filters as part of a long term project (GO-8709, PI: F. R. Ferraro) aimed at studying the central stellar populations in a set of GGCs. In this data set the planetary camera (PC, which has the highest resolution ) was roughly centered on the cluster center while the Wide Field (WF) cameras (at lower resolution ) sampled the surrounding outer regions;
(ii) Wide Field set— a complementary set of multi-filter (, , ) wide field images was secured during an observing run at the 2.2m ESO-MPI telescope at ESO (La Silla) in July 1999, using the Wide Field Imager (WFI). The WFI is a mosaic of 8 CCD chips (each with a field of view of ) giving a global field of view of . The cluster was roughly centered on chip (see Figure 1).
Standard IRAF222IRAF is distributed by the National Optical Astronomy Observatory, which is operated by the Association of Universities for Research in Astronomy, Inc., under cooperative agreement with the National Science Foundation. tools were used to correct the raw WFI images for bias and flat field and for trimming the over-scan region. The photometric reduction of the images has been performed with the DAOPHOT package in the IRAF environment, applying the point spread function (PSF) fitting procedure independently on each and images. For each chip the objects found in both bands were cross-identified with a package developed at the Bologna Observatory (Montegriffo et al. 2004, in preparation). After this match a catalog listing the instrumental magnitudes for all the stars in each field has been obtained. The WFI catalog was finally calibrated by using the data set of Buonanno et al., (1986).
The photometric reductions of the high resolution images were carried out using ROMAFOT (Buonanno et al.,, 1983), a package developed to perform accurate photometry in crowded fields and specifically optimized to handle under-sampled PSFs (Buonanno & Iannicola,, 1989) as in the case of the HST-WF chips.
PSF-fitting instrumental magnitudes have been obtained using the standard procedure described in Ferraro et al., (1997, 2001). The final catalog of the F555W, F336W and F255W magnitudes was calibrated by using the zero-points listed by Holtzmann et al., (1995).
The Guide Star Catalog () was used to search for astrometric standards in the entire WFI image field of view. The procedure used to obtain the astrometric solution of the 8 WFI chips is completely described in Ferraro et al., 2003a .
Since the small field ( on the side) of the high resolution WFPC2/HST images was entirely contained within the field of view of the WFI chip (see Figure 1), we used more than 1200 bright stars in the WFI catalog lying in the WFPC2-FoV as secondary astrometric standards in order to properly find an astrometric solution for the WFPC2 catalog. The estimated global uncertainties in the astrometric procedure are less than both in RA and Dec. This procedure allowed us to obtain two catalogs (WFPC2 and WFI) which are fully homogeneous in the absolute coordinate system.
Results from the analysis of the F555W and F336W catalog were presented in a previous paper (Ferraro et al., 2003a, ). Here, since our goal is the identification and the analysis of the BSS population, we will focus on the (, ) plane.
3 The CMD and the BSS candidates
3.1 The HST data
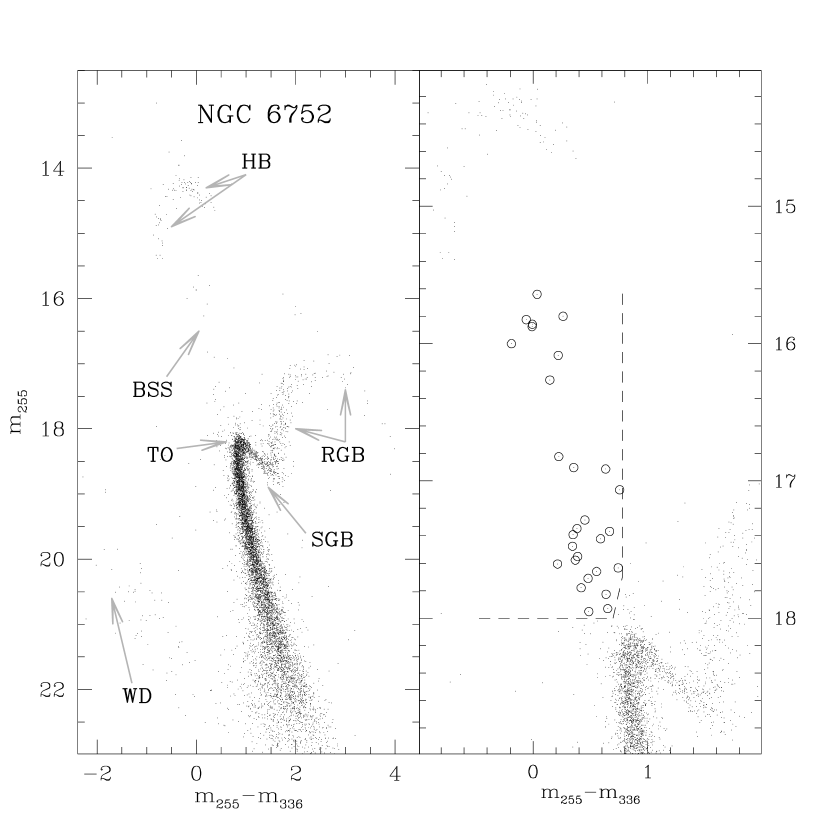
Many studies (Dorman Rood & O’Connell,, 1995, and references therein) have shown that the main contributors to the UV emission of GCs are the hot stars which populate the horizontal branch (HB) and the BSS (see for example Figure 1 by Ferraro et al., 1999a, ). In UV planes the main branches display very different morphology from the usual optical CMD (i.e. ). Figure 2 shows the UV-CMD of NGC 6752 in the (, ) plane for more than 11,000 stars identified in the HST field of view. As can be seen, the red giant branch (RGB) is very faint, while the horizontal branch (HB), excluding the hottest section, which bends downward because of the increasing bolometric correction, appears diagonal. Since red giants are faint in UV, the photometric blends, which mimic BSS in visible CMDs, are less problematic. Thus, a complete BSS sample can be obtained even in the densest cores. Indeed, the (, ) plane is an ideal tool for selecting BSS (Ferraro et al.,, 1997; Ferraro et al., 1999a, ; Ferraro et al.,, 2004).
The BSS candidates occupy a narrow, nearly vertical, sequence spanning mag in . Two limits (one in color, and one in magnitude) have been assumed to properly select the BSS sample in the UV-CMD shown in Figure 2. The BSS sequence blends smoothly into the main sequence (MS) near the cluster TO. To select only ‘safe’ BSS, we have chosen only stars brighter than (0.3 mag brighter than the cluster TO). This limiting magnitude is consistent with that used in our other BSS catalogs (Ferraro et al.,, 1997, 2004) so as to allow easy comparison. To exclude spurious detections due to blended sources, we have chosen only objects bluer than . In addition we have excluded two objects which satisfy these criteria but which lie near the boundary of the region and are in regions of severe crowding.
Following these criteria we have identified 28 BSS in the HST-WFPC2 FoV (hereafter HST sample). The BSS candidates are listed in Table 1: the first two columns list the identification numbers, while columns (3)–(5) report the , and magnitudes respectively. In columns (6) and (7) we report the astrometric coordinates (Right Ascension and Declination).
3.2 The WFI data
In order to avoid spurious effects due to incompleteness of the ground based observations in the crowded central region of the cluster, we restricted the WFI sample to stars with from the center of gravity () given in Ferraro et al., 2003a (see Figure 1). Since the outer regions of the WFI FoV are dominated by field stars, in this paper we consider as cluster members only stars contained within the tidal radius () derived from the radial density profile by Ferraro et al., 2003a .
BSS in the WFI sample have been selected from the () CMD using the selection box shown in Figure 3—left panel. The sample includes only stars brighter than , and bluer than . There are only 15 BSS candidates. No stars are found in this region of the CMD for (see Figure 3—right panel) suggesting that field contamination should not significantly affect the selected BSS sample.
The BSS candidates detected in the WFI-FoV are listed in Table 2. As in Table 1 the first two columns list the identification numbers, and magnitudes are reported in columns (3) and (4) respectively. The last two columns ((5) and (6)) list the astrometric coordinates.
4 BSS radial distribution
In order to study the BSS radial distribution in NGC 6752 over the entire cluster extension, we must combine the two samples (HST WFI). This requires that the two BSS samples have the same limiting magnitude. To do this we can use the band which is in common to the two data sets (since the F555W-WFPC2 filter is approximately a filter). Figure 4 shows the two CMDs in the (, ), and in the (, ) planes for the HST and WFI samples respectively. As can be seen the faint threshold for the ground based BSS sample roughly corresponds to . For the most part in the following, we consider only the HST-BSS brighter than this limit (19 BSS from BSS-HST-1 to BSS-HST-19 in Table 1). Note that only 18 HST-BSS are plotted in Figure 4, because the bright BSS-HST-3 was not measured in the F555W filter since it lies near a bright red star which seriously affects its magnitude. (However BSS-HST-3 is quite bright in the UV and it certanly has . Note that the same happen to BSS-HST-22 which is significantly fainter than BSS-HST-3 and by comparing HST-BSS-22 with stars of similar UV properties and measurable , we estimate that it lies just on the faint side of the boundary, and we eliminate it from our sample). The final selection yeld a total catalog of 34 BSS (19 from HST and 15 from the WFIsample)
Fig. 4 illustrates another important point—the danger of using optical CMDs to identify BSS in crowded regions. Even using HST, in dense GGC cores the BSS region can be populated by spurious objects due to blending of SGB, RGB and HB stars. This is quite clearly shown by the comparison of Fig. 2 and the left panel of Fig. 4. In Fig. 4 there are many objects lying in the region of the BSS which are not circled. Only the BSS selected in the UV diagram are circled and genuine. All of the other objects (indeed the majority of objects fainter than ) are blends.
To study the BSS radial distribution we must describe the BSS relative to some reference stellar populations. Here we use as “reference” both HB and RGB stars. We decided to use both populations since the HB is clearly defined and it has been used in previous papers (see Ferraro et al., 2003b, ); on the other hand the RGB, including the lower RGB, is much more populous than HB, hence star counts are less affected by statistical fluctuations. In the HST catalog the RGB stars have been selected in the (, plane–see Figure 4) to reduce any bias which might be introduced by the poor photometry for the redder stars in the UV bands. In matching the two samples the lower boundary of the selection box is most important, and Figure 4 shows that it is well matched in the two samples. The selection in colors is somewhat arbitrary, but in both the cases the selections include the bulk of the RGB population. A few stars were excluded; they could be either poorly measured stars and/or field stars, especially in the WFI sample. The fact that RGB radial distribution is the same as the HB distribution (see below) suggests that there is no significative bias between the two samples in our selection.
The resulting comparison population samples are 87 HB and 255 RGB in HST and 264 HB and 1984 RGB in WFI respectively.
In Figure 5 we have plotted the cumulative radial distributions both for the BSS and reference populations for the HST (—left panel) and for the WFI (—right panel) samples. The radial distributions were computed by adopting the cluster recently determined by Ferraro et al., 2003a . In central regions we show both the full 28 star HST BSS distribution (short-dashed line) and the 19 star truncated BSS-distribution ( — solid line). These two distributions are essentially identical. A Kolmogorov-Smirnov (K-S) test shows that the two samples could have been drawn from the same distribution % of the time. This shows that the exact value of the limiting magnitude chosen does not affect our results. Both the full and truncated HST samples are more concentrated than the RGB (dashed line) and the HB (dot-dash line) stars selected in the same area. K-S tests yield probabilities of % and % that the truncated-BSS sample in the central region of NGC 6752 has a different radial distribution with respect to the reference HB and RGB population respectively. As noted earlier (see Figure 1) the shape of WFPC2 prevents us from fully sampling the smallest annuli. In the region between and we sample only 40% of the total area including a 23″ wide transition area between the HST and WFI data which we do not sample at all. Because the number of BSS stars is small (8 between and ) the counting errors can be large, and if the numbers are corrected for undersampling these errors are magnified. However, our conclusions are drawn from a comparison with a reference population, and both the HB and RGB reference populations are drawn from exactly the same areas as the BSS. Such comparisons are not affected by the under/un-sampled annuli.
On the other hand, in the outer sample (right panel) the radial distribution of the BSS is not statistically different (less than 1) from those of either the RGB or HB. We note that this effect could be also due to the fact that the number of BSS is too small to draw a definite conclusion.
In two previously surveyed clusters (M3 and 47 Tucanae) we have shown that the BSS are more concentrated than the reference population in the central regions. The reverse is true in the outer regions with the BSS being less concentrated than the reference population. The situation is less well defined in NGC 6752. The comparison of the radial distribution shown in Figure 5 clearly demonstrates (left-panel) that BSS are much more concentrated toward the center with respect to the normal cluster stars. The small sample in the outer region (Figure 5-right panel) shows no evidence that the BSS are less concentrated than the reference populations, but an effect like that in M3 and 47 Tuc could well not show up in a sample of this size.
In order to further investigate the distribution of BSS, we computed the radial behavior of the BSS relative frequency , where and is the number of BSS and HB stars respectively. In doing this we have subdivided the surveyed area into a set of concentric annuli (each containing roughly % of the reference populations), and we have counted the number of BSS and HB stars contained in each annulus. The relative frequency as function of distance is shown in Figure 6—upper panel. The distribution shows a bimodal trend—it reaches the maximum in the innermost annulus () and quickly decreases to less then 0.04 as increases. Nevertheless, in the most external annuli the distribution shows a small upturn reaching . Errors in the relative frequency of BSS with the respect of HB, here written as (where indicate the BSS and the HB numbers respectively) are
In order to decrease the statistical fluctuation in the distribution due to the small numbers, and to show that the observed bimodality is not introduced by an anomalous HB star distribution, we also have normalized the BSS number to the RGB population selected as shown in Figure 4. The result is shown in Figure 6—lower panel (errors were derived adopting the same formula of the previous case). As can be seen the bimodal behaviour of the BSS frequency is fully confirmed independent of the reference population. This result (though of lower significance) closely follows the bimodality observed in M3, M55 and recently in 47 Tuc, thus increasing the number of clusters showing this peculiar radial behaviour. Extensive surveys in the outer region of other clusters (as M80, M5, etc.) are needed before we can conclude that this is the “natural” radial distribution of BSS in globulars.
5 Comparison with other GCs
In a recent paper Ferraro et al., 2003b have compared the BSS populations in the central region of 6 GGCs with different central density and metallicity. Here we compare the BSS population detected in the HST FoV for NGC 6752 with those presented by Ferraro et al. for the other clusters. We also include 47 Tuc (Ferraro et al.,, 2004) in the discussion with the caveat that it was observed in a different photometric plane which might introduce some additional uncertainty.
To do this we have applied the same criteria adopted by Ferraro et al.: the HST-CMD of NGC 6752 was shifted in magnitude and color to match the MS of M3 (see Figure 7). In this comparison only bright BSS (bBSS) with magnitude brighter than 19.0 are considered. This selection reduced our sample to 16 stars. (Note that the faint and bright subsamples show radial distributions which are almost identical, suggesting that our BSS sample is not significantly contaminated with MS stars.)
In Table 3 we compare some of the properties of the previously observed clusters and their BSS with NGC 6752. We give central density, , cluster mass, central velocity dispersion, and , from Pryor & Meylan, (1993). as defined above is determined for the entire HST sample and is not the central value.
In the case of NGC 6752 the ratio is equal to 0.18, one of the lowest ever derived for a cluster. Of the the six clusters analyzed by Ferraro et al., 2003b , only M13 has a lower value.
An other useful parameter to compare the BSS population in GGCs is the radius containing half the BSS sample (). For NGC 6752 . If fit by one single mass King Model the core radius of NGC 6752 is (Ferraro et al., 2003a, ) and the ratio . This is the largest value ever measured for this ratio (Ferraro et al., 2003b, ). However Ferraro et al. (2003b) noted that one King model did not fit the NGC 6752 profile well. A much better fit was achieved using two single mass King models, one to fit the core, the other to the external region. This unusual profile suggests an unusual dynamical state, perhaps a core bounce. Could this be related to the large value of ? Indeed if one uses the larger of the double fit core radii (, see Table 3) the ratio turns out to be , fully comparable to the other clusters.
6 Collisional Models
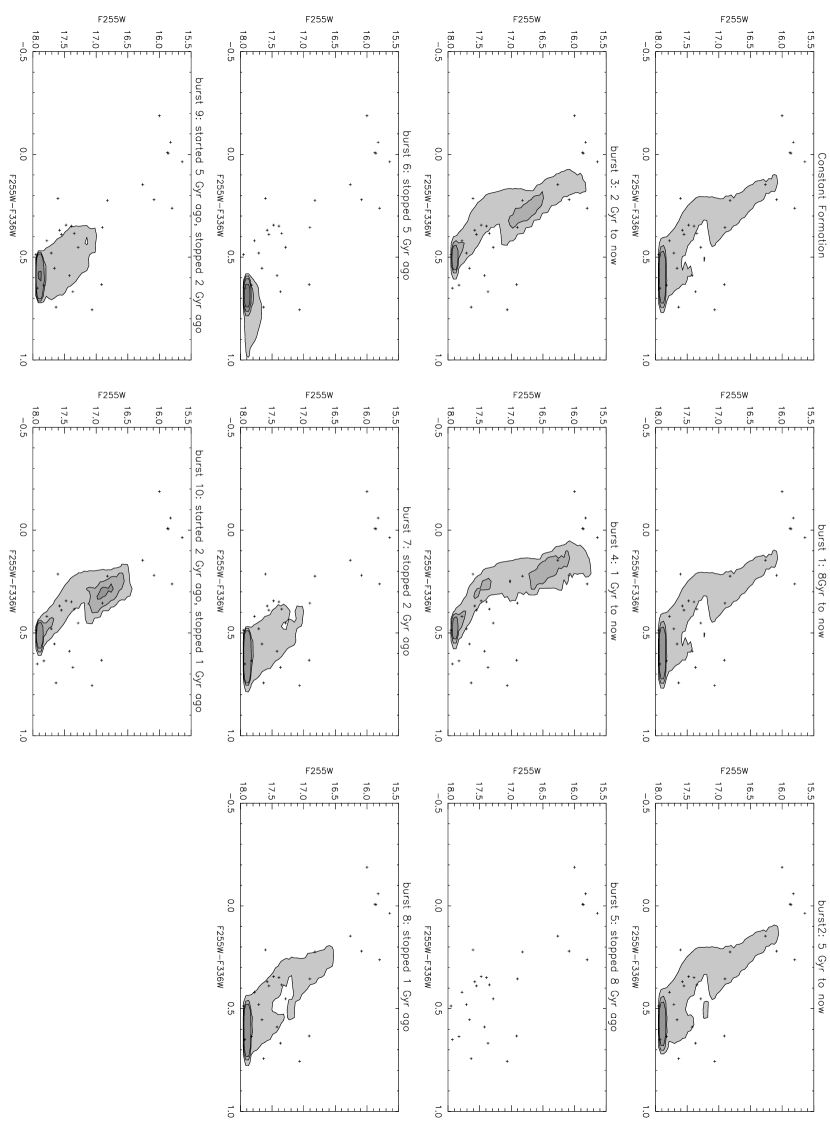
We have compared the observed BSS population in NGC 6752 with models of BSS populations. The models used here are described in detail in Sills & Bailyn, (1999) and have been applied to 47 Tuc (Sills et al.,, 2000) and six other clusters (M3, M10, M13, M80, M92 and NGC 288) (Ferraro et al., 2003b, ). We assume that all the BSS were formed via direct stellar collisions between two stars during an encounter between a single star and a binary system. The trajectories of the stars during the collision are modeled using the STARLAB software package (McMillan & Hut,, 1996). The masses of the stars involved are chosen randomly from a mass function for the current cluster and a different mass function which governs the mass distribution within the binary system. A binary fraction, and a distribution of semi-major axes must also be assumed. The output of these simulations is the probability that a collision between stars of specific masses will occur. We have chosen standard values for the mass functions and binary distribution. The current mass function has an index , and the mass distribution within the binary systems are drawn from a Salpeter mass function (). We chose a binary fraction of 20% and a binary period distribution which is flat in . The total stellar density was taken from the central density of each cluster. The effect of changing these values is explored in Sills & Bailyn, (1999). The collision products are modeled by entropy ordering of gas from colliding stars (Sills & Lombardi,, 1997) and evolved from these initial conditions using the Yale stellar evolution code YREC (Guenther et al.,, 1992). The models reported here used a metallicity of (Harris,, 1996). By weighting the resulting evolutionary tracks by the probability that the specific collision will occur, we obtain a predicted distribution of BSS In order to explore the effects of non-constant BSS formation rates, we examined a series of truncated rates. In these models we assumed that the BSS formation rate was constant for some portion of the cluster lifetime, and zero otherwise. This assumption is obviously unphysical—the relevant encounter rates would presumably change smoothly on timescales comparable to the relaxation time. However these models do demonstrate how the distribution of BSS in the CMD depend on when the BSS were created, and thus provide a basis for understanding more complicated and realistic formation rates.
We fit the models to the two sub-samples independently. The theoretical evolutionary tracks were transformed to the () plane or the () plane and compared to the data using a KS test in both luminosity and temperature. The resultant distributions, including a variety of possible formation times, are shown in Figures 8 and 9.
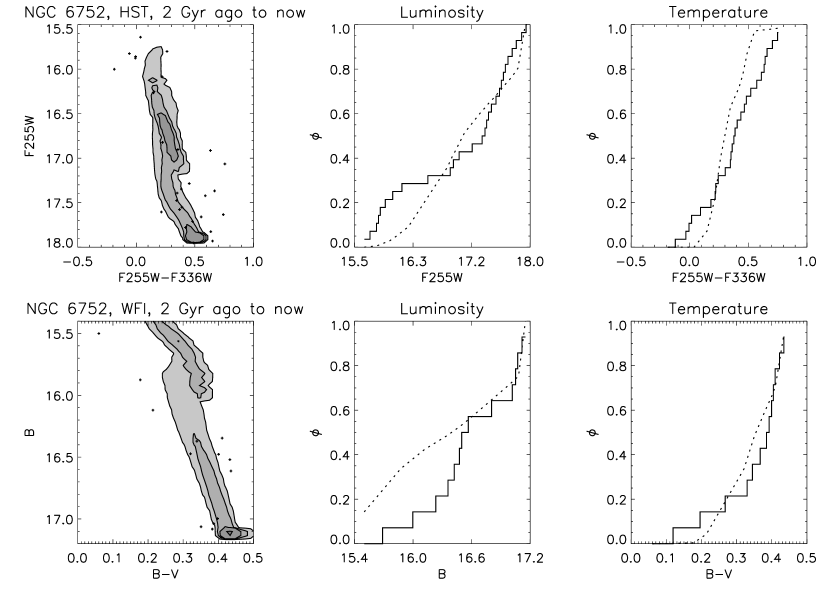
Given the sample size we must be careful not to overinterpret these comparisons. There are several points of note: for the HST sample, none of our models produce a significant population of the very bright, very blue BSS which we observe. In the data there is a paucity of stars in the range —the models tend to populate that region as abundantly as the adjacent regions. Models which produce BSS over a substantial part of the cluster’s age predict too many faint BSS. Indeed, as shown in Figure 10, the “best fit” model as determined by KS tests on the luminosity function and analogous temperature function is one in which all the BSS were formed in the past two Gyr. The solid lines in Figure 10 show the cumulative luminosity or temperature function of the data, and the dotted lines give the theoretical predictions.
The ground-based data set is also best fit by a model in which all the BSS were formed in the last 2 Gyr. However, it is also plagued by similar problems in the details. While in this case we actually over-predict the number of bright BSS, our models are much too red to actually fit the distribution well.
In both the inner and outer regions of the cluster, the biggest problem with our collisional models is their inability to predict enough bright BSS compared to the fainter BSS. In addition the luminous BSS are too blue. In one respect NGC 6752 is very much unlike the 7 previous clusters to which we have applied this technique. It is best fit by a model where BSS formation started 2 Gyr ago. All previously studied clusters, with the exception of the low density cluster NGC 288, were best fit by models in which the BSS stopped forming 1 to 2 Gyr ago. M3 and M92 have BSS even more luminous than those in NGC 6752. 47 Tuc also appears to have BSS more luminous than those in NGC 6752 but this is less certain because of the different photometric systems. A few BSS in M80 are as luminous as those in NGC 6752, but they make up a much smaller fraction of the BSS population. In M3, M92, & M80, the BSS are not as hot as in NGC 6752 and in that respect do not present a challenge to the models. We can achieve much better formal fits to the BSS magnitude distributions in M3, M80, and M92 because much of the weight of those fits comes from the less luminous BSS. The best fitting models do not include the bright BSS present in the observations.
We must question our assumptions about the formation mechanism for the most luminous BSS, in general. In the case of NGC 6752 we must also address the issue of why these stars are so hot. It is possible that these BSS are not the product of two stars colliding, but could actually be the product of three stars coming together. This has been suggested for the brightest blue straggler in NGC 6397, based on STIS spectra which suggest a mass greater than twice the TO mass for that particular star (Shara,, 2002). Alternatively, the BSS could be chemically very different from our assumptions. Based on SPH simulations of collisions between MS stars and the subsequent evolution of non-rotating collision products (Sills et al.,, 1997, 2002), we produce BSS evolutionary tracks which have no mixing of hydrogen to the core or helium to the surface. These evolutionary tracks have truncated MS lifetimes, particularly for the more massive BSS, and spend much of their time in the redder part of the CMD. However, if there is some mixing mechanism present, such as stellar rotation (Sills et al.,, 2001), then the stars can be significantly bluer, brighter, and have longer MS lifetimes. Finally, it is possible that the BSS were not formed through collisions at all, but rather through the merger of the two components of a primordial binary system. There are currently very few detailed models of a merger between two MS stars in a binary system that could be used as starting models for stellar evolution calculations, so we have very little information about the evolutionary tracks of such a blue straggler. There are arguments (e.g Bailyn & Pinsonneault,, 1995) which suggest that a binary merger should involve more mixing of helium to the surface, producing a bluer BSS.
7 Summary and Discussion
We have surveyed the entire radial extension of NGC 6752 for BSS using HST UV photometry in the center and ground based ESO-WFI photometry in the outer parts. Our sample should be relatively complete and devoid of blends which mimic BSS. The relative frequency of BSS compared to either HB or RGB stars has a radial distribution which is bimodal, peaking in the center and rising up in the outer regions of the cluster. Only two other clusters, M3 & 47 Tuc, have surveys of similar quality, and they both have bimodal distributions. Clearly bimodal distributions are likely to be a fairly common feature of cluster BSS populations. More BSS surveys, covering the full spatial extent of the host cluster, are necessary to determine just how common bimodality is.
When compared to other clusters the specific frequency of BSS in the central regions of NGC 6752 is found to be quite low. The current binary fraction in the core of NGC 6752 was measured to be large (between 16 and 38%) by Rubenstein & Bailyn (1997), and then dropping to less than 15% outside one core radius. As noted in the introduction, there are many other indications of a substantial binary population: CVs, MSPs, X-ray sources. Moreover NGC 6752 has a high central density. A large binary population and high stellar density should lead to efficient production of BSS, yet we observe the reverse.
We have argued that a cluster’s dynamic state might be important. For example, M80 has very large BSS population and maybe at the onset of core contraction (Ferraro et al., 1999b, ). However our own models of M80 suggest that the BSS population may not be linked to core contraction. The models suggest that BSS formation ended a few Gyr ago—too long ago to have the BSS formation tightly linked to core collapse, especially if the core collapse is happening now. Elsewhere, we have argued (Ferraro et al., 2003b, ) that the core of NGC 6752 is undergoing a post-collapse bounce, i.e., is in a more advanced dynamical state than M80. Maybe the grand epoch for BSS in NGC 6752 was long in the past? Our modeling indicates otherwise—the large number of luminous BSS compared to fainter ones suggests recent BSS formation.
The relatively large number of luminous and hot BSS in the cluster core casts some doubt on our model formation mechanism. A formation mechanism which occurs favorably in an environment with many binary stars could work better in the core of this cluster. Both the triple collision model and the binary merger model should be considered in more detail for the HST observations of BSS in NGC 6752. The ground-based data, on the other hand, may simply be better fit by more realistic models of BSS (perhaps involving some rotation).
References
- Bailyn, (1995) Bailyn, C. D. 1995, ARA&A, 33, 133
- Bailyn & Pinsonneault, (1995) Bailyn, C. D. & Pinsonneault, M. H. 1995, ApJ, 439, 705
- Buonanno et al., (1983) Buonanno, R., Buscema, G., Corsi, C.E., Ferraro, I., & Iannicola, G. 1983, A&A, 126, 278
- Buonanno et al., (1986) Buonanno, R., Corsi, C. E., Iannicola, G., & Fusi Pecci, F. 1986, A&A, 159, 189
- Buonanno & Iannicola, (1989) Buonanno, R., & Iannicola, G. 1989, PASP, 101, 294
- Colpi Possenti & Gualandris, (2002) Colpi, M., Possenti, A., & Gualandris, A. 2002, ApJ, 570, L85
- Colpi Mapelli & Possenti, (2003) Copli, M., Mapelli, M., & Possenti, A 2003, ApJ, 599, 1260
- D’Amico et al., (2002) D’Amico, N., Possenti, A., Fici, L., Manchester, R. N., Lyne, A. G., Camilo, F., & Sarkissian, J. 2002, ApJ, 570, L89
- Dorman Rood & O’Connell, (1995) Dorman, B., Rood, R. T., O’Connell, R. 1995, ApJ, 442, 105
- Ferraro et al., (1993) Ferraro, F. R., Fusi Pecci, F., Cacciari, C., Corsi, C., Buonanno, R., Fahlman, G. G., & Richer, H. B. 1993, AJ, 106, 2324
- Ferraro Fusi Pecci & Bellazzini, (1995) Ferraro, F. F, Fusi Pecci, F., & Bellazzini, M. 1995 A&A, 294, 80
- Ferraro et al., (1997) Ferraro, F.R., Paltrinieri, B., Fusi Pecci, F., Cacciari, C., Dorman, B., Rood, R.T., Buonanno, R., Corsi, C.E., Burgarella, D., Laget, M. 1997, A&A, 324, 915.
- (13) Ferraro, F. R., Paltrinieri, B., & Cacciari, C. 1999a Mem SAIt, 70, 599
- (14) Ferraro, F. R., Paltrinieri, B., Rood, R. T., & Dorman, B. 1999b, ApJ, 522, 983
- Ferraro et al., (2001) Ferraro, F.R., D’Amico, N., Possenti, A., Mignani, R., & Paltrinieri, B. 2001, ApJ, 561, 337
- (16) Ferraro, F. R., Possenti, A., Sabbi, E., Lagani, P., Rood, R. T., D’Amico, N., & Origlia, L 2003a, ApJ, 595, 464
- (17) Ferraro, F. R., Sills, A., Rood, R. T., Paltrinieri, & B., Buonanno, R. 2003b, ApJ, 588, 464
- Ferraro et al., (2004) Ferraro, F. R., Beccari, G., Rood, R. T., Bellazzini, M., Sills, A., Sabbi, E. 2004, ApJ, 603,127
- Fusi Pecci et al., (1992) Fusi Pecci, F., Ferraro, F. R., Corsi, C. E., Cacciari, C., & Buonanno, R. 1992, AJ, 104, 1831
- Guenther et al., (1992) Guenther, D. B., Demarque, P., Kim, Y. C., & Pinsonneault, M. H. 1992, ApJ, 387, 372
- Harris, (1996) Harris, W.E. 1996, AJ, 112, 1487
- Hills & Day, (1976) Hills, J. G., & Day, C. A. 1976 ApJ, 17, L87
- Holtzmann et al., (1995) Holtzmann, J. A., Burrows, C. J., Casertano, S., Hester, J. J., Trauger, J. T., Watson, A. M., & Worthey, G. 1995, PASP, 107, 1065
- McMillan & Hut, (1996) McMillan, S. L. W., & Hut, P. 1996, ApJ, 467, 348
- Meylan & Heggie, (1997) Meylan, G., & Heggie, D. G. 1997, A&A Rev., 8, 1
- Pryor & Meylan, (1993) Pryor, C., & Meylan, G. 1993, in ASP Conf. Ser. 50, Structure and Dynamics of Globular Clusters, ed. S. G. Djorgovski & G. Meylan (San Francisco: ASP), 357
- Pooley et al., (2002) Pooley, B., et al. 2002 ApJ, 569, 405
- Rubenstein & Bailyn (1997) Rubenstein, E. P. & Bailyn, C. D. 1997, ApJ, 474, 701
- Sandage, (1953) Sandage, A. R. 1953, AJ, 58, 61
- Sills & Lombardi, (1997) Sills, A., Lombardi, J. C. Jr. 1997, ApJ, 484, L51
- Sills et al., (1997) Sills, A., Lombardi, J. C., Bailyn, C. D., Demarque, P., Rasio, F. A., & Shapiro, S. L. 1997, ApJ, 487, 290
- Sills & Bailyn, (1999) Sills, A., Bailyn, C. D. 1999, ApJ, 513, 428
- Sills et al., (2000) Sills, A., Bailyn, C. D., Edmonds, P. D., Gilliland, R. L. 2000, ApJ, 535, 298
- Sills et al., (2001) Sills, A., Faber, J. A., Lombardi, J. C., Rasio, F. A., & Warren, A. R. 2001, ApJ, 548, 323
- Sills et al., (2002) Sills, A., Adams, T., Davies, M. B., & Bate, M. R. 2002, MNRAS, 332, 49
- Shara, (2002) Shara, M. M. 2002, ASP Conf. Ser. 263: Stellar Collisions, Mergers and their Consequences


| Name | Identification | m255 | m336 | m555 | Ra | Dec |
|---|---|---|---|---|---|---|
| BSS-HST 1 | 100547 | 15.64 | 15.61 | 15.28 | 287.7177960 | -59.9854470 |
| BSS-HST 2 | 302241 | 15.80 | 15.54 | 15.42 | 287.7669809 | -59.9854152 |
| BSS-HST 3∗ | 100544 | 15.83 | 15.88 | 0.00 | 287.7180070 | -59.9857744 |
| BSS-HST 4 | 100879 | 15.86 | 15.87 | 15.57 | 287.7168449 | -59.9846164 |
| BSS-HST 5 | 200439 | 15.88 | 15.88 | 15.77 | 287.7133298 | -59.9727028 |
| BSS-HST 6 | 101104 | 16.00 | 16.19 | 15.76 | 287.7226674 | -59.9790308 |
| BSS-HST 7 | 201881 | 16.09 | 15.87 | 15.59 | 287.7411119 | -59.9633487 |
| BSS-HST 8 | 102301 | 16.27 | 16.12 | 15.81 | 287.7142228 | -59.9783230 |
| BSS-HST 9 | 100145 | 16.82 | 16.60 | 16.23 | 287.7196979 | -59.9859308 |
| BSS-HST 10 | 400382 | 16.90 | 16.55 | 16.20 | 287.7293083 | -59.9826694 |
| BSS-HST 11 | 200769 | 16.91 | 16.28 | 15.96 | 287.7117728 | -59.9696571 |
| BSS-HST 12 | 101633 | 17.07 | 16.31 | 15.99 | 287.7148306 | -59.9829903 |
| BSS-HST 13 | 400196 | 17.29 | 16.83 | 16.56 | 287.7546718 | -59.9891209 |
| BSS-HST 14 | 200615 | 17.35 | 16.96 | 16.74 | 287.7141448 | -59.9718412 |
| BSS-HST 15 | 400824 | 17.37 | 16.70 | 16.42 | 287.7248176 | -59.9839133 |
| BSS-HST 16 | 102747 | 17.39 | 17.04 | 16.85 | 287.7173063 | -59.9840910 |
| BSS-HST 17 | 400057 | 17.42 | 16.83 | 16.60 | 287.7302078 | -59.9810638 |
| BSS-HST 18 | 100697 | 17.48 | 17.13 | 16.86 | 287.7170084 | -59.9854774 |
| BSS-HST 19 | 101003 | 17.63 | 16.89 | 16.53 | 287.7211611 | -59.9805172 |
| BSS-HST 20 | 200325 | 17.55 | 17.16 | 17.02 | 287.7168190 | -59.9744878 |
| BSS-HST 21 | 100375 | 17.58 | 17.21 | 17.13 | 287.7172990 | -59.9858952 |
| BSS-HST 22∗ | 402781 | 17.61 | 17.39 | 0.00 | 287.7326068 | -59.9968094 |
| BSS-HST 23 | 402020 | 17.66 | 17.11 | 16.96 | 287.7227464 | -59.9894086 |
| BSS-HST 24 | 400970 | 17.71 | 17.23 | 16.90 | 287.7269696 | -59.9853010 |
| BSS-HST 25 | 200345 | 17.78 | 17.36 | 17.33 | 287.6964971 | -59.9686652 |
| BSS-HST 26 | 101463 | 17.83 | 17.19 | 16.90 | 287.7132449 | -59.9851350 |
| BSS-HST 27 | 100650 | 17.93 | 17.28 | 16.90 | 287.7174733 | -59.9848700 |
| BSS-HST 28 | 100538 | 17.95 | 17.47 | 17.22 | 287.7179025 | -59.9857687 |
| Name | Identification | B | V | Ra | Dec |
|---|---|---|---|---|---|
| BSS-WFI 1 | 200185 | 15.50 | 15.44 | 287.79768541 | -60.01398330 |
| BSS-WFI 2 | 300157 | 15.88 | 15.70 | 287.35904310 | -59.86002383 |
| BSS-WFI 3 | 200384 | 16.34 | 15.89 | 287.64642963 | -59.99679754 |
| BSS-WFI 4 | 600037 | 16.12 | 15.91 | 287.48772573 | -60.23306210 |
| BSS-WFI 5 | 204257 | 16.35 | 15.94 | 287.78519229 | -60.01891775 |
| BSS-WFI 6 | 210167 | 16.37 | 16.03 | 287.64246963 | -59.94914751 |
| BSS-WFI 7 | 100153 | 16.48 | 16.08 | 287.97965536 | -59.85447178 |
| BSS-WFI 8 | 204708 | 16.52 | 16.09 | 287.82375822 | -60.01162798 |
| BSS-WFI 9 | 300014 | 16.47 | 16.15 | 287.55954128 | -60.08444017 |
| BSS-WFI 10 | 100055 | 16.61 | 16.18 | 287.98656952 | -60.00510958 |
| BSS-WFI 11 | 200063 | 17.00 | 16.60 | 287.72523309 | -60.05433501 |
| BSS-WFI 12 | 207299 | 17.04 | 16.65 | 287.79184573 | -59.98062382 |
| BSS-WFI 13 | 212606 | 17.08 | 16.70 | 287.59023051 | -59.89508558 |
| BSS-WFI 14 | 100306 | 17.06 | 16.71 | 287.92303829 | -60.08714733 |
| BSS-WFI 15 | 210826 | 17.15 | 16.74 | 287.69627737 | -59.93746201 |
| Cluster | Mass | / | |||||
|---|---|---|---|---|---|---|---|
| (arcsec) | (arcsec) | ||||||
| (1) | (2) | (3) | (4) | (5) | (6) | (7) | (8) |
| NGC 5272(M3) | 3.5 | 5.8 | 5.6 | 0.28 | 22″ | 30″ | 0.73 |
| NGC 6205(M13) | 3.4 | 5.8 | 7.1 | 0.07 | 46″ | 40″ | 1.15 |
| NGC 6093(M80) | 5.4 | 6.0 | 12.4 | 0.44 | 7″ | 6.5″ | 1.07 |
| NGC 6254(M10) | 3.8 | 5.4 | 5.6 | 0.27 | 34″ | 40″ | 0.85 |
| NGC 288 | 2.1 | 4.9 | 2.9 | 0.92 | 60″ | 85″ | 0.71 |
| NGC 6341(M92) | 4.4 | 5.3 | 5.9 | 0.33 | 15″ | 14″ | 1.07 |
| NGC 6752 | 5.2 | 5.2 | 4.5 | 0.18 | 23″ | 13.7″ | 1.67 |
| 5.7″ | 28″ | 0.82 | |||||
| NGC 104(47Tuc) | 5.1 | 6.1 | 11.5 | 0.2 | 16″ | 21″ | 0.76 |