Evidence for New Unidentified TeV -ray Sources from
Angularly-Correlated Hot-Spots Observed by
Independent TeV -ray Sky Surveys
Abstract
We have examined the directional cross-correlation of statistical ‘hot-spots’ between a Northern Sky TeV Gamma Ray Survey by the Milagro Observatory and a similar survey by the Tibet Array. We find the directions of these hot-spots are angularly uncorrelated between the two surveys for large angular separations (), but there appears to be a statistically significant correlation between hot-spot directions for . Independent simulations indicate the chance probability for the occurrence of this correlation is approximately , implying the existence of one or more previously unobserved TeV -ray sources in these directions. The data sets are consistent with both point-like sources or diffuse sources with extent of .
1 Motivation
The Milagro observatory and the Tibet Air Shower array are wide field of view TeV -ray (1 TeV = 1012 eV) observatories that are capable of monitoring the northern hemisphere sky on both long and short timescales. The Tibet and Milagro detectors have similar exposures and angular resolutions () as verified by moon shadow analysis (Samuelson, F., 2001; Amenomori, M., et al., 2001b). Based on the moon shadow analysis Tibet reports a systematic pointing error of 0.1∘ while Milagro reports an overall angular resolution of 0.75∘ including pointing errors. Recent Tibet (Amenomori, M., et al., 2001a; Cui, S. W. and Yan, C. T., 2003) and Milagro (Atkins, R., et al., 2004) northern-hemisphere sky surveys have detected statistical ‘hot-spots’ where excessive numbers of cosmic-rays ( above expected background level) appear to be concentrated from specific directions. Two of these hot-spots are identified with well known TeV sources (Atkins, R., et al., 2003; Amenomori, M., et al., 1999, 2003). In each sky survey, the remaining hot-spots are consistent with random statistical fluctuations in the cosmic ray background rate in each direction. However, if real TeV -ray sources exist with fluxes just below the sensitivity of these observatories, then one may expect to see angular correlation between the directions of the Milagro sky-survey hot-spots and the Tibet survey hot-spots, with an angular correlation distance equal to a convolution of the angular resolution functions of the two detectors. This may be complicated by pointing errors for weak point sources and detector systematics. Furthermore, it is unclear what angular correlation to expect for a diffuse TeV -ray emission region.
2 Milagro and Tibet All-Sky Analysis
Both Milagro and Tibet performed a -ray sky survey by plotting the angular distribution of reconstructed directions of cosmic-rays and -rays on an all-sky map. The sky map is divided into finite size angular bins, and hot-spots in the sky map are identified where a statistically significant number of excess cosmic-rays and -rays (above an average background level) appear in the selected angular bin.
The Tibet analyses (Amenomori, M., et al., 2001a) determine the background () by the equi-declination method. This method assumes that the background in the same declination band as the source constitutes a smooth background in RA. For both Tibet sky surveys, the estimated background in the signal bin is determined by performing a second order fit to the off source bins.
The Milagro analysis uses the method of direct integration to estimate the background(Atkins, R., et al., 2003; Morales, M., 2002; Alexandreas, D. et al., 1993). The direct integration method works on the assumption that cosmic rays create an isotropic background and that the acceptance of the detector is independent of trigger rate over some time period (2 hours in the Milagro analysis). The expected number of background events Nexp is estimated using
| (1) |
The E(HA,) term is the acceptance of the detector in local coordinates (HA and declination), R(t) is the trigger rate over some time window (in the case of (Atkins, R., et al., 2004) the window is two hours), and is a mapping function between local coordinates and celestial coordinates as a function of time.
The statistical significance in each angular bin is calculated differently for both surveys. The Milagro survey used the method of Li & Ma (1983). The Tibet analyses calculated the statistical significance of each bin using a somewhat simpler technique(Amenomori, M., et al., 2001a).
The Tibet 2001 sky survey analysis (Amenomori, M., et al., 2001a) finds 18 hot-spots (above 4) which are un-associated with any known TeV -ray source. The Tibet 2003 sky survey (Cui, S. W. and Yan, C. T., 2003) find 21 hot spots which are un-associated with known TeV -ray sources, but only report the directions of three of these hot-spots in their paper. In each Tibet survey a different non-overlapping data set was used. Thus the two Tibet surveys should be independent of each other. The Milagro analysis (Atkins, R., et al., 2004) reports the directions of 9 unidentified hot-spots. Table 1 summarizes the relevant information regarding the three surveys.
3 Angular Correlations Between Milagro Hot-Spots and Tibet Hot-Spots
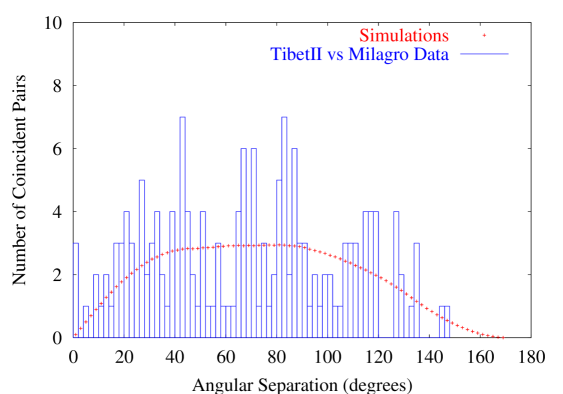
Since the Tibet 2003 analysis only reports an incomplete list of hot-spot directions in their sky survey, we have limited our analysis to angular correlations between the 18 Tibet 2001 hot-spot directions and the 9 Milagro hot-spot directions. We compile the measured angular correlation distribution between the two surveys by pairing each Milagro hot spot direction with every Tibet 2001 direction and calculating the angular separation between the pair. We populate a histogram with angular differences derived for each possible pair combination between the two surveys. Figure 1 illustrates the resulting histogram distribution of angular differences between the two independent sky survey hot-spot populations. In this plot we have binned the data in bins, larger than the expected combined angular correlation distance ().
The expected angular correlation distribution for uncorrelated pairs is influenced mostly by geometrical considerations of field of view of the two instruments, and specifically the number of possible angular combinations available when random shower directions are seeded over the fields of view of each instrument. In order to simulate this, we populated 0.1 sized bins in right ascension(RA) and declination (Dec) with a sample of events drawn from a mean background population. The background population was uniform in RA and followed a dependence in declination. (We also looked at a and a distribution and found our results to be very similar.) Here is the specific latitude for each observatory, and reflects the range of declination field of view of each observatory. In general the distribution of excesses in the sky should be independent of the region of the sky (assuming the significance is calculated correctly). Once an independent simulated sky map was generated for each observatory, in accordance with its specific latitude and field of view, each sky map was binned in a manner appropriate to the method employed by each analysis (a circle for Tibet 2001 and a square for Milagro). The background for both simulated sky maps were found by averaging 20 bins at the same declination, and the statistical significance of each bin population was then calculated using the Li & Ma method for the Milagro simulation, and the Tibet method for the Tibet simulation. The Tibet method, as quoted, is
| (2) |
Where is the significance, is the number of counts in the source bin, is the number of counts in the off source bins, and m is the ratio of exposures to the on source region and the off source region (Amenomori, M., et al., 2001a).
The simulations for Tibet 2001 produced on average 11 hot-spots with statistical significance , in good agreement with the observed number. The simulations for Milagro produced an average of 10 hot spots of similar significance, also in good agreement with the reported number. The expected angular correlation distribution for uncorrelated pairs was then compiled by pairing each simulated Milagro hot-spot with every simulated Tibet hot-spot and calculating the angular separation between the pair, in a manner identical to that applied to the real data (see figure 1).
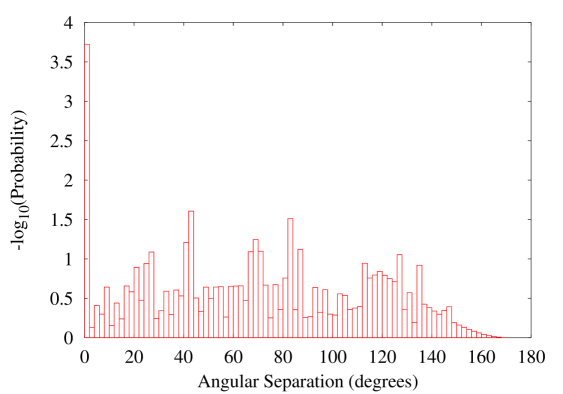
For large angular separations () the measured and simulated correlation distributions are in reasonable agreement. At small angular separations (), there is a statistically significant deviation from the expected angular correlation distribution for uncorrelated pairs. Three correlated pairs are found, whereas approximately 0.1 are expected. Each of these pairs is found to have angular separation between the correlated hot-spots, consistent with expectations from the combined angular resolution between the two detectors. Figure 2 shows the integral Poisson probability for finding the observed number of correlations, given the mean value from the simulation.
The probability for finding 3 hot-spot pairs (within 1.5∘) between the two surveys can be estimated by placing the 18 Tibet 2001 locations and the 9 Milagro locations randomly and uniformly across the sky in the declination regions used in each sky survey. These simulated distributions are then searched for coincident hot-spots and the probability of having hot-spot correlations with is compiled from the fraction of simulations which yield correlated hot-spot pairs. (Method 1). This is a reasonable approximation because the distribution of hot-spots is found to be relatively uniform across the observatory’s field of view in both measured sky survey distributions as well as the above uncorrelated pair angular correlation distribution simulations.
The more extensive angular correlation distribution simulations can also be used to independently calculate the probability of observing hot-spot correlations with from the fraction of simulations which yield correlated hot-spot pairs. (Method 2). The results of our these calculations for both methods are presented in Table 3. The calculations of both methods are consistent with each other and indicate that the chance probability of finding 3 uncorrelated hot-spot pairs (within 1.5∘) between the two surveys is small.
In any analysis of this type, the number of trials must be taken into account. The Monte Carlo simulation method accounts for all trials except for that associated with the choice of a correlation distance of 1.5∘. In this work our choice of 1.5∘ is based upon the expected independently combined angular resolution of Tibet and Milagro (). We did not examine correlations on different length scales, but it is important to note from figure 1 that this result is relatively independent of any reasonable choice of the correlation distance between and 4∘. This would indicate a trials factor for the angular correlation distance of order of magnitude 1.
However, even if one conservatively assumed trials factor of order 10, the observed deviation from the expected random behavior at small angular separations is still statistically compelling.
4 Results and Discussion
The coordinates of the three angularly correlated hot-spot pairs derived from the Tibet 2001 and Milagro sky surveys are given in Table 2. Of the hot-spot pairs, we find Pair A (hot-spots 1 and 5) and Pair B (hot-spots 2 and 6) to be the most interesting. Pair A lies on the galactic plane. The chance probability of this single pair is 5.4% using Method 1. Although this chance probability is marginally interesting, there also exists a Tibet 2003 hot-spot of excess in this region. The Tibet 2003 hot-spot is 1.8∘ from the Tibet 2001 hot-spot and 3.1∘ from the Milagro hot-spot. Summing the probabilities for all permutations of these three hot-spots, we estimate an overall chance probability of 1.5% for such a coincidence. TeV observations in the direction of Pair A have been made by the Whipple Collaboration in 1999 (7.2 hours on J2020, which is 1∘ south of hot-spot 5) and in 2002 (4.2 hours on hot-spot 5)(Walker, G. and Kieda, D., 2004). These observations yielded no point-sources of -rays at the 0.5 Crab level flux, assuming a Crab-like power-law energy spectrum.
The second hot-spot pair correlation (Pair B, hot-spots 2 and 6 in Table 1) has a 0.6% chance of random occurrence (with an angular separation , using Method 1) and is near an X-ray bright region of the Cygnus Loop, in the Galactic Plane. The third hot-spot pair correlation (Pair C , hot-spots 3 and 7 in Table 2) lies in the same field as Pegasus and consists of numerous faint galaxies, but is off the Galactic Plane. The Whipple Observatory has not had any contemporaneous observations in either of these directions.
5 Conclusions
While the hot-spot regions reported by the Milagro and the Tibet groups are not statistically significant on their own, angular correlations between hot-spots in the two sky surveys strongly indicate the possible presence of one or more new, unidentified TeV -ray sources with -ray flux just at or slightly below the flux sensitivity of each experiment.
Based on the published upper limits for the Milagro hot-spots the expected flux from these possible observations must be 0.8 times the flux from the Crab Nebula in the TeV range in order to have caused these fluctuations, and simultaneously avoided strong direct-detections by the two northern-sky surveys. The energy spectrum could be a power law. It is also possible that spectrum is non-conventional. However there is no evidence to suggest either.
It may be fruitful for more sensitive GeV/TeV -ray instruments to perform observations around these source regions to search for possible new sources of GeV/TeV -rays. However, the sources in question may exhibit variability or may be diffuse sources, causing difficulties with IACT confirmation. Consequently, we suggest that correlated angular analysis between all-sky surveys in other wavelengths (such as MeV/GeV Satellite measurements and the AMANDA/ICECUBE neutrino detectors ) may provide additional evidence for new astrophysical sources whose emission rate falls just slightly below the sensitivity of these instruments.
6 Acknowledgments
We gratefully acknowledge support for this work from the University of Utah and the National Science Foundation under NSF Grants #PHY 0079704 and #PHY 0099580. We thank Paul Sommers for useful comments and discussion on this article. Lastly we would like to thank the referee for his/her useful comments that have improved our paper.
References
- Alexandreas, D. et al. (1993) Alexandreas, D.E. et al., 1993, Nucl. Instrum. Meth. A, 328, 570
- Amenomori, M., et al. (2003) Amenomori, M., et al. 2003, ApJ, 598, 242.
- Amenomori, M., et al. (2001a) Amenomori, M. et al., 2001a, in Proc. 27th International Cosmic Ray Conference, Vol. 6, ed. K. H. Kampert, G. Heinzelmann, and C. Spiering (Hamburg: Copernicus), 2544.
- Amenomori, M., et al. (2001b) Amenomori, M. et al., 2001b, in Proc. 27th International Cosmic Ray Conference, Vol. 2, ed. K. H. Kampert, G. Heinzelmann, and C. Spiering (Hamburg: Copernicus), 573.
- Amenomori, M., et al. (1999) Amenomori, M., et al. 1999, ApJ, 525, L93.
- Atkins, R., et al. (2004) Atkins, R., et al., 2004, ApJ, 608, 680.
- Atkins, R., et al. (2003) Atkins, R., et al. 2003, ApJ, 595, 803.
- Cui, S. W. and Yan, C. T. (2003) Cui, S. W. and Yan, C. T., 2003, in Proc. 28th International Cosmic Ray Conference, OG2.2, ed. T. Kajita, Y. Asaoja, A. Kawachi, Y. Matsubara, and M. Sasaki (Tokyo: ICRR), 2315.
- Li & Ma (1983) Li, T.-P. & Ma, Y.-Q. 1983, ApJ, 272, 317.
- Morales, M. (2002) Morales, M. 2002, Ph.D. thesis, University of California Santa Cruz.
- Samuelson, F. (2001) Samuelson, F. 2001, in Proc 27th International Cosmic Ray Conference, Vol 2, ed. K. H. Kampert, G. Heinzelmann, and C. Spiering (Hamburg: Copernicus), 594.
- Walker, G. and Kieda, D. (2004) Walker, G. and Kieda, D. 2004, New A Rev., 48, 477.
| Obs. | Ang. Resolution | Dates of Exposure | Dec. Region (deg.) | N 4 | Threshold Energy (TeV) |
|---|---|---|---|---|---|
| Milagro | 0.75 | Jan. 2001 to Dec. 2003 | 1.1 to 80 | 11 | 0.2a |
| Tibet 2001 | 0.9 | Feb. 1997 to Oct. 1999 | 10 to 50 | 19 | 3b |
| Tibet 2003 | 0.9 | Nov. 1999 to June 2001 | 0 to 60 | 23 | 3b |
| Pair | No. | Survey | RA | Dec | Flux Limits(Crab Flux) | |
|---|---|---|---|---|---|---|
| A | 1 | Milagroa | 306.6 | 38.9 | 4.2 | 0.78 |
| B | 2 | Milagroa | 313.0 | 32.2 | 4.5 | 0.85 |
| C | 3 | Milagroa | 356.4 | 29.5 | 4.1 | 0.84 |
| A | 4 | Tibet 2003b | 304.15 | 36.45 | 4.0 | NA |
| A | 5 | Tibet 2001c | 305.4 | 37.9 | 4.15 | NA |
| B | 6 | Tibet 2001c | 313.5 | 32.4 | 4.27 | NA |
| C | 7 | Tibet 2001c | 358.0 | 30.1 | 4.10 | NA |
Note. — Excesses corresponding to known source locations have been excluded(Crab and Mrk 421)
| N | Method 1 | Method 2 |
|---|---|---|
| 0 | 94.5% | 96.1% |
| 1 | 5.4% | 3.7% |
| 2 | 0.1% | 0.16% |
| 3 | 0.003% | 0.011% |