Probing the embedded YSOs of the R CrA region through VLT-ISAAC spectroscopy ††thanks: Based on observations collected at the European Southern Observatory, Chile (ESO N.069.C-0269, 070.C.-0138, 063.I-0691)
Near IR spectra at low (R800) and medium (R9000) resolution, obtained with ISAAC at VLT, have been used to pose constraints on the evolutionary state and accretion properties of a sample of five embedded YSOs located in the R CrA core. This sample includes three Class I sources (HH100 IR, IRS2 and IRS5), and two sources with NIR excesses (IRS6 and IRS3). IRS5 and IRS6 have been discovered to be binaries with a separation between the two components of 97 and 78 AU, respectively. Absorption lines, typical of late-type photospheres, have been detected in the medium resolution spectra of all the observed targets, including HH100 IR and IRS2 which have high values of infrared continuum veiling ( = 6 and 3, respectively). These two sources also present low resolution spectra rich of emission lines (HI, CO and plenty of other permitted lines from neutral atoms) likely originating in the disk-star-wind connected regions. Among the features observed in HH100 IR and IRS2, Na I at 2.205 m and CO at 2.3m, which are more commonly used for stellar classification, are detected in emission instead of absorption. Several strong photospheric lines, which lie around 2.12 and 2.23m and whose ratio is sensitive to both effective temperature and gravity, are proposed as independent diagnostic tools for this type of sources. We derived spectral types, veiling and stellar luminosity of the five observed sources, which in turn have been used to infer their mass (ranging between 0.3-1.2 M⊙) and age (between 105 and 106 yr) adopting pre-main sequence evolutionary tracks. We find that in HH100 IR and IRS2 most of the bolometric luminosity is due to accretion (/ 0.8 and 0.6 respectively), while the other three investigated sources , including the Class I object IRS5a, present a low accretion activity (/ 0.2). Mass accretion rates of the order of 2 10-6 and 3 10-7 M⊙ yr-1 are derived for HH100 IR and IRS2, respectively, i.e. higher by an order of magnitude with respect to the average values derived in T Tauri stars. We observe a general correlation between the accretion luminosity, the IR veiling and the emission line activity of the sources. In particular, we find that the correlation between and , previously reported for optical T Tauri stars, can be extended also to the embedded sources, up to at least one order of magnitude larger line luminosity. A correlation between the accretion activity and the spectral energy distribution slope is recognizable but with the notable exception of IRS5a. Our analysis therefore shows how the definition of the evolutionary stage of deeply embedded YSOs by means of IR colors needs to be more carefully refined.
Key Words.:
Stars: circumstellar matter – Stars: formation – Infrared: stars – ISM: individual objects: R CrA – Line: formation1 Introduction
During the first evolutionary stages of a young star, the protostellar system is characterized by a variety of phenomena occurring in different regions of the circumstellar environment. These include the accretion disk, the magnetospheric accretion region, collimated jets and, in more embedded sources, the still not dispersed dusty envelopes. In T Tauri systems, where the contribution from the dusty envelope has become negligible, there is the possibility to disentangle, through observations at different wavelengths, the emission from the star itself from that of the different active circumstellar regions, and to define in detail the properties of these latters. Hence the stellar parameters of T Tauri stars have been derived through the observations of their optical and IR photospheric features (e.g.Luhman & Rieke 1998), their accretion region revealed through the observation of the UV excesses over the stellar photosphere (e.g. Gullbring et al. 1998), and finally their collimated jets probed down to close to their base through high resolution observations of optical forbidden lines (e.g. Bacciotti et al. 2000). The possibility to separate the different emission components contributing to the stellar system has greatly advanced the comparison of observations with models describing the accretion and ejection mechanisms in these stars, as well as the disk evolution and dispersal. It is however fundamental to understand how and if these models works for less evolved systems, where the circumstellar activity is much higher and the accretion luminosity is expected to dominate over the luminosity of the still forming star. To this aim, a sample of interesting objects to be investigated are sources with no optical counterpart, characterized by steeply rising IR SEDs and with infrared colors indicating the presence of intrinsic excesses due to circumstellar dust (the so-called Class I sources). The standard paradigm is that most of these sources are protostars still embedded in their original infalling envelope and expected to derive most of their luminosity from accretion through a massive circumstellar disk. For such more embedded sources, however, the large extinction coupled with strong emission excesses due to the circumstellar envelope, make the investigation of phenomena occurring very close to the protostar extremely difficult and thus their real nature remains often obscure. Infrared spectroscopy in this respect can significantly improve the study of the close environments of these sources, since different gas features which are present in the near IR atmospheric windows can be related to different emitting regions. The near IR spectra of these objects are often characterized by the presence of ionized (e.g. Fe+) , neutral (e.g. HI, He) and molecular (CO, H2) emission lines. Such lines originate in the inner and warm regions of the disk, in the accretion region connecting the disk to the star, and in the related phenomenon of winds and jets, and consequently they have been used to probe such different environments (e.g. Nisini et al. 2002, Najita et al. 1996, Davis et al. 2002, Muzerolle et al. 1998). The large values of the IR excess characteristic of these source, however, produce a large veiling which makes extremely difficult to infer their stellar properties by means of their underlying photospheric features and therefore to correlate the spectral probes of circumstellar activity with the physical parameters of the star itself.
Recently, the first direct observation of absorption lines from the photosphere of a Class I source in the Oph cloud has been reported by Greene & Lada (2002). The observed features are typical of late type stars, confirming the low mass nature of these sources, and have been used to determine for the first time the stellar properties of one of such highly obscured objects, which resulted to have 70% of its luminosity due to accretion. The potentiality offered by high-resolution near IR spectroscopy to reveal the central protostellar source characteristics opens in turn the possibility to both derive the mass and ages of these young objects, as well as infer quantitatively the mass accretion rate and accretion luminosity to be compared with those of expected more evolved sources. In order to make this comparison significant it is also important to have this information in a sample as large as possible of embedded sources, in such a way to better constrain their global accretion properties. In this paper we report the results of an analysis of medium/high resolution near IR spectra of a sample of embedded young stellar objects of the nearby R CrA star forming cloud (D=130 pc, Marraco & Rydgren 1981). The selection of sources from the same cloud assures that the properties of the sources reflect intrinsic differences and not the different characteristics of the hosting cloud. The aim of this paper is twofold: 1) to infer, through the observations of photospheric features, the stellar physical parameters of the considered objects and from these indirectly derive their age, accretion luminosity and mass accretion rates. This information will be used to understand to which extent the spectral energy distribution of embedded IR sources is really indicative of their evolutionary stage; 2) to establish if there is a correlation between the accretion luminosity of the embedded stars and the occurrence and luminosity of their IR emission lines in order to have an indirect instrument to quantitatively derive the accretion rate from simple observational tools. We describe the considered sample in §2 and the observations obtained at VLT with the ISAAC instrument in §3. In §4 and §5 the characteristics of the emission line spectra are described, while in §6 and 7 we present the procedure adopted to derive the stellar and circumstellar properties from the detected absorption features. Finally, in §8 we discuss the implications of our findings.
2 Description of the selected sample
The sources investigated in this paper have been taken from the
sample of IR young stellar objects in the R CrA cloud core listed by
Wilking et al. (1997). From this list,
we
have selected all the IR sources with K magnitudes smaller than 10.5 mag
and IR colors compatible with the locus of young embedded protostars with intrinsic IR excesses
(Lada & Adams 1992).
The list of sources is presented in Table 1 with their coordinates,
IR magnitudes and luminosities, when available. All the sources have luminosities ranging
between 1 and 15 L⊙, and thus they are expected to be low mass young
stellar objects.
Three of the considered sources, namely HH100 IR, IRS2 and IRS5, can be classified as
Class I protostars on the basis of their spectral energy distribution
(having spectral index between 2 and 10m 0, Wilking et al. 1986).
These three sources are known to have large dusty envelopes as testified by the
presence of strong ice bands and silicate features in their 3, 5 and 10m spectra
(Brooke et al. 1999, Whittet et al. 1996, Alexander et al. 2003, Chen & Graham 1993,
Pontoppidan et al. 2003). HH100 IR has been also suggested as the driving source
of the Herbig Haro objects HH101 and HH99 (Hartigan & Graham 1987)
and of a bipolar molecular outflow (Anglada et al. 1989).
| Source | (2000) | (2000) | K | (K-L) | (H-K) | (J-H) | Ref.b | Lbol | |
|---|---|---|---|---|---|---|---|---|---|
| magnitudes | (L☉) | ||||||||
| IRS2 (TS13.1) | 19 01 41.5 | 36 58 29 | 7.16 | 2.72 | 2.73 | 4.07 | 0.98 | TS | 12c |
| 7.2 | – | 2.7 | 3.9 | SOFI | |||||
| IRS5 (TS2.4) | 19 01 48.0 | 36 57 19 | 10.33 | 2.75 | 3.32 | 3.89 | 1.12 | TS | 3c |
| IRS5a | 10.9 | – | 3.8 | – | ISAAC | 2 | |||
| IRS5b | 11.5 | – | 3.4 | – | ISAAC | ||||
| IRS6 (TS2.3) | 19 01 50.6 | 36 56 38 | 10.34 | 1.74 | 2.37 | 3.64 | 0 | TS | 0.6d |
| IRS6a | 11.1 | – | 2.2 | – | ISAAC | 0.3 | |||
| IRS6b | 11.7 | – | 3.1 | – | ISAAC | ||||
| HH100 IR (TS2.6) | 19 01 50.7 | 36 58 10 | 8.04 | 3.36 | 3.5 | 4.87 | 1.47 | TS | 14c |
| 7.4 | – | 2.5 | 4.1 | SOFI | |||||
| IRS3 (TS4.4) | 19 02 05.1 | 36 58 56 | 8.64 | – | 2.02 | 2.26 | TS | 0.3d | |
| 9.50 | – | 0.93 | 0.14 | B92 | |||||
aSpectral index () between 2 and
10m.
bOrigin of photometric data: TS = Taylor & Storey (1984), SOFI = our NTT-SOFI
observations (March 2003), ISAAC = VLT-ISAAC archive data (1999), B92 = Burton et al. (1992).
cFrom Wilking et al. 1992
destimated from the photometry up to the band given by Wilking et al. 1986
3 Observations
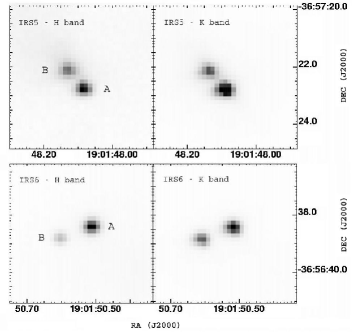
Observations were carried out at VLT/UT1 with the ISAAC spectrograph in SW mode on 12 and 13 July, 2002. At the spatial resolution provided by ISAAC (i.e. 0.14 arcsec/pixel), the sources IRS5 and IRS6 were recognized to be binaries, with a separation of 0.75 and 0.6 arcsec (i.e. 97 and 78 AU), respectively. Figure 1 shows H and K images obtained from VLT pre-imaging of these stars, in which the two components that we named a and b are clearly visible. Due to their alignment in the sky, a single slit, with a position angle of 32.6∘, was adopted to observe simultaneously IRS5a and b, and IRS6a.
Low resolution spectra through the J(1.1-1.4m),
SH (1.4-1.82m) and SK (1.82-2.5m) filters
were acquired with a slit aperture of 06 corresponding to
a resolution from 750 (in the K band) to 960 (in the J band).
For each source, medium resolution spectra were also acquired in two
spectral segments centered at 2.261m and 2.161m each
covering 0.122m around the central wavelength.
HH100 IR, IRS2 and IRS3 were also observed in an additional segment in the H
band, centered at 1.6295m and covering 0.080m. For these observations
we used the 03 slit correspondig to a nominal resolution of
R8000 and R9000 for the K and H observations, respectively.
Spectra of standard stars of O spectral type were also obtained in both low and
medium resolution at an airmass similar to the
scientific spectra to correct for telluric absorption. The telluric spectra
were carefully cleaned by any intrinsic HI and He absorption feature before being used.
In the low resolution spectra, wavelength calibrations were performed
using a Xenon lamp spectrum taken at the end of the night.
In medium resolution,
the lamp calibration was refined each time on the OH sky lines observed
in the spectra. In addition, the object and standard spectra were carefully
aligned each other against the atmospheric absorption features before being
rationed. This procedure leads to a
wavelength calibration error in medium resolution mode that we estimated
of the order of 0.1 Å(i.e. about 1-2 km s-1).
The spectra were obtained during not photometric nights, with a seeing variable between 1.5 and 2 arcsec. To flux calibrate our spectra we therefore used the broad band photometry obtained at SOFI with the NTT instrument during March 2003, whose values are reported in Table 1. For the IRS5 and IRS6 sources, since the NTT resolution is not high enough to resolve the binaries, we derived the magnitudes of the relative components using H and K VLT-ISAAC images taken from the ESO archive (ID programme 63.I-0691, April 1999). These are also reported in Table 1. From this table, and from the comparison of our derived photometry with the photometry given by Taylor & Storey (1984), we notice that a certain degree of variability is present in the considered sources, with the largest variation exhibited by HH100 IR and IRS3. HH100 IR source was already known to be highly variable, with near IR magnitudes changing by values as large as more than two magnitudes on timescales of one year (Molinari et al. 1993).
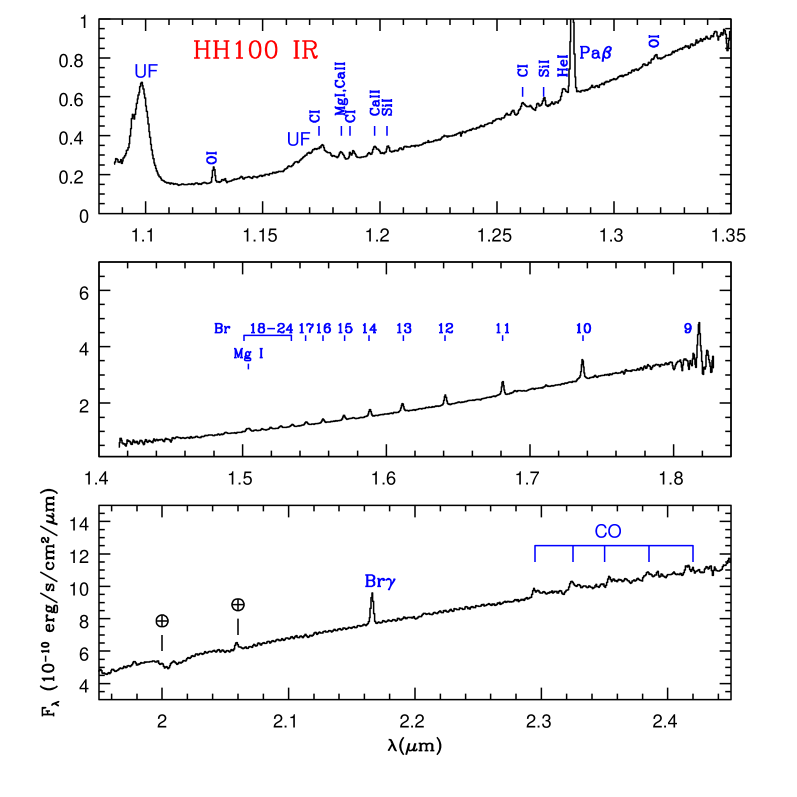
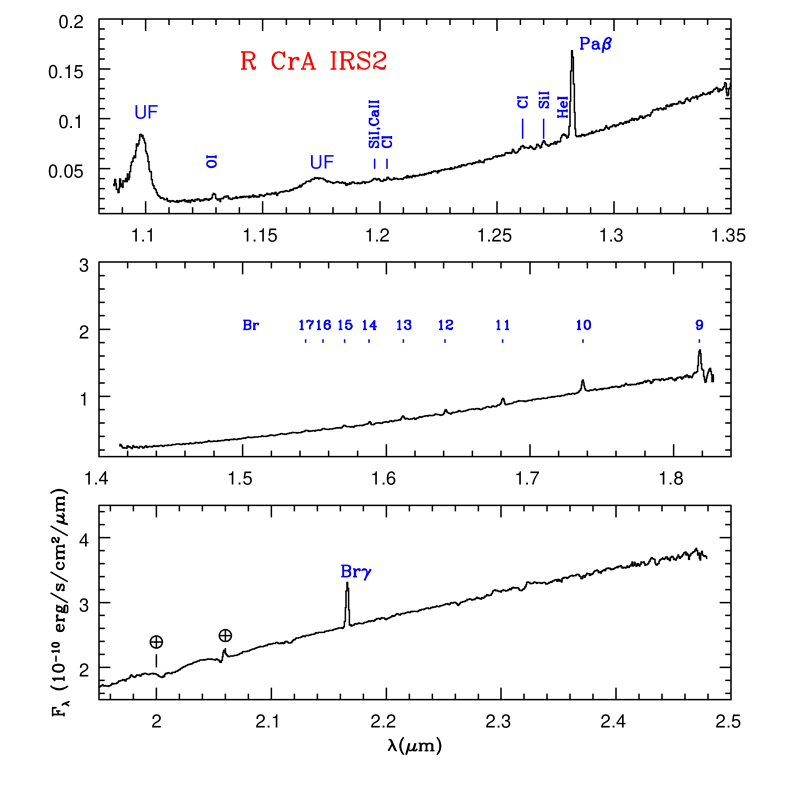
The complete low resolution spectra of the targetted sources are shown in Fig. 2. The NIR SEDs of all the sources but IRS3 are characterized by a continuum steeply rising from the J to the K band. The IRS 3 SED peaks in the H band and then declines. This evidence, and the fact that the H-K color of this source more recently measured, is smaller by about 1 mag with respect to the value given by Taylor & Storey (1984) (see Table 1), indicate that the IRS3 IR excess is significantly reduced with time. In the low resolution spectra of IRS3, IRS5a,b and IRS6a some features in absorption are present, while no significant line in emission is detected. Conversely, IRS2 and HH100 IR are characterized by rich spectra in emission with no absorption features (see also Figs. 3,4). Moreover in both of these spectra, and to a lesser extent also in IRS6a, we detect two broad features at 1.10 and 1.17m which remain unidentified.
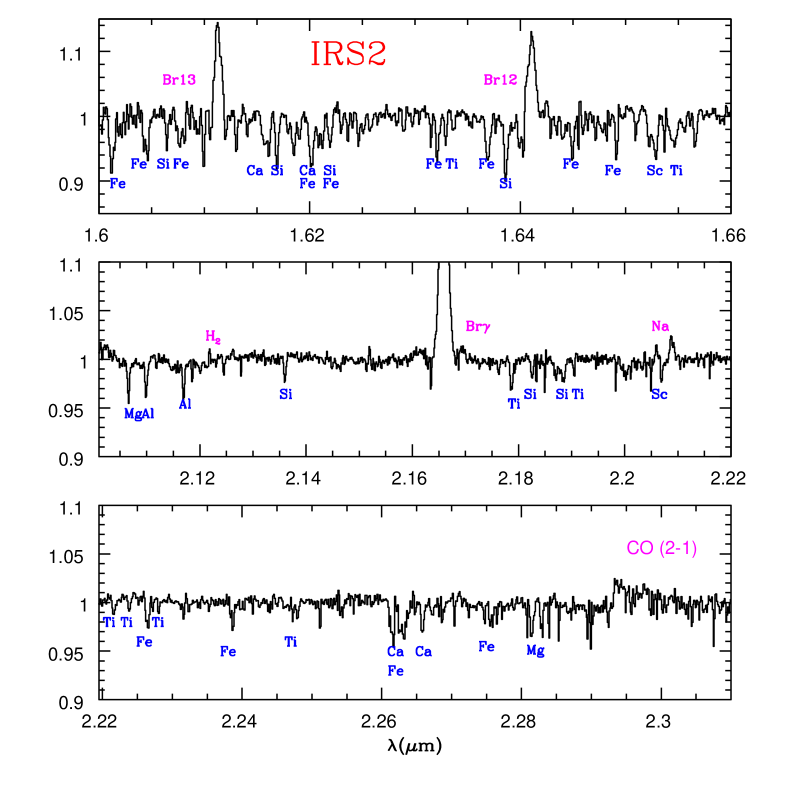
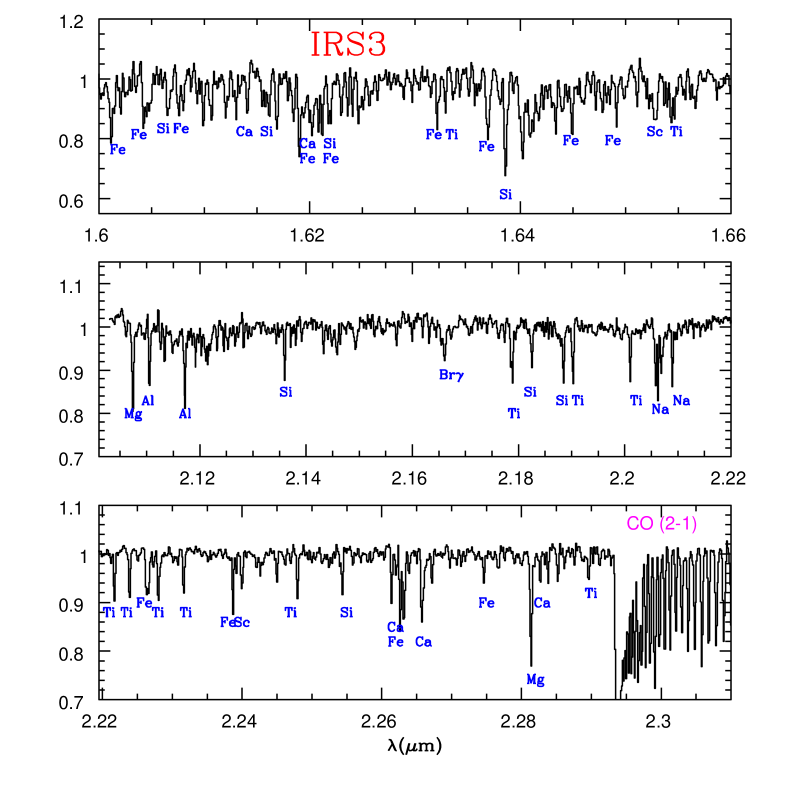
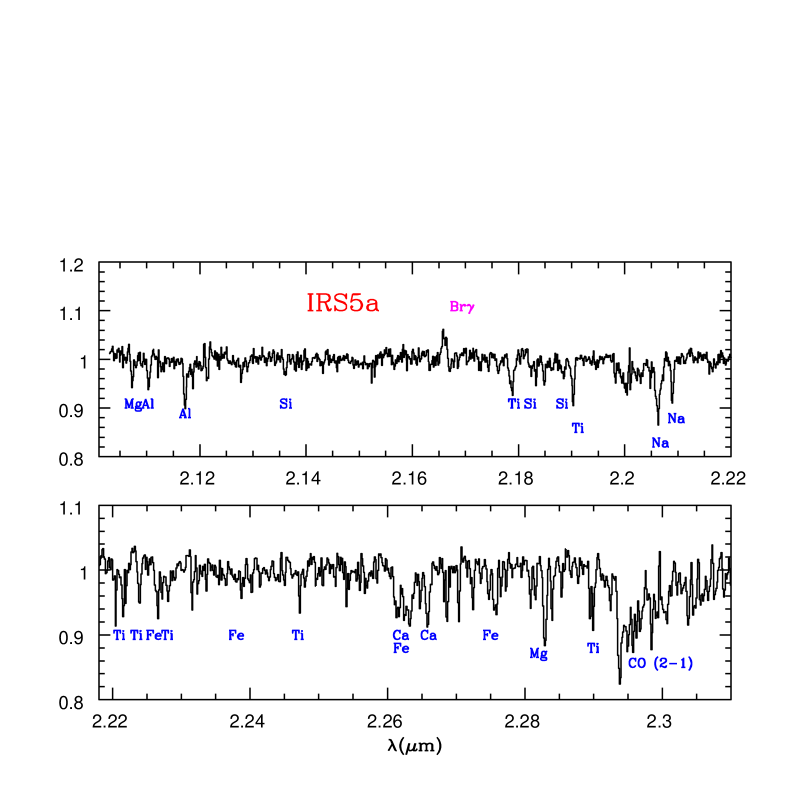
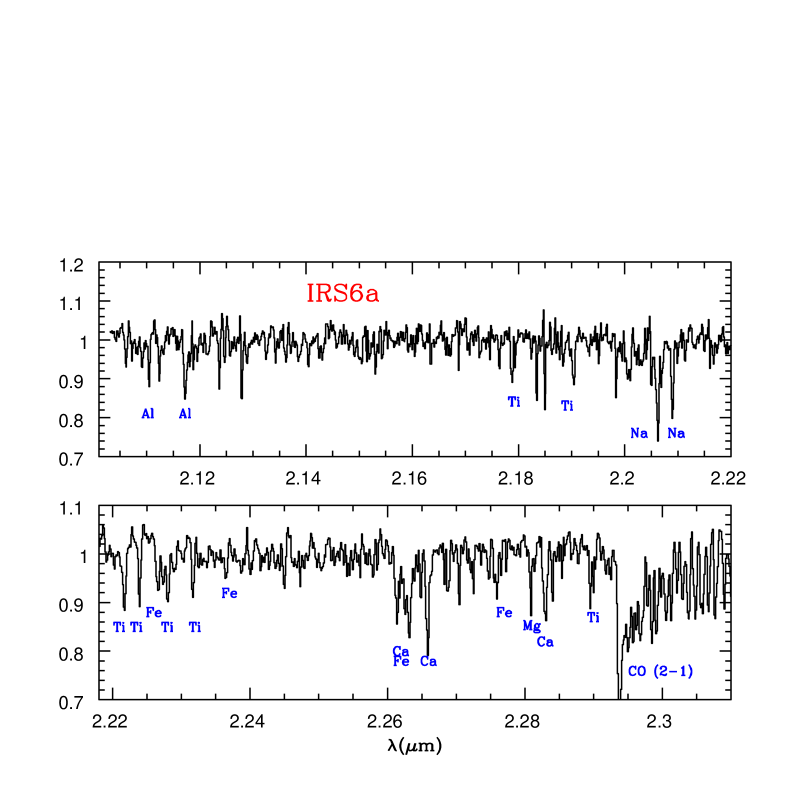
Figs. 5,6 and 7 show the normalized, high resolution spectral segments observed in each source. Given the weakness of IRS5b with respect to the other component, it was not possible to extract its medium resolution spectrum and therefore only the MR spectrum of IRS5a has been analyzed. All these spectra are characterized by the presence of many features in absorption. This is true also for HH100 IR and IRS2 where the higher resolution has allowed to detect narrow and weak features which remained undetected in the low resolution spectra. We will separately discuss the emission and absorption spectra of the observed sources in the following §4 and 5.

4 The emission lines
HH100 IR and IRS2 are the only sources showing a prominent emission spectrum rich of features (Figs. 3 and 4). Such features mainly include permitted transitions of neutral atoms. The HI lines are the strongest of them: we detect Br, Pa and other lines from the Brackett series up to n=20 in HH100 IR and IRS2, while a weak Br emission is also mesured in the MR spectrum of IRS5a. The HI lines observed in HH100 IR have been already presented and discussed in Nisini et al. (2004); in Table 2 we report the fluxes and the kinematical properties of the HI lines detected both in the low and high resolution spectra of IRS2 and IRS5a. A full account on the interpretation of the HI line emission in HH100 IR has been given in Nisini et al. (2004). The Brackett decrement observed on HH100 IR is consistent with emission from moderately optically thick lines originated from a compact region of few stellar radii. Moreover, the fact that the Brackett line profiles observed in high resolution are almost symmetrical with linewidths decreasing with the upper quantum number, is an indication in favour of an origin in an expanding stellar wind rather than in an accretion region, as often suggested for these lines (e.g. Muzerolle et al. 1998). In such an hypothesis, a mass loss rate of 10-6 M⊙ yr-1 has been derived for HH100 IR by using a simple model of an ionized wind. The Brackett lines observed in IRS2 shows characteristics similar to the HI lines of HH100 IR, such as the symmetry of the Br line and large linewidths. The Br12 and 13 profiles are also narrower than the Br line, but they appear less symmetric partially due to a superposition of few photospheric absorption lines which make difficult to reconstruct the intrinsic line profile. The IRS2 Brackett decrement resulting after having dereddened the observed lines with an extinction value =20 (see Table 7) is compatible with line optical depths smaller than in the HH100 IR case (see e.g. Fig. 2 of Nisini et al. (2004)), indicating lower densities of ionized material. If interpreted in the same wind model adopted for HH100 IR, such a decrement is consistent with a mass loss rate of ionized gas of 10-8 M⊙ yr-1, corresponding to a total mass loss rate of 1-2 10-7 M⊙ yr-1 assuming a ionization fraction between 0.05 and 0.1.
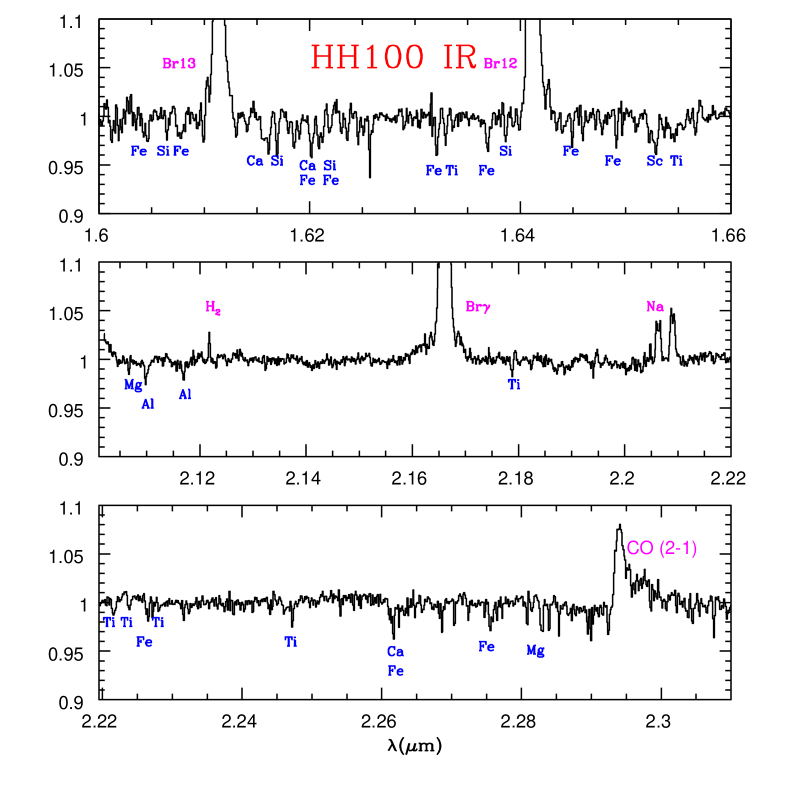
The other emission lines detected in the low resolution spectra of HH100 IR and IRS2 are listed in Table 3 where we have included only the features having an S/N larger than 3 and linewidth comparable to the instrumental resolution. In this table we indicate, when possible, the most probable identification done using the NIST database111 http://physics.nist.gov/PhysRefData/ASD1/ and guided by the spectra of other YSOs (Kelly et al. 1994) or objects with likely similar excitation conditions (Walmsely et al. 2000, Hamann et al. 1994). We tried as much as possible to check for the plausibility of a line identification by verifying that all the transitions of the same atom expected to originate from the same term were also detected. The observed atomic lines include several CI, OI, SiI and Mg I transitions, all coming from levels with energies 12.3 eV. The only ionic lines detected are from singly ionized Fe and Ca, which have ionization potential lower than 8 eV. In the high resolution spectral segments, in addition to the Br, Br12 and Br13 lines, the Na I doublet lines at 2.206 and 2.209m, and the 2.12m H2 v=1-0 S(1) lines are detected in emission in HH100 IR and IRS2 and their fluxes and kinematical characteristics reported in Tab 3.
Most of the observed atomic lines can be excited by both recombination and photo-excitation. For the two OI lines at 1.1287,1.3165 m fluorescence excitation by either an UV continuum or resonant absorption of HI Ly photons have been proposed as the most likely excitation mechanisms (see e.g. Kelly et al. 1994, Walmsley 2000). The several CI lines are on the other hand the brightest permitted lines predicted by recombination theory (Escalante & Victor 1990). The several lines from SiI and MgI, which have low ionization potentials, may also originate from recombination cascade. Some of the atomic species observed are those responsible for strong permitted optical lines in T Tauri stars, such as NaI and CaII. The levels from which the IR lines originate lie at excitation energies larger than the levels of the optical lines, but it is conciveable that the origin of the emission must be similar. Among different possibilities, emission from the disk-star accretion region (Basri & Bertout 1989, Hartmann 1998), from a stellar wind (Hartmann et al. 1990) and from an active cromosphere (Calvet et al. 1984) are the most commonly proposed. The kinematical characteristics of the two Na I lines detected in high resolution are remarkably similar to those of the Br emission, both in terms of linewidths and VLSR, which suggests that they come from the same emission region. We also note the absence of forbidden lines, e.g. from [FeII], which indicate that the emission line region is characterized by high densities where forbidden lines with critical densities lower than 105 cm-3 are quenched.
The weak H2 2.12m line detected in HH100 IR and IRS2 (Table 4) may be an indicator of both shocked gas in the interaction of the stellar wind with the ambient medium, and emission from the inner warm region of a circumstellar disk. The line is blueshifted and only barely resolved, with an intrinsic width of 20 km s-1 . Given these characteristics, the detected H2 emission may trace the base of a compact molecular outflow, such as those already detected in other Class I sources by Davis et al. (2001). In our case the emission is not spatially resolved, however the adopted slit may not be aligned with the compact jet emission. The origin in a circumstellar disk is however equally plausible. The upper limit on the line widths, together with the source mass estimates given in Tab 7, indicate that for a keplerian disk, the observed line are consistent with an emission region at 1 AU from the stellar source. Ro-vibrational H2 emission with linewidths similar to those observed by us have been detected from disks of some T Tauri stars (Bary et al. 2003). In conclusion both the jet and the disk hypothesis seem to be plausible for the 2.12m line origin. Finally CO in emission from different vibrational band heads in the 2.3m region is also detected in HH100 IR and IRS2. CO band head emission is a tracer for dense molecular gas at T2000-3000 K, and it is usually interpreted as a sign for the presence of active accretion disks. The reason is that to have this band in emission large columns of warm gas need to be present, and accretion may represent a viable disk heating mechanism (Najita et al. 1996).
The spectra of HH100 IR, IRS2 and IRS6a show, in addition to the emission lines, also two broad and strong unidentified features in emission, at 1.098 and 1.173 m, whose parameters are given in Table 5. Such features seem not originated by spurious or instrumental effects since they are not observed neither in the IRS3 spectrum nor in the spectra of the standard stars. They do not appear spatially resolved along the slit, being confined on the source. The large widths and strengths of these features resamble the characteristic shape of PAH emission, which however are so far never been observed at these wavelengths. The observations of PAH at such short wavelengths would imply electronic excitation of these macro-molecules and consequently the presence of strong UV fields which seem not to be associated with the low luminosity sources we are considering. The attribution of these features to PAH emission is also not favoured by the non-detection of the vibrationally excited PAH feature at 3.3m in the spectrum of HH100 IR (Whittet et al. 1996). Diffuse interstellar bands (DIBs) have been detected in the considered spectral range (Joblin et al. 1990) but they are features usually observed in absorption against a strong continuum. Unidentified dust emission features at 1.15 and 1.5m have been finally observed towards the reflection nebula NGC7023 (Gordon et al. 2000). Such features are however much broader ( 0.2-0.3m ) and more diffuse than those detected by us.
| Identification ( in m) | |||
|---|---|---|---|
| 10-15 erg s-1 cm-2 | |||
| HH100 IR | IRS 2 | ||
| 1.1291 | 1.52(0.05) | 0.89(0.07) | OI - 1.1287 |
| 1.1327 | 0.05(0.05) | … | CI - 1.1333 |
| 1.1339 | 0.15(0.05) | … | CI - 1.1339 |
| 1.1641 | 0.34(0.08) | … | CI - 1.1632, 1.1651 |
| 1.1754 | 0.59(0.08) | … | CI -1.1751,1.1756, 1.1758 |
| 1.1831 | 0.37(0.08) | … | MgI - 1.1831 |
| 1.1839 | 0.55(0.08) | … | ? |
| 1.1835 | 0.84(0.08) | … | CaII - 1.1842 |
| 1.1873 | 0.27(0.08) | … | ? |
| 1.1888 | 0.84(0.08) | 0.27(0.06) | CI -1.1883 |
| 1.1954 | 0.32(0.05) | … | CaII - 1.1953 |
| 1.1978 | 1.02(0.05) | 0.83(0.06) | ? |
| 1.1992 | 0.81(0.05) | 0.20(0.06) | SiI - 1.9948 |
| 1.2035 | 0.60(0.05) | 0.35(0.06) | SiI - 1.2035 |
| 1.2086 | 0.19(0.05) | … | MgI - 1.2087 |
| 1.2111 | 0.62(0.05) | … | SiI - 1.2107 |
| 1.2275 | 0.30(0.04) | … | SiI - 1.2274 |
| 1.2542 | 0.26(0.04) | … | |
| 1.2568 | 0.36(0.04) | 0.3(0.1) | CI -1.2566 + |
| [FeII] - 1.2567 | |||
| 1.2611 | 1.93(0.04) | 1.6(0.1) | CI -1.2617 |
| 1.2640 | 0.93(0.04) | 0.8(0.1) | FeII - 1.2646 |
| 1.2675 | 0.60(0.04) | 0.5(0.1) | ? |
| 1.2701 | 1.02(0.04) | 1.0(0.1) | ? |
| 1.2784 | 1.18(0.04) | 1.2(0.2) | ? |
| 1.3176 | 0.64(0.12) | … | OI - 1.3166 |
| 1.4884 | 10.3(1.3) | … | MgI - 1.4882 |
| 1.5047 | 20.1 (0.7) | 3.5 (0.9) | MgI - 1.5044 + Br23 |
| 1.7113 | 11.1(1.8) | … | MgI - 1.7113 |
| 2.294 | 540(30) | 87(17) | CO v=2–0 |
| 2.324 | 600(30) | 110(25) | CO v=3–1 |
| 2.354 | 500(30) | … | CO v=4–2 |
| 2.324 | 390(40) | … | CO v=5–3 |
| 2.324 | 360(40) | … | CO v=6–4 |
| Fluxes | |||
| IRS 2 | IRS5a | ||
| Line | |||
| m | 10-15 erg s-1 cm-2 | ||
| 1.282 | Pa | 13.7(0.4) | |
| 1.519 | Br 20 | 1.6(0.5) | |
| 1.527 | Br 19 | 2.9(0.7) | |
| 1.534 | Br 18 | 3.7(1.1) | |
| 1.544 | Br 17 | 4.2(0.2) | |
| 1.556 | Br 16 | 4.1(0.4) | |
| 1.571 | Br 15 | 7.2(0.1) | |
| 1.588 | Br 14 | 6.0(0.7) | |
| 1.612 | Br 13 | 10.7(0.1) | |
| 1.641 | Br 12 | 9.3(0.6) | |
| 1.681 | Br 11 | 19.1(0.1) | |
| 1.737 | Br 10 | 41.5(0.9) | |
| 1.818 | Br 9 | 82.3(1.7) | |
| 2.166 | Br | 181.0(5.4) | 1.3(0.1) |
| Kinematical information | |||||
|---|---|---|---|---|---|
| IRS 2 | IRS5a | ||||
| Line | |||||
| (m) | km s-1 | km s-1 | km s-1 | km s-1 | |
| 1.6113 | Br 13 | -134 | 130 | ||
| 1.6411 | Br 12 | -114 | 146 | ||
| 2.1661 | Br | -94 | 180 | 010 | 122 |
| HH100 IR | IRS2 | ||||||
| Line | |||||||
| m | km s-1 | km s-1 | 10-17 erg s-1 cm-2 | km s-1 | km s-1 | 10-17 erg s-1 cm-2 | |
| 2.1218 | H2 | -6 | 20 | 5.4 0.3 | -6 | 20 | 3.4 1.0 |
| 2.2062 | Na I – | 5 | 142 | 32.0 0.8 | … | … | 8.8 1.5 |
| 2.2090 | Na I – | 2 | 133 | 42.0 1.5 | -11 | 117 | 19.0 0.5 |
| HH100 IR | IRS2 | |||
| FWHM | FWHM | |||
| 10-14 erg s-1 cm-2 | 10-14 erg s-1 cm-2 | |||
| 1.098 | 42.90.9 | 7.4 10-3 | 5.10.2 | 7.5 10-3 |
| 1.173 | 13.20.7 | 1.3 10-2 | 1.40.1 | 1.2 10-2 |
5 The absorption features
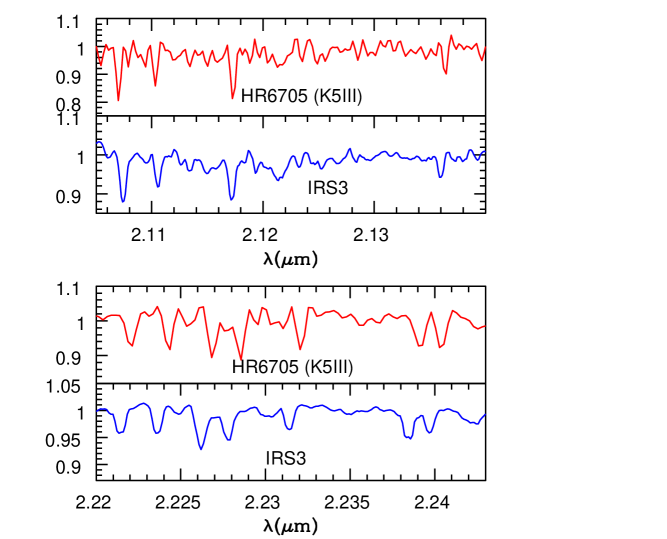
In the two K band spectral segments, the main absorption features observed are those of lines from neutral atoms like Na, Al, Fe, Mg, Ti and Si, as well as the CO 2-0 band; these are the typical features expected from the photosphere of late type (K-M) stars (e.g. Wallace & Hinkle 1996, 1997) and commonly observed in pre-main sequence sources (e.g. Luhman & Rieke 1998). In HH100 IR and IRS2 such features are detected at only 1-5% of the continuum level. In the H band spectral segment, several more features are detected, most of which are very weak. The most significant of these features are indicated in Figs. 5,6 and 7 and have been identified through the spectra of standard stars of Meyer et al. (1998) and the Kurucz atomic spectral line database 222 1995 Atomic Line Data (R.L. Kurucz and B. Bell) Kurucz CD-ROM No. 23. Cambridge, Mass.: Smithsonian Astrophysical Observatory. The absorption lines are resolved, with widths of several tens km s-1 which vary depending on the considered feature in the same objects. Such a broadening is due to different contributions, including rotation and Zeeman broadening, since these young stars are expected to be fast rotators and to have strong stellar magnetic fields. More specifically, the width of lines selected for having small Landé factors and not blended with other features are of the order of 20km s-1 in IRS3, 40km s-1 in IRS2, HH100IR and IRS6a, and 60km s-1 in IRS5a. This indicates that all the sources but IRS3 possess large values, comparable with the projected rotational velocities estimated in other flat-spectrum and Class I sources and higher than the average values measured in T Tauri stars ( 15km s-1 , Bouvier et al. 1986).
5.1 Spectral type and veiling measurement
In the assumption that the observed absorption lines originate from stellar photosphere, their equivalent width (EW) should be sensitive to the stellar effective temperature and gravity. In the sources we are considering, however, the line EWs are strongly affected by the presence of continuum excesses, which can be quantified through the veiling parameter, defined as the flux at a given wavelength in excess with respect to the photospheric flux (). The veiling is actually a parameter that we also want to derive from the data, giving us information on the circumstellar activity of the stars. The ratios of different lines close in wavelengths is not largely affected by the veiling and can thus be used for defining the spectral type. Then, the absolute value of the line EWs can be in turn compared with the intrinsic EW of spectral standard lines to estimate the IR veiling. Several diagnostic lines, mainly located in the K band, have been identified by different authors as particulary suited for spectral classification (e.g. Luhman & Rieke 1998). Among them, different features lying in the region around the Na I doublet at 2.206m are good diagnostic tools for the effective temperature, while the CO 2-0 bandhead is particularly sensitive to the gravity (e.g. Doppmann & Jaffe 2003). However, we have seen that in HH100 IR and IRS2 both the Na I doublet lines and the CO band-heads are seen in emission instead of absorption, and therefore cannot be used for spectral classification. Therefore, to derive the stellar properties of our sources, we have used different and close in wavelength diagnostic lines, mainly located in the K band. Details on the considered lines are given in Appendix A. In practice to derive the spectral type and luminosity class, we have compared the ratios of selected absorption lines observed in our sources, with the same ratios as measured in a grid of standard star spectra, selecting the standard which minimizes the scatter among the different ratios.
| Source | ST | |||
|---|---|---|---|---|
| IRS2 | K2V | 4900200 | 2.90.5 | 1.40.2 |
| IRS5a | K5-K7V | 4200200 | 1.00.1 | 0.10.1 |
| IRS6a | M2V | 3580100 | 0.10.1 | 0.10.1 |
| HH100 IR | K5-M0V | 4060300 | 6.00.5 | 3.50.2 |
| IRS3 | K5-M0 III | 3800100 | 0.20.1 | 0.10.1 |
| Source | L∗ | R∗ | M∗ | age | E(H-K) | AV | Lacc | |
|---|---|---|---|---|---|---|---|---|
| L⊙ | R⊙ | M⊙ | 106 yr | mag | L⊙ | M⊙ yr-1 | ||
| IRS2 | 4.31.5 | 2.90.6 | 1.40.3a | 0.5-1a | 1.30.2 | 203 | 7.72.5 | 3 10-7a |
| 1.8b | 2b | 2 10-7b | ||||||
| IRS5a | 1.60.5 | 2.40.4 | 0.50.1a | 0.3-0.5a | 2.90.2 | 453 | 0.4 | 3 10-8a |
| 0.9b | 1.3b | 2 10-8b | ||||||
| IRS6a | 0.50.2 | 1.50.3 | 0.30.1a | 0.5-1a | 1.90.3 | 295 | 0.1 | |
| 0.4b | 1.8b | |||||||
| HH100 IR | 3.10.9 | 3.60.7 | 0.40.1a | 0.1a | 1.90.2 | 303 | 122 | 2 10-6a |
| 0.75b | 0.6b | 1 10-6b | ||||||
| IRS3 | 0.30.1 | 1.20.1 | 0.50.1a | 1-5a | 0.20.2 | 103 | 0.1 | … |
| 0.5b | 4b |
a Masses and ages derived from the D’Antona & Mazzitelli (1997) tracks.
b Masses and ages derived from the Siess, Dufour & Forestini (2000) tracks.
A difficulty in this procedure is given by the limited number of available spectra of standard stars at a resolution similar to that adopted for our observations. For our analysis we have mainly used the Wallace & Hinkle (1997) (for K band), and Meyer et al. (1998) (for the H band) standard samples, which are however at resolution 3000, thus not always allowing to compare lines resolved in our spectra but blended in the standard stars spectra. Moreover, the Wallace & Hinkle (1997) sample lacks spectra of dwarfs stars between K5 and M2. We therefore also used the dwarfs standard star spectra obtained by Greene & Lada (2002) which have a finer grid between K4V and M2V at a resolution of about 15000, but do not enterely overlap with our observed spectral range.
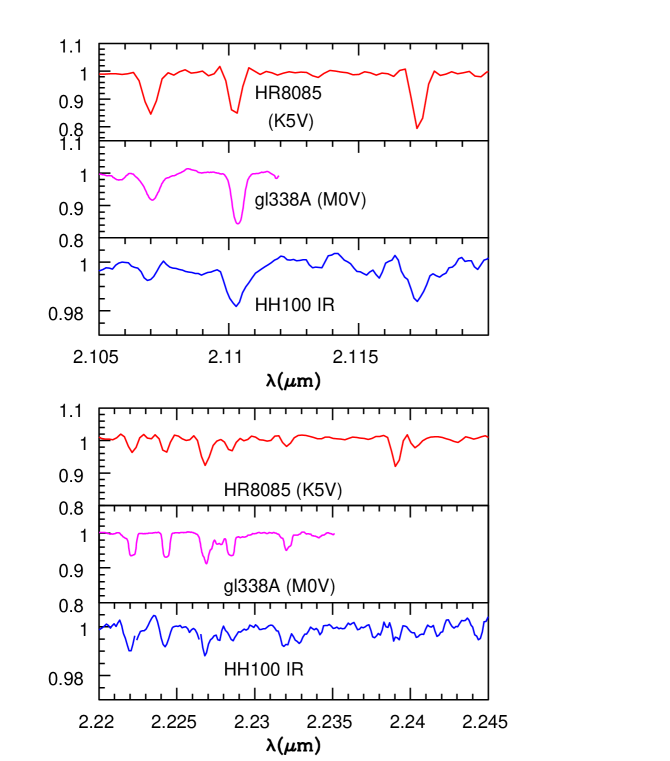
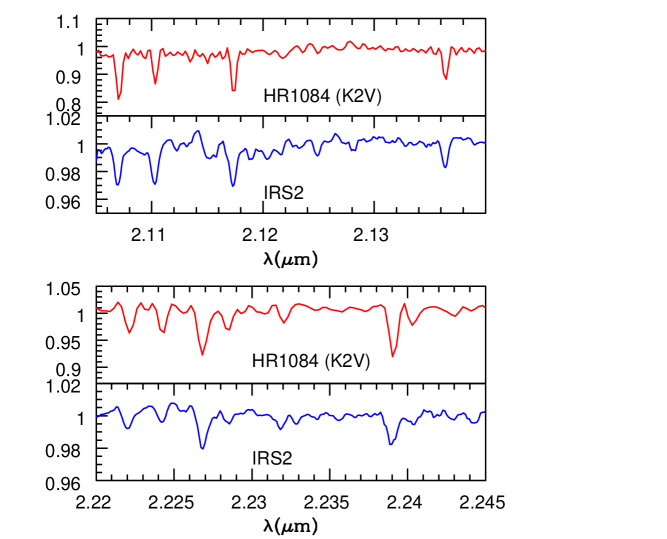
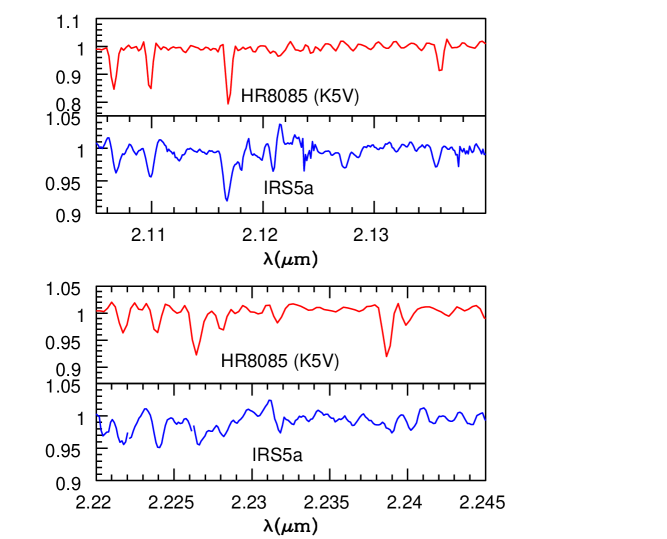
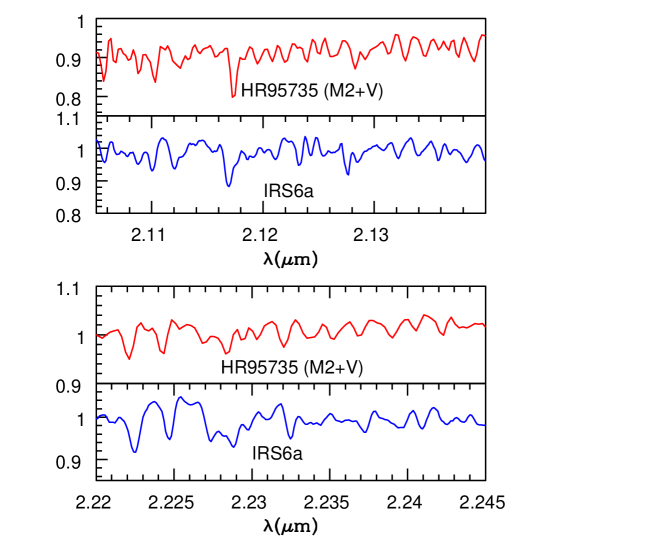
The spectral types and luminosity classes, derived for the sources of our sample using the procedure described above, are given in Table 6. The effective temperatures relative to each spectral type have been derived adopting the conversion of spectral type into given in Kenyon & Hartmann (1995). We estimate that our classification is correct inside one spectral sub-class, with the exception of HH100 IR where the paucity and weakness of the absorption features do not allow a classification better than inside two spectral sub-classes. Figs 8,9 and 10 show a comparison between the spectra of our sources and the spectra of standard stars which more closely match the observed spectra. Most of the sources are consistent with being dwarfs, as also found for other low mass YSOs (i.e. Greene & Lada 1997). The dwarf spectra shown by young stars have been recognized as an evidence for assuming that the observed features originate from the stellar photosphere more than from a circumstellar disk. Disk photospheres are indeed expected to have low gravities and thus should resemble giant or supergiants spectra (Greene & Lada 1997).
Once defined the spectral type, the measured EWs of selected lines, compared with the EWs of standard spectra of the corresponding spectral type, have been used to derive the veiling in the K and H band. For this purpose we used lines not blended at the lower resolution of the available standard spectra, and not contaminated by possible spurious atmospheric feature residuals. We also selected lines not too sensitive to the effective temperature to minimize the uncertainty on the spectral type determination and also not too sensitive to the effect of stellar magnetic fields, like the Ti lines at 2.23m whose EW can be increased by the Zeeman effect due to their high Landé factor (e.g. Johns-Krull & Valenti 2000). In practice, good lines for the veiling determination resulted to be, in addition to the Na line at 2.209m, when observed in absorption, Al at 2.1099m and Ca at 2.2658m for the K band, and Fe (1.6369m), Si(1.6386m), in the H band. For IRS5a and IRS6a we do not have the medium resolution H band spectra, but few absorption features are detected in their low resolution spectra. Among them, Mg I at 1.7112m is the most suited to evaluate the H veiling, being not affected by strong blendings even at low resolution.
The resulted veiling values are also listed in Table 6. From the table, it can be seen that, as expected, HH100 IR and IRS2 have the largest veiling values, 6 and 3 respectively. The other considered sources show lower or absent veiling values. Finally, the veiling in the H band is about a factor of two smaller than the value. These veiling determinations will be discussed in Section 7.3.
6 Stellar and circumstellar parameters
The derivation of spectral type and veiling allows us to estimate other stellar and circumstellar properties from the available K and H photometry and source bolometric luminosity. The infrared color excess can be derived from the observed color, the star color relative to the adopted spectral type and the and values:
| (1) |
| (2) |
where we have indicated with the dereddened IR color of the source. From this expression, the visual extinction has been evaluated adopting given by the standard interstellar reddening law (Rieke & Lebofsky 1985). The derived values are listed in Table 7 and range from =10 mag in IRS3 to =45 mag in IRS5a. Our derived values for HH100 IR, IRS2 and IRS5 compare rather well with the extinction derived in these sources from the optical depth of the 10m silicate and 3m water absorption features, i.e. 25-30 mag for HH100 IR, 27 mag for IRS2 and 45 mag for IRS5(a+b) (Chen & Graham 1993, Whittet et al. 1996). The low extinction value (10 mag) derived for IRS3 is consistent with values found towards field stars obscured by the R CrA cloud (Whittet et al. 1996). From the adopted spectral type and from the K magnitude dereddened by the derived value, we are now able to derive the absolute stellar K magnitude, and thus the intrinsic stellar luminosity:
| (3) |
where
| (4) |
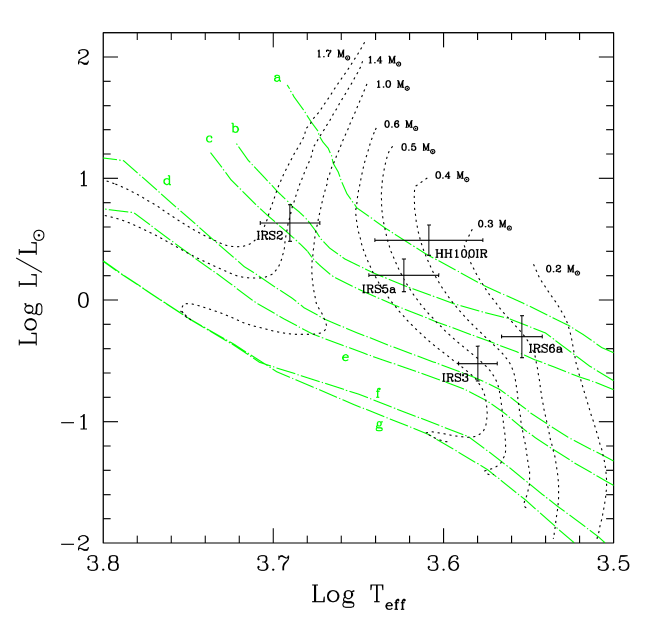
In this expression, the values for the bolometric correction BC and for the intrinsic stellar colors for dwarfs were taken from Kenyon & Hartmann (1995). Finally, the stellar radius R∗ can be also derived given the assumed stellar effective temperature. Table 7 lists the L∗ and R∗ values for the five considered sources. Luminosities range between 0.3 and 4.3 L☉, and stellar radii between 1.2 and 3.6 R☉, being therefore in the range expected for low mass young stars (e.g. Siess et al. 1997). Given the stellar luminosity and its effective temperature, the sources can be positioned in a HR diagram to have an estimate of their mass and age through the comparison with pre-main sequence evolutionary tracks. This is shown in Figure 11, where we have considered the D’Antona & Mazzitelli (1997) tracks for stars with masses between 0.1 and 2 M☉. From these tracks we derive masses between 0.3 and 1 M☉ and ages between 105 and 106 yr. In order to check for the sensitivity of different models used to derive the evolutionary tracks, we have also derived masses and ages adopting the Siess et al. (2000) models, which are listed in Table 7. These last models give slightly higher masses and ages with respect to the D’Antona & Mazzitelli tracks, with mass variations which are of about 80% at worst. The considered standard tracks do not take into account the perturbation introduced by a high mass accretion rate on the evolutionary tracks, an effect which could be not negligible for HH100 IR and IRS2. Siess et al. (1997, 1999) have computed evolutionary tracks for stars which are still accreting a substantial fraction of their mass, evaluating the error introduced in the mass and age determination by taking the values expected for standard tracks. They show that while the determination of the (current) mass is not very affected by a high accretion rate, the still accreting stars are effectively younger than the standard ones, for ages 1.5 106 yr. Thus, it is likely that HH100 IR and IRS2 are actually younger than the age of 5 105 and 106 yr, respectively, that we infer from the tracks in Fig. 11.
The knowledge of the intrinsic stellar luminosity allows us in principle to derive which is the fraction of excess luminosity due to accretion through a comparison with the source bolometric luminosity. The error on this Lacc determination is largely dominated by the precision through which the Lbol value is known. With regard to our considered sources, Lbol values estimated through near IR and IRAS photometric data are given for HH100 IR, IRS2 and for IRS5 (Wilkings 1986, 1992, see Table 1). IRS5a is brighter and its near IR specrum is steeper than IRS5b, which suggests us that the bolometric luminosity of IRS5a dominates over the binary system: we assume a ratio 2:1 to separate the value among the two components. For IRS6 and IRS3 measurements of the far IR fluxes are not available; however the fact that their IR spectra are not very steep allow us to assume that the far IR contribution at the Lbol value can be negligible. We have therefore given an estimate of the Lbol values for these sources based on their near and mid IR ground based photometry, and adding a correction which assumes that the spectrum scales as the wavelength for larger than that corresponding to the last observed photometric flux. For IRS6 we furtherly assumes that the two components a and b equally contribute at the total bolometric luminosity.
From the comparison of the derived stellar luminosity with the Lbol values, it appears that only HH100 IR and IRS2 have a significant excess in luminosity with respect to L∗, which amounts to 80 % and 65 % of the Lbol value, respectively. We attribute such an extra luminosity contribution to the energy released in the accretion process. In IRS5a, only 20 % of the total luminosity is due to accretion while in the other two sources our method does not allow us to measure any significant accretion luminosity. Finally, the mass accretion rate can be estimated from the accretion luminosity. In the hypothesis that accretion occurs through the circumstellar disk, the total disk accretion luminosity can be written as (Gullbring et al. 1998):
| (5) |
where is the inner disk truncation radius which is predicted to be of the order of 3-5. The values for HH100 IR and IRS2 are 2 10-6 and 3 10-7 M☉ yr-1, respectively. Such values are larger than the average values derived for T Tauri stars by means of UV excess measurements (Gullbring et al. 1998), but lower than the values indirectly estimated in Class 0 sources through their mass loss phenomena, indicating that an evolution in the mass accretion rate during the protostellar life is indeed very likely.
7 Discussion
The ability to separately estimate the stellar and circumstellar properties of embedded YSOs, gives the possibility to infer in a better detail the evolutionary properties of these sources, to analyse their similarities with optically visible T Tauri stars in terms of veiling and accretion activity and finally to address quantitatively how their accretion properties are connected to other related phenomena such as jets and winds.
7.1 Evolutionary stage of the observed sources
The stellar parameters, accretion luminosity and mass accretion rates derived
from the analysis of the star photospheric features can be used to assess
the relative evolutionary phase between the observed sources. We have seen
that only HH100 IR and IRS2 have a significant fraction of their
luminosity due to accretion, which is also correlated with the presence
of both extreme values for the K and H veilings and emission
line activity.
On the other hand, IRS5a, which like HH100 IR
and IRS2 has been classified as a Class I protostar on the basis of its
SED between 2 and 10m (Wilkings et al. 1997) does not show a significant
accretion activity, as testified by the low ,
the absence of emission lines and the low veiling. Presumably,
this source is a T Tauri still embedded in its parental envelope or seen through
a unfavourable line of sight.
Finally, IRS6a and IRS3 present characteristics of pure reddened
photospheres where any sign of activity connected to accretion is very low
or absent.
This analysis shows that YSOs chosen to broadly have
similar IR colors may have very different characteristics in terms
of accretion properties. This finding suggests us to make an a posteriori
look at the distribution of the IR colors of the considered
sources to search for a finer separation between stars with different
accretion properties. In particular the protostars HH100 IR
and IRS2, for which more than 50% of their luminosity is due to accretion, are located,
in a near IR color-color diagram, in a region
defined by colors (J-H)4 and (H-K)2.5. In the same region can be
also put the only other so far identified highly accreting protostar,
i.e. YLW15 of the Ophiucus cloud ((J-H)5, (H-K)=3.8, Greene & Lada 2002).
Sources with a low or absent accretion activity (IRS6 and IRS3) seem to be located
outside this box, with colors (J-H)4 and (H-K)2.5. In this scheme IRS5a
is a borderline case, which remain anomalous. We only note that the colors of
IRS5(a+b) are considerably bluer than those of the other highly accreting
protostars ((H-K)/(J-H) = 0.85
vs (H-K)/(J-H) 0.6-0.7), indicating that part of its infrared excess
can be due to scattered radiation. In conclusion we suggest that the real accreting
protostars can be located in a color-color diagram region tighter than
the previously considered locus for Class I sources (e.g. Lada &
Adams 1992), a clue which deserves to be further investigated
on a larger sample basis.
It is also interesting to note how the different accretion properties of the sources correlate with their position on the HR diagram. HH100 IR is the youngest source of the sample with an age 105 yr, while all the others fall roughly on the same isochrone at t5 105-106 yr. If taken literally, this result indicates that sources with nearly the same age may have very different / values, and thus that the age is not the only parameter regulating the end of the accretion process. In particular, it can be noticed the different estimated mass accretion rate of sources (IRS2, IRS5a and IRS6a) which appear to have a similar age but different masses, ranging from 0.5 to 1.5 M⊙. For these sources there is an evidence that the mass accretion rate increases with the mass. Since the sources belong to the same star forming core, they should have started to collapse with the same initial cloud infall rate, which depends only on the core kinetic temperature. Therefore, it is not unexpected that to accumulate a different mass in the same ellapsing time, their mass accretion rate should have followed a different time evolution. Evidences for a correlation between mass accretion and stellar masses have been indeed reported, although with a broad scatter, for large samples of T Tauri and very low mass objects (Natta et al. 2004).
On the other hand, we should also remind that some of the considered stars have a large photometric variability as it is indeed common in young embedded stars (e.g. Kaas 1999, Horrobin et al. 1997). Often variability in IR magnitudes is associated to variability of spectral features, such as HI and CO lines, whose emission is directly related to accretion (Biscaya et al. 1997, Nisini et al. 1994). Therefore, if the photometric variability of the considered sources is related to changes of the mass accretion rates on short timescales, as it happens, e.g., in FU Ori-like events, the possibility that the three sources with the same age may have a similar time averaged mass accretion rate, cannot be excluded.
7.2 Origin of veiling
The observed sources present very different values of the IR veiling. The K veiling spans from almost 0 in IRS3 and IRS6a, to a value 6 in HH100 IR. In T Tauri sources, values between 0 and 2 are normally estimated (Johns-Krull & Valenti 2001, Folha & Emerson 1999). Higher values, up to 3-4, have been measured in flat-spectrum and Class I objects (Greene & Lada 1997, Doppmann et al. 2003). We however do not find a clear correlation with the class of the objects, at least for the three Class I sources of our sample which have values of 0.5 (IRS5a), 3 (IRS2) and 6 (HH100) despite their similar spectral index between 2 and 10m. For these three sources is instead more evident the correlation with the estimated accretion luminosity. In T Tauri stars, the main considered source of IR veiling is the emission from the accretion disk, although, given the low mass accretion rates estimated in T Tauri stars, disk models find some difficulties to predict the largest observed veiling values (r 1-2) (Folha & Emerson 1999, Johns-Krull & Valenti 2001). The same models have also difficulties to reproduce the large IR veiling estimated in Class I sources, despite the mass accretion rate higher than in T Tauri stars (e.g. Greene & Lada 1996). An additional source of veiling can be the emission from the inner circumstellar dusty envelopes. Greene & Lada (2002) estimate that the inner infalling envelope can account for about half of the K veiling they measure in the Class I object YLW15. Calvet et al. (1997), estimate that the thermal emission of envelopes with mass infall rates ranging from 10-5 and 4 10-6 M☉ yr-1, can account for a 2.2m veiling ranging between 3 and 9, thus in the range of the values we find for HH100 IR and IRS2. The same models predict a H band veiling 30-50% smaller than in the K band, consistent with our derived values. Finally, the small veiling observed in IRS5a, despite its significant IR emission excess, can be explained by assuming that its envelope emission is mainly due to the scattering of the central object emission. In this case, as pointed out by Calvet et al. (1997), the envelope flux contains the same spectral features as the object and thus does not affect the line EWs. Recent models for the SEDs of YSOs (Whitney et al. 2003) show that in Class II sources seen close to edge-on, extinction and scattering dominate at near-IR wavelengths making the SEDs of these sources similar to those of less evolved Class I objects.
7.3 Correlation with accretion and ejection activity
Our observations show that HH100 IR and IRS2, which have most of their luminosity due to accretion, are also those exhibiting a rich emission line spectrum, with the strogest lines observed in the source with the highest mass accretion rate (HH100 IR).
Correlations between the accretion luminosity and the IR hydrogen lines luminosity have been found in T Tauri stars (Muzerolle et al. 1998). Such a correlation can be naturally explained if the origin of HI lines is in the star magnetospheric accretion region but also if part of their emission come from ionized outflows, which are ultimately powered by accretion. We can check if the highly accreting objects of our sample still follow the same correlation - as T Tauri stars. Extending such a correlation to highly accreting embedded objects would indeed be important to validate the Br luminosity as an indirect quantitative tool derive the accretion luminosity of Class I sources. The Br luminosity of HH100 IR and IRS2, dereddened for the extinction values listed in Table 7, are 5.7 10-3 and 7 10-4 L☉, respectively. Following the fit derived by Muzerolle et al. (1998), such line luminosities should be consistent with accretion luminosities 40 and 3 respectively. Considering the large errors associated with the Muzerolle et al. least-squares fit, our derived values are consistent with the relationship found for the T Tauri stars, extending it to about an order of magnitude larger luminosities. Br emission is observed also in IRS5a with a luminosity value 5 10-5 L☉. According to the relationship by Muzerolle et al. the corrisponding value should be a fraction of the bolometric luminosity of the order of 10-1L☉, well inside the locus of the T Tauri star and in agreement with our roughly estimated value.
It is usually assumed that accretion and ejection of matter are correlated phenomena and that this latter is needed to remove part of the angular momentum carried by the accreting material. It is therefore worthwhile to see if an high accretion luminosity is always associated with the presence of outflows. In this respect it is indicative that HH100 IR is the only source of our sample having a clear evidence of outflowing activity, being the identified exciting source of the HH100 Hebig Haro nebulosity, and also of the HH objects HH101 (located in the SW) and HH99 (in the NE) (Hartigan & Graham 1987). A molecular bipolar outflow is also associated with this object as evidenced by the ammonia and HCO+ observations of Anglada et al. (1989) and Anderson et al. (1997), respectively. IRS2, however, despite showing a large accretion luminosity value, does not show any undoubtful tracer of mass ejection. We have seen that the weak H2 2.12m line observed in emission can be due to both the outflow and the disk and no other lines typical of jets, such as [FeII] lines, are detected in the spectrum. On a larger scale no optical HH object seems to be associated to this source (Hartigan & Graham 1987). However, the region closer to IRS2 has not been investigated neither in H2 imaging, to search for molecular jets, nor in molecular outflows radio tracers, so we cannot on this basis exclude that a large scale flow is associated with this source.
8 Conclusion
We have analyzed the low and medium resolution infrared spectra of a sample of embedded young stellar objects in the R CrA star forming region with the aim of constraining their accretion properties and evolutionary stage. The sample includes three Class I sources (HH100 IR, IRS2 and IRS5) and two sources with NIR excesses in the Wilking et al. (1997) R CrA core survey (IRS6 and IRS3). The main results from this analysis are the following:
-
•
The low resolution spectra revealed the presence of strong lines in emission only in two, namely HH100 IR and IRS2, out of the six observed sources. The most prominent detected features are permitted lines from neutral atoms, mostly from HI (Pa, Br and lines from the Brackett series at higher-n) but also OI, NaI and CI. These lines arise in a partially ionized compact and very dense gas, likely originating either in the star-disk accretion region, or at the base of an expanding wind. The same sources where atomic lines are detected also present the CO 2.3m bandheads in emission, indicating the presence of large columns of warm molecular gas, probably located in the inner sections of an accretion disk. In the medium resolution spectra, also a weak H2 2.12m line is detected in HH100 IR and IRS2, which may be originated either in the circumstellar disk or in a molecular jet.
-
•
The medium resolution spectra show plenty of absorbtion features typical of late-type stellar photospheres. In HH100 IR and IRS2 such features are very weak, indicating a large amount of IR veiling. We have derived the effective temperature, extinction, stellar luminosity and radius of the observed sources, through a comparison with standard star spectra and IR photometric data. This information has been in turn used to infer the amount of IR veiling, the accretion luminosity and the mass accretion rates of the objects.
-
•
Only in HH100 IR and IRS2 the accretion luminosity dominates over the total bolometric luminosity (/0.8 and 0.6 respectively) and the derived mass accretion rates are of the order of 3 10-6 and 5 10-7 M⊙ yr-1 respectively, i.e. higher by an order of magnitude with respect to the average values derived in T Tauri stars. In contrast, in IRS5a only 2% of the luminosity is due to accretion. In general, we found that there is a correlation between the accretion luminosity, the IR veiling and the emission line activity of the sources.
-
•
If compared with standard evolutionary tracks for pre-main sequence evolution, the derived stellar luminosities and effective temperatures indicate that HH100 IR is the youngest of the sources, with an age 105 yr. On the other hand, IRS2, IRS5a and IRS6a have about the same age (5 105- 106 yr) despite the large differences in their accretion properties. For these sources there is a hint that the mass accretion rate, at a given age, may depends on the accumulated stellar mass, a result not totally unexpected if one assumes that the mass accretion rate is a function of the mass of the envelope. We cannot however exclude that variations on short timescales of the accretion rates, related to the sources infrared variability, may be responsible of the derived differences in the values.
Our analysis has shown that sources broadly defined as Class I protostars, may indeed be very different in terms of accretion activity. This indicates how the definition of the evolutionary stage of deeply embedded YSOs by means of IR colors needs to be more carefully refined. In particular, on the basis of our results we suggest that the highly accreting protostars (i.e. those for which / 50%) can be located in a color-color diagram region characterized by near IR colors (J-H)4 and (H-K)2.5, a clue which remains to be further investigated on a larger sample basis. Low resolution IR spectroscopy can give a better diagnostic about the accretion activity of young embedded sources, evidenced by the presence of emission lines, HI recombination lines and CO overtone emission in particular. However, we have shown that the combination of low and high resolution spectroscopy may be effective in constraining both the stellar and circumstellar properties of even highly veiled objects, allowing to directly derive the accretion luminosity and mass accretion rates back to the first 10-5 yr of protostellar evolution.
Appendix A IR features selected for spectral classification
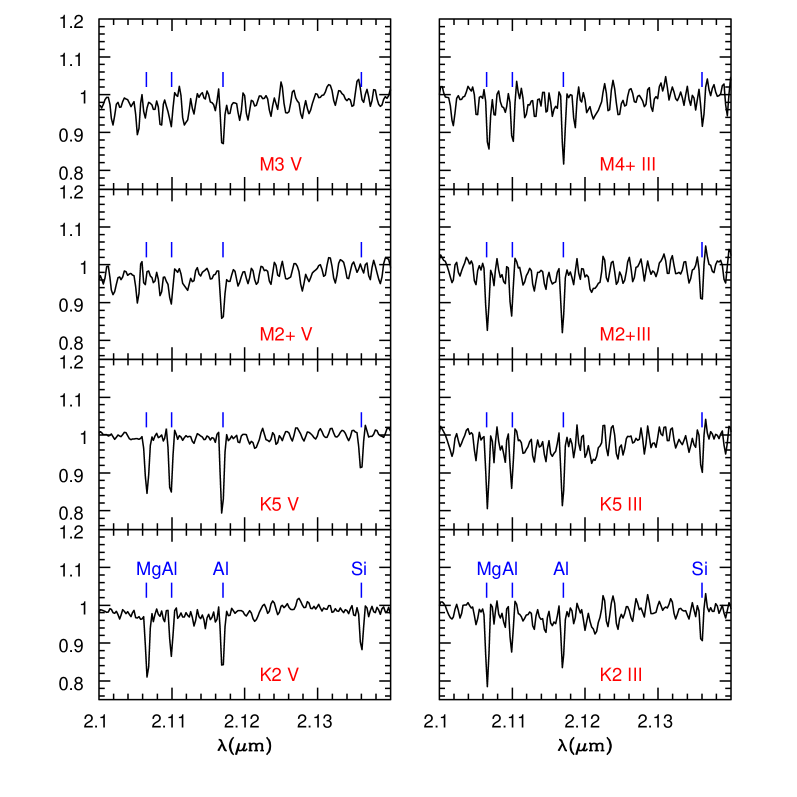
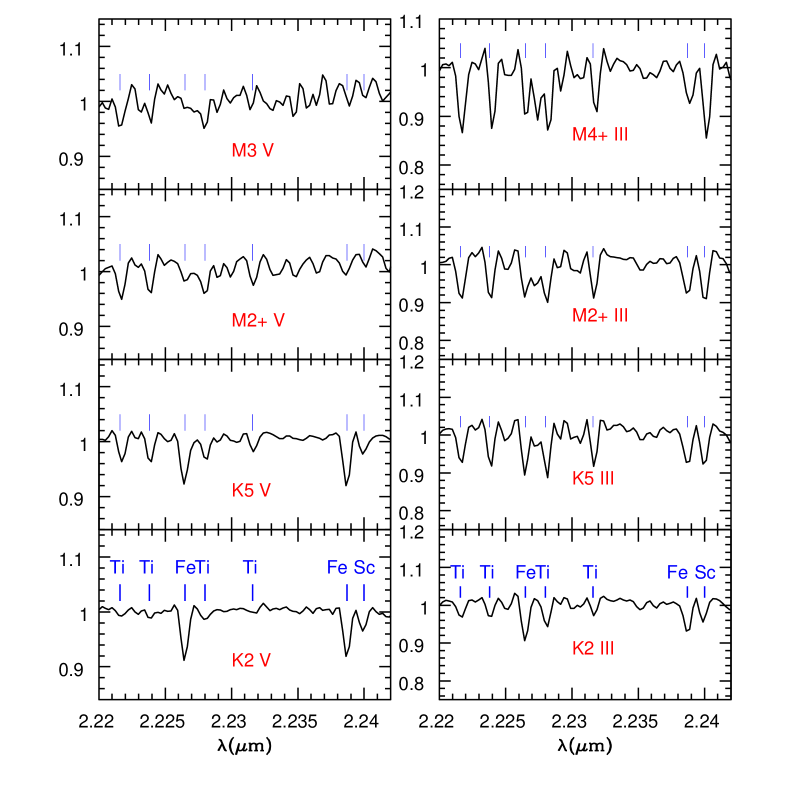
In the observed region of the K band we have identified two spectral segments, around 2.12 and 2.23m, where several features can be adopted for spectral classification. This can be seen in Figs 12 and 13, where standard spectra of K and M spectral types, taken from the Wallace & Hinkle (1997) catalogue, are plotted. In the spectra of dwarfs, around 2.12m Si at 2.1360 mand Mg at 2.1066 m weaken going from early K to M types and hence their ratios with respect to the Al lines (2.1099, 2.1169m), whose EWs remain fairly constant, are sensitive to the effective temperature.
However, in the giant spectra such ratios are less sensitive to the effective temperature, and therefore a K5V star can be easily confused with a M2III photosphere. In order to distinguish also the spectral class, we can use other lines around 2.23m. For example the ratios Ti(2.2217, 2.2240 m)/Fe(2.2266 m) and Sc(2.2401m)/Fe(2.2386m) significantly change between dwarfs and giants in K stars (Fig. 13).
For the determination of the spectral type and luminosity class in our source sample we mainly adopted the above EW ratios in the K band, and checked a posteriori that the other observed features were well reproduced. The use of the features observed in the medium resolution H band spectral segment for the spectral type determination is limited due to the strong blending affecting most of the lines, and owing to the fact that the strongest and less blended lines, like Fe I at 1.637m and Si I at 1.639m, are not very sensitive to the effective temperature. On the other hand, this fact makes them very useful to determine the value of the veiling in the H band once the source spectral type have been derived from the K band features analysis.
Acknowledgements.
We thank Tom Greene for having kindly provided his NIRSPEC spectra of standards. We also thank Livia Origlia for useful discussions on spectral classification and Tom Geballe for helpful comments on the unidentified features. This research has made use of NASA’s Astrophysics Data System Bibliographic Services and the SIMBAD database, operated at CDS, Strasbourg, France.References
- (1) Alexander, R.D., Casali, M.M., André, P., Persi, P., Eiroa, C. 2003, A&A, 401, 613
- (2) Anderson, I.M., Harju, J., Knee, L.B.G., Haikala, L.K. 1997, A&A, 321, 575
- (3) Anglada, G., Rodriguez, L.F., Torrelles, J.M. et al. 1989, ApJ, 341, 208
- (4) Bacciotti, F., Mundt, R., Ray, T.P., Eislöffel, J., Solf, J., Camezind, M. 2000, ApJ, 537, L49
- (5) Bary, J. S., Weintraub, D.A., Kastner, J.H. 2003, ApJ, 586, 1136
- (6) Basri, G. & Bertout, C. 1989, ApJ, 341, 340
- (7) Biscaya, A.M., Rieke, G.H., Narayanan, G., Luhman, K.L. & Young, E.T. 1997, ApJ, 491, 359
- (8) Bontemps, S., André, P., Terebey, S., Cabrit, S. 1996, A&A, 311, 858
- (9) Bouvier, J., Bertout, C., Benz, W., Mayor, M. 1986, A&A, 154,110
- (10) Burton, M 1992, PASAu, 10, 52
- (11) Brooke, T.Y., Sellgren, K., Geballe, T.R. 1999, ApJ, 517, 883
- (12) Calvet, N., Basri, G., Kuhi, L.V. 1984, ApJ, 277, 725
- (13) Calvet, N., Hartmann L., Strom S.E. 1997, ApJ, 481, 912
- (14) Chen, W.P. & Graham, J.A. 1993, ApJ, 409, 319
- (15) D’Antona, F. & Mazzitelli, I. 1997, in “Cool stars in Clusters and Associations”, eds. G. Micela and R. Pallavicini, Mem. S.A.It., 68, 807
- (16) Davis, C.J., Ray, T.P., Desroches, L. & Aspin, C. 2001, MNRAS, 326, 524
- (17) Davis, C.J., Stern, L., Ray, T.P., Chrysostomou, A. 2002, A&A, 382, 1021
- (18) Doppman, G.W. & Jaffe, D.T. 2003, AJ, 126, 3030
- (19) Doppman, G.W., Jaffe, D.T. & White, R.J. 2003, AJ, 126, 3043
- (20) Escalante, V. & Victor, G.A. 1990, ApJS, 73, 513
- (21) Fohla, D.F.M. & Emerson, J.P. 1999, A&A, 352, 517
- (22) Gordon, K.D., Witt, A.N., Rudy, R.J. et al. 2000, ApJ, 544, 859
- (23) Greene, T.P. & Lada, C.J. 1996, ApJ, 112, 2184
- (24) Greene, T.P. & Lada C. J. 1997, AJ 114, 2157
- (25) Greene, T.P. & Lada C. J. 2002, AJ, 124, 2185
- (26) Gullbring, E., Hartmann, L., Briceño, C., Calvet, N. 1998, ApJ, 492, 323
- (27) Joblin, C., Maillard, J.P., d’Hendecourt, L., Leger, A. 1990, Nature, 346, 729
- (28) Johns-Krull, C.M. & Valenti, J.A. 2000, ApJ, 539, 815
- (29) Johns-Krull, C.M. & Valenti, J.A. 2001, ApJ, 561, 1060
- (30) Kaas, A.A. 1999, ApJ, 118, 558
- (31) Kelly, D.M., Rieke, G.H. & Campbell, B. 1994, ApJ, 425, 231
- (32) Kenyon, S.J. & Hartmann , L. 1995, ApJS, 101, 117
- (33) Hamann, F., DePoy, D.L., Johansson, S., Elias, J. 1994, ApJ, 422, 626
- (34) Hartmann, L., Calvet, N., Avrett, E.H. & Loeser, R. 1990, ApJ, 349, 168
- (35) Hartmann, l., Calvet, N., Gullbring, E., D’Alessio, P. 1998, ApJ, 495, 385
- (36) Hartigan, P.& Graham, J.A. 1987, AJ, 93, 913
- (37) Horrobin, M.J., Casali, M.M. & Eiroa, C. 1997, A&A, 320, L41
- (38) Lada, C.J. & Adams, F.C. 1992, ApJ, 393, 278
- (39) Luhman, K.L. & Rieke, G.H. 1998, ApJ, 497, 354
- (40) Marraco, H.G. & Rydgren, A.E. 1981, AJ, 86, 62
- (41) Meyer, M.R., Edwards, S., Hinkle, K.H., Strom, S.E. 1998, ApJ, 508, 1998
- (42) Molinari, S., Liseau, R., Lorenzetti, D. 1993, A&AS, 101,59
- (43) Muzerolle J., Hartmann L., Calvet N. 1998, ApJ, 116, 2965
- (44) Najita, J. Carr, J.S., Tokunaga, A.T. 1996, ApJ, 462, 919
- (45) Natta, A., Testi, L., Muzerolle, J., Randich, S., Comeron, F., Persi, P. 2004, A&A in press
- (46) Nisini, B., Antoniucci, S., Giannini, T. 2004, A&A, 421, 187
- (47) Nisini, B., Smith, H.A., Fischer, J., Geballe, T.R. 1994, A&A, 290, 463
- (48) Pontoppidan, K.M., Fraser, H.J., Dartois, E. et al. 2003, A&A, 408, 981
- (49) Rieke, G.H. & Lebofsky, M.J. 1985, ApJ, 288, 618
- (50) Siess, L., Forestini, M., Bertout, C. 1997, A&A, 326, 1001
- (51) Siess, L., Forestini, M., Bertout, C. 1999, A&A, 342, 480
- (52) Siess, L., Dufour E. & Forestini M. 2000, A&A 358, 593
- (53) Taylor, K.N.R. & Storey, J.W.V. 1984, MNRAS, 209, 5P
- (54) Wallace, L. & Hinkle, K. 1996, ApJS, 107, 312
- (55) Wallace, L. & Hinkle, K. 1997, ApJS, 111, 445
- (56) Whitney, B.A., Wood, K., Bjorkman, J.E., Cohen, M. 2003, ApJ, 598, 1079
- (57) Wilking, B.A., Taylor, K.N.R., Storey, J.W.V. 1986, AJ, 92, 103
- (58) Wilking, B.A., Greene, T.P., Lada, C.J., Meyer, M.R., Young, E.T. 1992, ApJ, 397, 520
- (59) Wilking, B.A., McCaughrean, M.J., Burton, M.G., Giblin, T., Rayner, J.T., Zinnecker, H. 1997, AJ, 114, 2029
- (60) Whittet, D.C.B., Smith, R.G., Adamson, A.J. et al. 1996, ApJ, 458, 363
- (61) Walmsely C.M., Natta, A., Oliva, E., Testi, L. 2000, A&A, 364, 301