1–10
A-Stars and the Virtual Observatory
Abstract
The Virtual Observatory (VO) will revolutionise the way we do Astronomy, by allowing easy access to all astronomical data and by making the handling and analysis of datasets at various locations across the globe much simpler and faster. I report here on the need for the VO and its status in Europe, including the first ever VO-based astronomical paper, and then give two specific applications of VO tools to open problems of A-stars research.
keywords:
Methods: miscellaneous, techniques: miscellaneous, astronomical data bases: miscellaneous, stars: general, stars: chemically peculiar, Galaxy: open clusters and associations: general, X-rays: stars1 Astronomy in the XXI century
Astronomy is facing the need for radical changes. When dealing with surveys of up to sources, one could apply for telescope time and obtain an optical spectrum for each one of them to identify the whole sample. Nowadays, we have to deal with huge surveys (e.g., the Sloan Digital Sky Survey [SDSS; [Abazajian et al. 2004]], the Two Micron All Sky Survey [2MASS; [Cutri et al. 2003]], the Massive Compact Halo Object [MACHO; e.g., [Alcock et al. 2001]] survey), reaching (and surpassing) the 100 million objects. Even at, say, 3,000 spectra at night, which is only feasible with the most efficient multi-object spectrographs and for relatively bright sources, such surveys would require more than 100 years to be completely identified, a time which is clearly much longer than the life span of the average astronomer! But even taking a spectrum might not be enough to classify an object. We are in fact reaching fainter and fainter sources, routinely beyond the typical identification limits of the largest telescopes available (approximately 25 magnitude for 2 - 4 hour exposures), which makes “classical” identification problematic. These very large surveys are also producing a huge amount of data: it would take about two months to download at 1 Mbytes/s (an extremely good rate for most astronomical institutions) the Data Release 2 (DR2; http://www.sdss.org/dr2/) SDSS images, about two weeks for the catalogues. The images would fill up 1,000 DVDs ( 500 if using dual-layer technology). And the final SDSS will be about three times as large as the DR2. These data, once downloaded, need also to be analysed, which requires tools which may not be available locally and, given the complexity of astronomical data, are different for different energy ranges. Moreover, the breathtaking capabilities and ultra-high efficiency of new ground- and space-based observatories have led to a “data explosion”, with astronomers world-wide accumulating Terabyte of data per night. For example, the European Southern Observatory (ESO)/Space Telescope European Coordinating Facility (ST-ECF) archive is predicted to increase its size by two orders of magnitude in the next eight years or so, reaching Terabytes. Finally, one would like to be able to use all of these data, including multi-million-object catalogues, by putting this huge amount of information together in a coherent and relatively simple way, something which is impossible at present.
All these hard, unescapable facts call for innovative solutions. For example, the observing efficiency can be increased by a clever pre-selection of the targets, which will require some “data-mining” to characterise the sources’ properties before hand, so that less time is “wasted” on sources which are not of the type under investigation. One can expand this concept even further and provide a “statistical” identification of astronomical sources by using all the available, multi-wavelength information without the need for a spectrum. The data-download problem can be solved by doing the analysis where the data reside. And finally, easy and clever access to all astronomical data worldwide would certainly help in dealing with the data explosion and would allow astronomers to take advantage of it in the best of ways.
2 The Virtual Observatory
The name of the solution is the Virtual Observatory (VO). The VO is an innovative, evolving system, which will allow users to interrogate multiple data centres in a seamless and transparent way, to utilise at best astronomical data. Within the VO, data analysis tools and models, appropriate to deal also with large data volumes, will be made more accessible. New science will be enabled, by moving Astronomy beyond “classical” identification with the characterisation of the properties of very faint sources by using all the available information. All this will require good communication, that is the adoption of common standards and protocols between data providers, tool users and developers. This is being defined now using new international standards for data access and mining protocols under the auspices of the recently formed International Virtual Observatory Alliance (IVOA: http://ivoa.net), a global collaboration of the world’s astronomical communities.
One could think that the VO will only be useful to astronomers who deal with colossal surveys, huge teams and Terabytes of data! That is not the case, for the following reason. The World Wide Web is equivalent to having all the documents of the world inside one’s computer, as they are all reachable with a click of a mouse. Similarly, the VO will be like having all the astronomical data of the world inside one’s desktop. That will clearly benefit not only professional astronomers but also anybody interested in having a closer look at astronomical data. Consider the following example: imagine one wants to find all high-resolution spectra of A-type stars available in all astronomical archives in a given wavelength range. One also needs to know which ones are in raw or processed format, one wants to retrieve them and, if raw, one wants also to have access to the tools to reduce them on-the-fly. At present, this is extremely time consuming, if at all possible, and would require, even to simply find out what is available, the use a variety of search interfaces, all different from one another and located at different sites. The VO will make it possible very easily.
3 The VO in Europe: the Astrophysical Virtual Observatory
The status of the VO in Europe is very good. In addition to seven current national VO projects, the European funded collaborative Astrophysical Virtual Observatory initiative (AVO: http://www.euro-vo.org) is creating the foundations of a regional scale infrastructure by conducting a research and demonstration programme on the VO scientific requirements and necessary technologies. The AVO has been jointly funded by the European Commission (under the Fifth Framework Programme [FP5]) with six European organisations participating in a three year Phase-A work programme. The partner organisations are ESO in Munich, the European Space Agency, AstroGrid (funded by PPARC as part of the United Kingdom’s E-Science programme), the CNRS-supported Centre de Donnees Astronomiques de Strasbourg (CDS) and TERAPIX astronomical data centre at the Institut d’Astrophysique in Paris, the University Louis Pasteur in Strasbourg, and the Jodrell Bank Observatory of the Victoria University of Manchester. The AVO is the definition and study phase leading towards the Euro-VO - the development and deployment of a fully fledged operational VO for the European astronomical research community. A Science Working Group was also established two years ago to provide scientific advice to the project.
The AVO project is driven by its strategy of regular scientific demonstrations of VO technology, held on an annual basis in coordination with the IVOA. For this purpose progressively more complex AVO demonstrators are being constructed. The current one, a downloadable Java application, is an evolution of Aladin, developed at CDS, and has become a set of various software components, provided by AVO and international partners, which allows relatively easy access to remote data sets, manipulation of image and catalogue data, and remote calculations in a fashion similar to remote computing.
4 Doing Science with the AVO
The AVO held its second demonstration, ’AVO 1st Science’, on January 27 - 28, 2004 at ESO. The demonstration was truly multi-wavelength, using heterogeneous and complex data covering the whole electromagnetic spectrum. These included: MERLIN, VLA (radio), ISO [spectra and images] and 2MASS (infrared), USNO, ESO 2.2m/WFI and VLT/FORS [spectra], and HST/ACS (optical), XMM and Chandra (X-ray) data and catalogues. Two cases were dealt with: an extragalactic case on obscured quasars, centred around the Great Observatories Origin Deep Survey (GOODS) public data, and a Galactic scenario on the classification of young stellar objects.
The extragalactic case was so successful that it turned into the first published science result fully enabled via end-to-end use of VO tools and systems, the discovery of high-power, supermassive black holes in the centres of apparently normal looking galaxies ([Padovani et al. (2004), Padovani et al. 2004]). The AVO prototype made it much easier to classify the sources we were interested in and to identify the previously known ones, as we could easily integrate all available information from images, spectra, and catalogues at once. This is proof that VO tools have evolved beyond the demonstration level to become respectable research tools, as the VO is already enabling astronomers to reach into new areas of parameter space with relatively little effort.
5 The VO and A-type stars
I have used the AVO prototype to tackle two problems of A-stars research, namely, establishing membership to an open cluster and assessing if chemically peculiar A-type stars are more likely to be X-ray emitters than normal A-type stars.
5.1 Open cluster membership
Cluster membership is vital to determine the distance, and therefore absolute magnitude, and age of A-type stars, as discussed by Richard Monier ([2004]) and Stefano Bagnulo ([2004]) at this conference. In short, open clusters play a crucial role in stellar astronomy because, as a consequence of the stars having a common age, they provide excellent natural laboratories to test theoretical stellar models. The AVO prototype can be of help in determining if a star does belong to an open cluster, at various levels.
I have chosen the Pleiades as the target, since even extragalactic astronomers like me know about it (although the value of its parallax is strongly debated: see, e.g., [Pan, Shao, & Kulkarni 2004])! I will also use this example to describe the capabilities of the tool. A step-by-step guide which should allow anyone to reproduce what I have done here with the AVO prototype can be found at http://www.eso.org/ppadovan/vo.html.
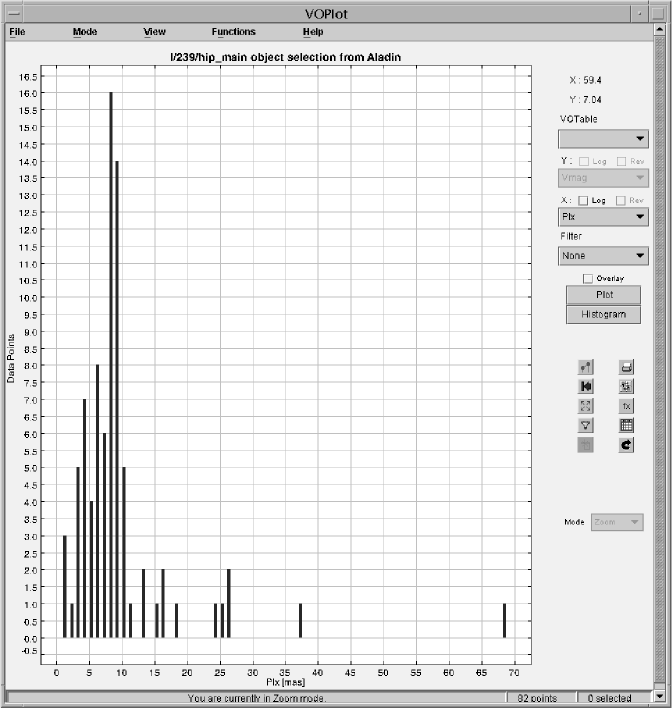
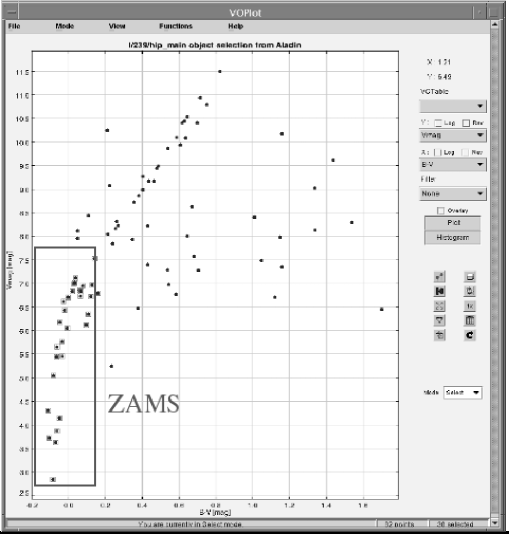
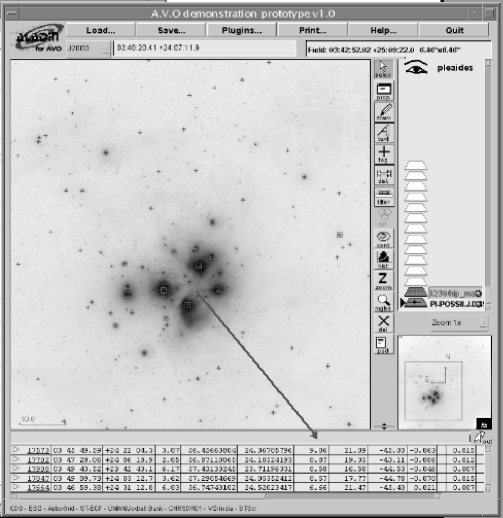
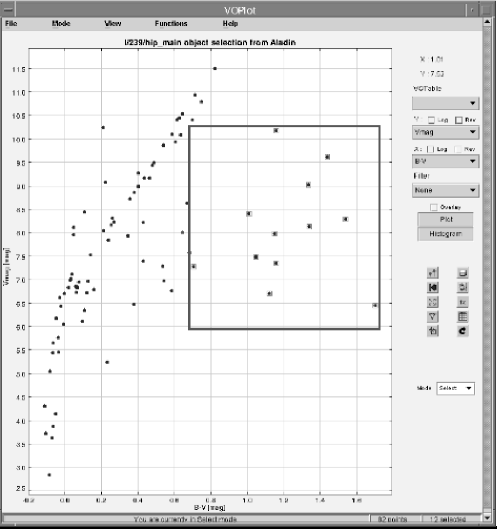
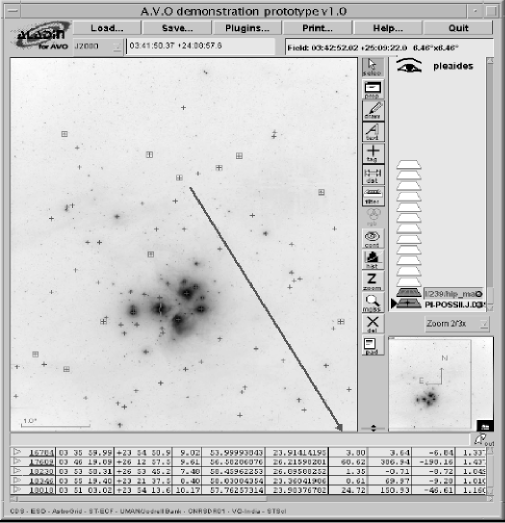
We start by loading a Second Palomar Observatory Sky Survey (POSS II) image of the Pleiades. Since we are interested in cluster membership, we need distance information. The AVO prototype has a direct link to VizieR (http://vizier.u-strasbg.fr/), a service which provides access to the most complete library of published astronomical catalogues and data tables available on-line. We then search for all VizieR catalogues which provide parallax information and find the Hipparcos catalogue ([Perryman 1997]), which we load into the prototype. All Hipparcos sources are automatically overlaid on the POSS II image. We can now very easily plot an histogram of the Hipparcos parallaxes by using VOPlot, the graphical plug-in of the prototype. Most stars in the image have parallaxes mas, consistent with the cluster value of mas ([Robichon et al. (1999), Robichon et al. 1999]), but there are also many foreground and some background stars (Fig. 1). We now want to plot a colour – magnitude diagram but first we need to correct for reddening (which is 0.04 for this cluster) the observed colour given in the Hipparcos catalogue. We then create a new column, , and then plot the observed vs. . The Zero Age Mean Sequence (ZAMS), flipped because we are using observed and not absolute magnitudes, is clearly visible (Fig. 2, top). We can now have a very nice, visual match between ZAMS and cluster membership. By selecting in VOPlot bright stars which are on the ZAMS (top of Fig. 2, bottom left corner), the corresponding sources are highlighted in the image. These are mostly in the centre of the cluster. By selecting them with the cursor one can see that most of them have parallaxes mas, as expected (Fig. 2). On the other hand, if we now select in VOPlot the sources off the ZAMS, in the POSS II image one can see that they are mostly at the edge of the field and, looking at their parallaxes, generally foreground sources, with a couple of background ones and only a few possible members (Fig. 3).
At this point one could do things properly, that is use the Hipparcos data and the mean radial velocity of the cluster centre, together with eq. (1) of [Robichon et al. (1999)], to add new columns with the relevant parameters to the Hipparcos catalogue, and determine membership based on a statistical criterion. At present, this would be quite cumbersome, although still possible. Very soon, however, one will be able to add such functionality to the VO as a “Web Service”. Web Services will promote growth of the VO in the way that web pages grew the World Wide Web. For example, a tool to determine cluster membership could be “published” to the VO as a service to which astronomers can send their input, in an appropriate format, and then receive the output, e.g., a list of cluster members and non-members.
Using the AVO prototype, one can also look for data available for selected sources at various mission archives. For example, in our case one could select some sources in the image and then select ESO, the Hubble Space Telescope (HST), and the International Ultraviolet Explorer (IUE) under “Missions in VizieR”. The pointings for these three missions for the sources under examination would then be overlaid in the image. Selecting one of these pointings provides, in some cases (e.g., HST and IUE), links to preview images, so that one can have a “quick look” at the archival data. By clicking on the HST “Dataset” column the default Web browser starts up and the dataset page at the Multimission Archive at STScI (MAST) is made available. From there one can have access to all papers published using those data. So from the AVO prototype one is only two “clicks” away from the journal articles which have used the MAST data of the astronomical sources in the image!
To get a flavour of the wealth of archival data available for A-type stars, I have also cross-correlated the Sky2000 catalogue with the MAST holdings using the service available at http://archive.stsci.edu/search/sky2000.html. Out of A-type stars, it turns out that 754 have IUE data, for a total of 10,000 observations, while 128 have non-IUE data (FOS, GHRS, STIS, FUSE, EUVE, Copernicus, HUT, WUPPE, and BEFS; see the MAST site at http://archive.stsci.edu/ for details on all of these missions), for a total of 1,700 observations, of which are spectra. How many more data are available in the other astronomical archives? Only the VO will allow us to answer that question in a relatively simple way.
5.2 Peculiar A stars in the X-ray band
The issue of the X-ray emission of A-type stars is a long standing one (see, e.g, [Simon, Drake, & Kim (1995), Simon, Drake, & Kim 1995]). While it is clear that these objects can be X-ray sources, it has been suggested that their X-ray emission is not associated with the star itself but might come from a binary companion. [Damiani et al. (2003)] have analyzed Chandra observations of the young open cluster NGC 2516 and detected only twelve A stars, out of 58, while six out of eight of the chemically peculiar (CP) A-stars were detected (a difference significant at the level). It has then been suggested, also on the basis of previous results (e.g., [Dachs & Hummel 1996]), that CP A-type stars are more easily detected in the X-rays than normal A stars, although the astrophysical implications of this result would not be straightforward. The AVO prototype provides a relatively simple way to address directly and with sound statistics the following question: “Are CP A-type stars more likely to be X-ray emitters than normal A-type stars?”.
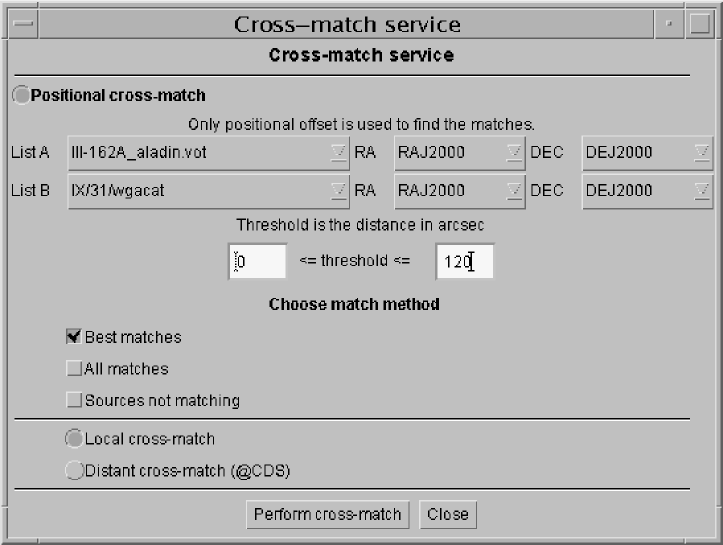
I first started by loading from VizieR the [Renson, Gerbaldi & Catalano (1991)] catalogue of CP stars, which include 6,684 sources, into the prototype. I then proceeded to select the 4,736 A-type stars by using the “Filter” option. As comparison samples I used the Henry Draper (HD) and SAO star catalogues, which contain 272,150 and 258,944 sources, out of which I selected the 72,154 and 47,230 A-stars respectively. I then loaded WGACAT ([White, Giommi, & Angelini (1995), White, Giommi, & Angelini 1995]), a catalogue of all ROSAT Position Sensitive Proportional Counter (PSPC) observations, covering approximately 10% of the sky and including about 92,000 serendipitous sources (excluding the targets, which could bias the result). The results of the cross-correlations, done using the cross-match plug-in (Fig. 4), are as follows (all errors are and spurious sources have been subtracted off by doing the match with a shift of 1 degree in the coordinates):
-
1.
CP A-stars with WGACAT: 74/4736 matches, i.e., ;
-
2.
HD A-stars with WGACAT: 368/72154, i.e., ; correcting statistically for CP stars contamination, assumed to be at the level (e.g., [Monin, Fabrika, & Valyavin (2002), Monin, Fabrika, & Valyavin 2002]), one gets ;
-
3.
SAO A-stars with WGACAT: 327/47230, i.e., ; correcting statistically for CP stars contamination, one gets .
Therefore, one can conclude that CP A-stars are 3 (SAO) to 4 (HD) times more likely to be X-ray sources than normal A-type stars with very high significance. Selecting only the magnetic stars in [Renson, Gerbaldi & Catalano (1991)], which can be identified has having Sr, Cr, Eu, Si, He, Ti, and Ca classification peculiarities (e.g., [Landstreet 1992]), one finds 22/1433 matches, that is a detection rate, not significantly different from that of all CP A-stars. It then appears that the presence of a magnetic field does not play a role in triggering X-ray emission, a somewhat puzzling result which deserves further investigation.
A related issue is that of radio emission. The strong fields present in the magnetic subclass of CP stars (see above), in fact, should give rise to radio emission, for example via the gyrosynchrotron mechanism ([Trigilio et al. 2004]). I have then cross-correlated the A-type stars in the [Renson, Gerbaldi & Catalano (1991)] catalogue with two large-area radio catalogues, namely the NRAO-VLA Sky Survey (NVSS; [Condon et al. 1998]), which covers the sky north of down to mJy at 1.4 GHz, and the Faint Images of the Radio Sky at Twenty-centimeters (FIRST; [White et al. 1997]), which covers of the sky, mostly in the north Galactic cap, down to mJy 1.4 GHz. I found no matches. In retrospect, this is not surprising as the few CP stars detected so far have radio fluxes mJy (e.g., [Drake et al. 1987]).
6 Conclusions
The main conclusions are as follows:
-
1.
We need to change the way we do Astronomy if we want to take advantage of the huge amount of data we are being flooded with. The way to do that is through the Virtual Observatory.
-
2.
The Virtual Observatory will make the handling and analysis of astronomical data and tools located around the world much easier, enabling also new science.
-
3.
Everybody will benefit, including A-type star researchers!
-
4.
Virtual Observatory tools are available now to facilitate astronomical research and, as I have shown, can also be applied to A-stars.
Visit http://www.euro-vo.org/twiki/bin/view/Avo/SwgDownload to download the AVO prototype. I encourage astronomers to download the prototype, test it, and use it for their own research. For any problems with the installation and any requests, questions, feedback, and comments you might have please contact the AVO team at twiki@euro-vo.org. (Please note that this is still a prototype: although some components are pretty robust some others are not.)
Acknowledgements.
I would like to thank the organizers of the conference for their kind invitation, which has allowed an extragalactic astronomer like me to learn about stars! I am also grateful to Stefano Bagnulo for his help in preparing my talk and to Mark Allen for reading this paper. I have made extensive use of the CDS VizieR catalogue tool, SIMBAD and the Aladin sky atlas service. The Astrophysical Virtual Observatory was selected for funding by the Fifth Framework Programme of the European Community for research, technological development and demonstration activities, under contract HPRI-CT-2001-50030.References
- [Abazajian et al. 2004] Abazajian, K. et al. 2004, AJ 128, 502
- [Alcock et al. 2001] Alcock, C. et al. 2001, ApJS 136, 439
- [2004] Bagnulo, S. 2004, These proceedings
- [Condon et al. 1998] Condon, J.J., Cotton, W.D., Greisen, E.W., Yin, Q.F., Perley, R.A., Taylor, G.B. & Broderick, J.J. 1998, AJ 115, 169
- [Cutri et al. 2003] Cutri, R. M. et al. 2003, Explanatory Supplement to the 2MASS Second Incremental Data Release available at http://www.ipac.caltech.edu/2mass/releases/allsky/doc/explsup.html
- [Dachs & Hummel 1996] Dachs, J. & Hummel, W. 1996, A&A 312, 818
- [Damiani et al. (2003)] Damiani, F., Flaccomio, E., Micela, G., Sciortino, S., Harnden, F.R., Murray, S.S., Wolk, S.J. & Jeffries, R.D. 2003, ApJ 588, 1009
- [Drake et al. 1987] Drake, S.A., Abbott, D.C., Bastian, T.S., Bieging, J.H., Churchwell, E., Dulk, G. & Linsky, J.L. 1987, ApJ 322, 902
- [Landstreet 1992] Landstreet, J.D. 1992, A&AR 4, 35
- [2004] Monier, R. & Richard, O. 2004, These proceedings
- [Monin, Fabrika, & Valyavin (2002)] Monin, D.N., Fabrika, S.N. & Valyavin, G.G. 2002, A&A 396, 131
- [Padovani et al. (2004)] Padovani, P., Allen, M.G., Rosati, P. & Walton, N.A. 2004, A&A in press (astro-ph/0406056)
- [Pan, Shao, & Kulkarni 2004] Pan, X., Shao, M., & Kulkarni, S.R. 2004, Nature 427, 326
- [Perryman 1997] Perryman, M. A. C. 1997, The Hipparcos and Tycho Catalogues, ESA SP-1200 (Noordwijk: ESA)
- [Renson, Gerbaldi & Catalano (1991)] Renson, P., Gerbaldi, M. & Catalano, F.A. 1991, A&AS 89, 429
- [Robichon et al. (1999)] Robichon, N., Arenou, F., Mermilliod, J.-C. & Turon, C. 1999, A&A 345, 471
- [Simon, Drake, & Kim (1995)] Simon, T., Drake, S.A. & Kim, P.D. 1995, PASP 107, 1034
- [Trigilio et al. 2004] Trigilio, C., Leto, P., Umana, G., Leone, F. & Buemi, C.S. 2004, A&A 418, 593
- [White, Giommi, & Angelini (1995)] White, N.E., Giommi, P. & Angelini, L. 1995, on-line database at http://wgacat.gsfc.nasa.gov
- [White et al. 1997] White, R.L., Becker, R.H., Helfand, D.J. & Gregg, M.D. 1997, ApJ 475, 479
SkodaHow will you manage copyright rules, that is, who should one cite in research done using the VO?
PadovaniThe original data providers, as far as the data are concerned, and any relevant VO project for the tools.
SkodaWhat if I ask for some data (e.g., spectra of a particular star) which are still under proprietary period? Will I be informed about this?
PadovaniYes. You will be told that the data are present but still proprietary. You will also be told when you can access them and perhaps even reminded when they become available. But remember that the VO is still not fully operational so at present you simply cannot access the data.
KubátHow do you control the quality of the data in catalogues?
PadovaniThat is a very important point but the VO cannot do that, as it would require a lot of resources. Data quality control will be up to those who know the data best, that is the data providers.