The gas temperature in the surface layers of protoplanetary disks
Abstract
Models for the structure of protoplanetary disks have so far been based on the assumption that the gas and the dust temperature are equal. The gas temperature, an essential ingredient in the equations of hydrostatic equilibrium of the disk, is then determined from a continuum radiative transfer calculation, in which the continuum opacity is provided by the dust. It has been long debated whether this assumption still holds in the surface layers of the disk, where the dust infrared emission features are produced. In this paper we compute the temperature of the gas in the surface layers of the disk in a self-consistent manner. The gas temperature is determined from a heating-cooling balance equation in which processes such as photoelectric heating, dissociative heating, dust-gas thermal heat exchange and line cooling are included. The abundances of the dominant cooling species such as CO, C, C+ and O are determined from a chemical network based on the atomic species H, He, C, O, S, Mg, Si, Fe (Kamp & Bertoldi, 2000). The underlying disk models to our calculations are the models of Dullemond et al. (2002). We find that in general the dust and gas temperature are equal to withing 10% for A 0.1, which is above the location of the ‘super-heated surface layer’ in which the dust emission features are produced (Chiang & Goldreich, 1997, e.g.). High above the disk surface the gas temperature exceeds the dust temperature and can can become — in the presence of polycyclic aromatic hydrocarbons — as high as 600 K at a radius of 100 AU. This is a region where CO has fully dissociated, but a significant fraction of hydrogen is still in molecular form. The densities are still high enough for non-negligible H2 emission to be produced. At radii inward of 50 AU, the temperature of the gas above the photosphere can reach up to K. In the disk surface layers, the gas temperature exceeds the virial temperature of hydrogen. Some of this material could possibly evaporate, but firm conclusions have to await the fully self-consistent disk models, where the disk structure and gas temperature determination will be solved iteratively.
keywords:
accretion, accretion disks — stars: planetary systems: protoplanetary disks — stars: pre–main-sequence — infrared: stars1 Introduction
The dusty gas disks surrounding T Tauri stars and Herbig Ae/Be stars are believed to be the birthplaces of planets and have for this reason be the subject of intense study in the last two decades. With the advent of high sensitivity space infrared telescopes such as the Spitzer Space Telescope (SST formally known as SIRTF), and ground-based infrared interferometers such as the Very Large Telescope Interferometer (VLTI), these ‘protoplanetary disks’ can now be studied in unprecedented detail. This puts a high pressure on theoretical modeling efforts of the structure and appearance of these disks (D‘Alessio et al., 1998; Chiang & Goldreich, 1997; Bell et al., 1997; Lachaume et al., 2003; Dullemond & Dominik, 2004a, e.g.). Some of the simplifying assumptions that were used so far may no longer be justified, since observations now start to be able to distinguish between simplified and more realistic disk models. One of the main assumptions underlying virtually all disk structure models to date is the assumption of perfect thermal coupling between the dust and the gas. Since the dust carries all the continuum opacity, it is the dust that influences the continuum radiative transfer through the disk, and thereby determines the dust temperature at every location in the disk. The assumption that the gas temperature is equal to the dust temperature then makes it possible to solve the equation of hydrostatic equilibrium, thus yielding the density structure of the disk. The combined temperature and density stucture of the disk constitutes the self-consistent disk model from which the spectral energy disribution (SED) and images can be derived and compared to observations.
However, it has long been debated whether the assumption of equal dust and gas temperature holds in the surface layers of the disk (Chiang & Goldreich, 1997, e.g.). Above a certain height above the midplane this dust-gas coupling is so low that the gas will find its own thermal balance: a balance between gas heating processes such as the photoelectric effect and dissociation processes on the one hand, and gas cooling via atomic and molecular lines on the other hand. The structure of this very tenuous upper part of the disk will then be similar to that of PDRs, Photon-Dominated Regions (Tielens & Hollenbach, 1985; Hollenbach et al., 1991; Sternberg & Dalgarno, 1995, e.g.) as already noted by e.g. Willacy & Langer (2000) and van Zadelhoff et al. (2003). It is the question whether this decoupling height is above or below the superheated layer. It is also important to compute how the gas temperature will behave above the decoupling height, and what consequences this has for observations of certain molecular line species.
It is the purpose of this paper to present 1+1D models for the vertical temperature structure of the disk in which dust-gas decoupling is taken into account. We first present the underlying vertical density structure models and the physics that go into the self-consistent gas temperature and chemistry calculation (Sect. 2). Sect. 3 describes the standard model including polycyclic aromatic hydrocarbons (PAHs) as well as a comparison model without PAHs. The resulting gas temperatures and the chemical sturcture of these models are presented in Sect. 3.1 and 3.2. In Sect. 4, we discuss the possibility of disk evaporation as a consequence of the high gas temperatures in the upper layers of the disk. Sect. 5 summarizes our results and speculates on future modeling and possible dynamical consequences.
2 The model
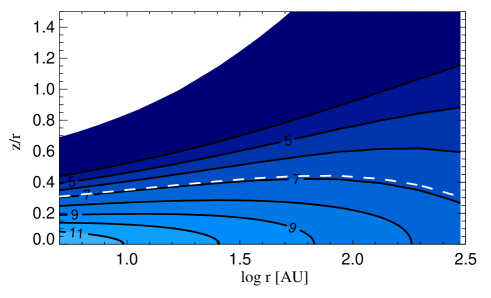
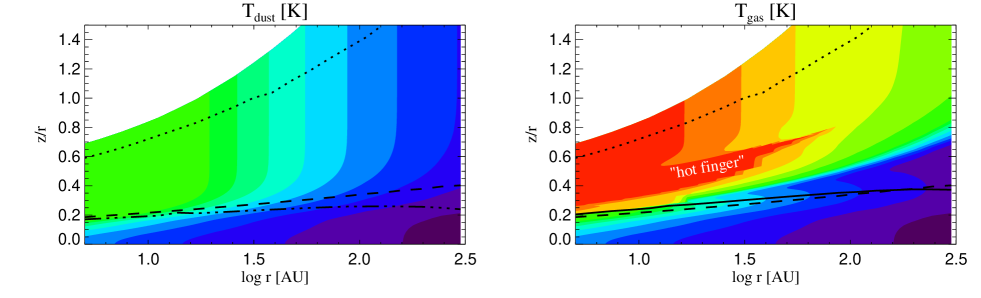
Our model calculations start from the 1+1D vertical density structure models of Dullemond et al. (2002, henceforth DZN02). In these models the dust and gas temperature were assumed to be equal. In Fig. 1 the density distribution of the model is shown. 95% of the mass reside inside the white dashed line. The left panel of Fig. 3 illustrates the dust temperature in this disk model. As one can see, the dust temperature is lowest at the midplane. The dust at the midplane is only heated by thermal infrared emission from the surface layers. As one goes toward higher , initially the dust temperature rises slowly, but upon approaching the surface () of the disk it rises more steeply. This is the transition from the optically thick interior to the photosphere of the disk indicated by the dashed line in Fig. 3). At even higher the dust temperature profile levels off to a constant. This is the optically thin dust temperature: these grains here are directly exposed to the central star since they reside well above the photosphere. In the computation of this model it was assumed that the gas temperature is equal to the dust temperature, and therefore that the dust temperature distribution from Fig. 3 also represent the gas temperature distribution, which enter into the equation of hydrostatic equilibrium. The dust grains are 0.1 m astronomical silicate grains (see DZN02 for more details).
In the present paper, however, we take this model one step further and calculate the gas temperature self-consistently. However, we keep the density structure and the dust temperature the same as the DZN02 models. In order to compute the gas temperature we need to solve the energy balance equation for the gas.
2.1 Chemistry
In order to compute the abundances of the dominant cooling species, we must include a chemical network into our model. The chemistry has been described in detail in Kamp & Bertoldi (2000), and is partly based on rates from the UMIST database (Le Teuff et al., 2000). The chemical network consists of 47 species: H, H+, H-, H2, H, H, He, He+, C, C+, O, O+, S, S+, Si, Si+, Mg, Mg+, Fe, Fe+, CH, CH+, CH2, CH, CH3, CH, CH4, CH, CH, CO, CO+, HCO, HCO+, O2, O, OH, OH+, H2O, H2O+, H3O+, SiO, SiO+, SiH, SiH+, SiH, SiOH+, e-. Those species are connected through 266 reactions including neutral-neutral, ion-molecule, photoionization and photodissociation reactions. We account also for cosmic ray induced photoreactions and charge exchange reactions. Neither grain surface reactions nor ice formation are included, because the temperatures in the upper disk layers do not allow a significant freeze out of molecules.
Some reactions are treated in more detail like the H2 and CO photodissociation. These two reaction rates are derived by using the UV flux and proper shielding factors at the center of the dissociating band. For details we refer to Kamp & Bertoldi (2000). C ionization is treated in a similar way by integrating the photoionization cross section shortward of 1100 Å and accounting for H2 and C self shielding. Depending on the He abundance and on the way the C ionization is treated, the C+/C/CO transition can shift as a function of depth in the disk: the relatively small fraction of He+ obtained by cosmic ray ionization can be sufficient to destroy CO even at locations, where it is already shielded from the stellar UV radiation field. Table 1 summarizes the element abundances used in the following calculations.
| element | element | ||
|---|---|---|---|
| He | -1.125 | Si | -6.100 |
| C | -3.879 | Mg | -5.291 |
| O | -3.536 | Fe | -5.208 |
| S | -5.728 |
The H2 formation rate is given by
| (1) |
where the new H2 formation efficiency of Cazaux & Tielens (2002) was implemented to account for the reduced H2 formation at high temperatures.
The chemistry and gas temperature calculations are restricted to a single dust particle size, in this case m, and a UV absorption cross section of cm2/(H-atom), consistent with the optical properties of the DZN02 model.
We try to find stationary solutions to the chemisty equations by linearizing the equations and solving a matrix equation using an LU-decomposition method. It is not ensured that the assumption of chemical equilibrium is justified. A time-dependent chemistry may be a necessary next step. But since the simultaneous solution of the time-dependent rate equations and the heating/cooling balance over the entire life-time of the disk is quite time-consuming, we decided to use the simplifying assumption of equilibrium photo-chemistry. Another simplifying assumption which we put into our models is to assume that turbulent mixing does not play a very important role.
A disadvantage of focusing only on equilibrium solutions is that deep in the optically thick regions of the disk no equilibrium solutions are found. Whether this means that we are still missing physical ingredients in our chemical network, or whether in reality the chemistry in the disk is ever evolving, is not yet clear. But down to A we can find stationary solutions without a problem.
2.2 Thermal balance of the gas
The gas temperature is derived from balancing all important heating and cooling processes:
| (2) |
where denote the abundances of the chemical species and the UV radiation field. As heating processes we include photoelectric heating of dust grains, photodissociation of molecules and ionisation of atoms, and cosmic rays. Cooling processes are molecular and atomic line emission from species such as CO, H2, CH, C, C+, and O. This line cooling is computed using an escape probability recipe, which we will elaborate on below. Finally we include the thermal coupling between gas and dust, which can be either a heating or a cooling term, dependent on the sign of the temperature difference between gas and dust. Many of the details of these processes are described in Kamp & van Zadelhoff (2001). But for the work presented here we added a couple of features that were not described in that paper. They will be described in the following paragraphs.
Some T Tauri disks are known to contain PAHs and small particles (Gürtler et al., 1999), but in a large fraction of T Tauri star mid-IR spectra, the PAH features are not seen. Natta & Krügel (1995) pointed out that this might be due to the small beam sizes picking up only part of the PAH emission and swamping by the disk continuum. Our standard model uses the combined photoelectric heating rate for PAHs and small graphitic particles by Bakes & Tielens (1994). In order to estimate the effect of PAHs on the gas temperature in the upper layers of the disk, we also run a model without PAH heating, using the heating rate for small interstellar medium (ISM) particles by Tielens & Hollenbach (1985). If photoelectric heating is the dominant mechanism, the resulting gas temperatures will be higher for the PAH+ISM mixture, than for the normal ISM dust. This is due to the higher yield of electrons in the PAH+ISM mixture. Since PAHs do not contribute significantly to the total grain opacity, their influence on the underlying disk structure models is negligible.
In addition, we implemented statistical equilibrium and infrared pumping for the [C ii] fine structure line cooling following the same recipe as for O i and CO in Kamp & van Zadelhoff (2001). To expand the line cooling to optically thick lines, we use an escape probability mechanism, which is discussed in the next paragraph.
| heating | cooling |
|---|---|
| photoelectric heating by PAHs | Ly line |
| and small carbonaceous grains | |
| collisional de-excitation of H2 | O 6300 Å line |
| dissociative heating of H2 | O fine structure lines |
| formation heating of H2 | C fine structure lines |
| gas-grain collisions | C+ 158 m line |
| C ionisation | H2 ro-vibrational lines |
| cosmic rays | CO rotational lines |
| CH rotational lines | |
| gas-grain collisions |
In Table 2, we list all the processes that are included in the present model. Since the heating and cooling rates depend on the abundances of the individual species, the chemistry and the thermal balance have to be solved interatively. This is done using Ridder’s method and reevaluating the chemistry for every new temperature guess. Convergence is typically achieved within 10 steps.
2.3 Escape probability formalism
The optical depth of molecular and atomic lines can be much higher than that of the dust continuum. Therefore, high above the actual photosphere of the disk the molecular lines can still be optically thick. Line cooling, even above the continuum photosphere, is therefore a process in which radiative transfer effects in the molecular lines must in principle be taken into account. Unfortunately it is still quite challenging to compute the detailed radiative transfer in all the molecular line species simultaneously with the solution of a chemical network. As a first step we therefore employ an escape probability formalism. Given a certain line optical depth , the escape probability describes the probability that a photon escapes from this line. The escape probability function is actually derived by an integration over all possible escape paths (inward directed photons are absorbed in the disk) and a gaussian line profile. This is a quite standard procedure in studies of PDRs, and therefore we adopt it here as well.
We use the formulas for and line optical depth presented in the appendix B of Tielens & Hollenbach (1985). The optical depth in all cooling lines in vertical direction is
| (3) |
is the transition probability of the line, the velocity of light, the line frequency, the line broadening, and the upper and lower level densities, and and the upper and lower level statistical weights. The escape probability can be derived from the optical depth
| (4) | |||||
The maximum escape probability is 0.5, because of the slab geometry.
2.4 Flaring angle recipe
The physics of the upper layers of the disk is, similar to PDRs, regulated by the influx of UV and optical radiation from an external source. In our case this is the central star. In ordinary PDR calculations the source of UV radiation is assumed to illuminate the surface of the PDR from above (under a 90 degree angle from above). In contrast, for protoplanetary disks, the light of the central star penetrates the surface of the disk under a very shallow grazing angle (called the ‘flaring angle’), typically of the order of . The definition of the flaring angle is:
| (6) |
where is the height of the continuum surface for photons emerging from the central star. A very rough estimate of is the height above the midplane where the temperature of the dust is times the optically thin dust temperature (see dashed line in Fig. 3).
Because the grazing incident angle is usually very small, stellar radiation can penetrate only very limitedly into the disk, unless dust scattering deflects the UV photons deeper into the disk (van Zadelhoff et al., 2003). The way in which this grazing incident angle is included in the model is as follows. We assume, first of all, that there is no scattering which could deflect ionizing radiation deep into the disk’s photosphere. We can then simply ‘mimic’ the effect of the longer path (compared to vertical incidence) by multiplying all extinction effects of the stellar radiation by . The reason is that for each cm in vertical direction, the photons pass in reality through cm of gas by virtue of the grazing angle of . This means that effectively (per cm in vertical direction) the (self-)shielding of molecular species is times so strong as when the UV source illuminated the layers perfectly from above. Also the radiation responsible for the photoelectric heating effect are extincted by a factor of more efficiently compared to normal PDRs. And finally, a similar effect takes place for the radiation that excites the higher levels of cooling species. All in all this has the effect that much of the ‘action’ takes place at lower AV than would be the case for normal PDRs. For instance, dissociation boundaries lie higher up in the atmosphere of the disk, and dust-gas decoupling may take place at lower AV than would be the case if the UV source would shine 90 degrees from above. This recipe of enhancing the extinction of stellar light by a factor in order to mimic the effect of shallow incidence is called the ‘flaring angle recipe’. For the cooling via molecular lines such a flaring angle recipe is not used, because the emitted photons can escape in all directions.
2.5 Grid resolution and numerical procedure
It is of essential importance to resolve the disk in vertical direction in a way that is appropriate for the disk chemistry. Initially, the 1+1D vertical density structure model grid is adapted to resolve the dust continuum optical depth scale. However, the gas chemistry takes place on a different scale. To ensure that we resolve e.g. the H/H2 transition, we resampled the grid to a ten times finer resolution by linear interpolation.
The calculation of the combined heating/cooling balance and chemistry is extremely time consuming and should be restricted to those regions, where T Tdust. However, a simple check at a single grid point is not sufficient to determine, whether Tgas has converged to Tdust, because it could actually be a crossing point. We implemented here a criterium that checks for a gradual approach of Tgas and Tdust: If both temperatures agree to within 2% over an interval , the detailed balance calculations are stopped and T Tdust is assumed below this point.
3 Results
We present here one standard model, and some features from a model without PAHs. Our standard parameter set is as follows. For the central star we take a T Tauri star with , and K where is the effective temperature of the photosphere of the star. Our disk model is assumed to have a surface density profile given by a powerlaw:
| (7) |
with g cm-2. The inner radius of the disk is taken to be AU, and the outer radius AU. With these parameters the mass of the disk becomes . The flaring angle for this model follows automatically from the solution to the equations of DZN02, and we use this flaring angle (which is a function of ) as input to the gas heating/cooling and chemistry calculations.
In order to simulate the surrounding remnant medium of the star formation region, we extend the disk model to larger heights assuming a smooth transition to a constant low density region of cm-3; this is a typical value for the remnant molecular cloud gas as seen in the low-mass star forming regions Taurus Aurigae or Chamaeleon (Palla & Stahler, 2002; Mizuno et al., 2001). The radiation field is assumed to be that of an active young T Tauri star. Following the recipe described in Kamp & Sammar (2004), we scaled the solar chromospheric activity backwards to an age of 2 Myr, assuming an age of 4.6 Gyr for our Sun. The integrated stellar UV flux is then calculated to be
| (8) |
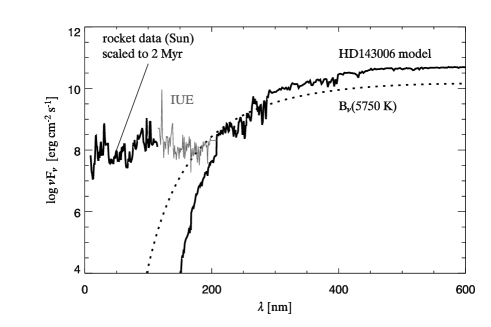
at the stellar surface. This value is diluted with according to the respective distance of the slab to the star. It corresponds to times the interstellar Draine field at 10 AU. Fig. 2 shows the complete stellar spectrum assumed for the T Tauri star. For the composed spectrum, we used the scaled solar UV flux, the IUE observations of the T Tauri star HD 143006 and a Kurucz model with K, .
Since we do not assume any turbulent mixing, the disk model is divided into vertical slabs and a 1D coupled chemical and heating/cooling calculation is carried out starting at the upper boundary of the model. Due to the strong radiation field impinging on the inner disk, which complicates the convergence of the model, we only start our model calculations at 5 AU.
3.1 Gas temperature
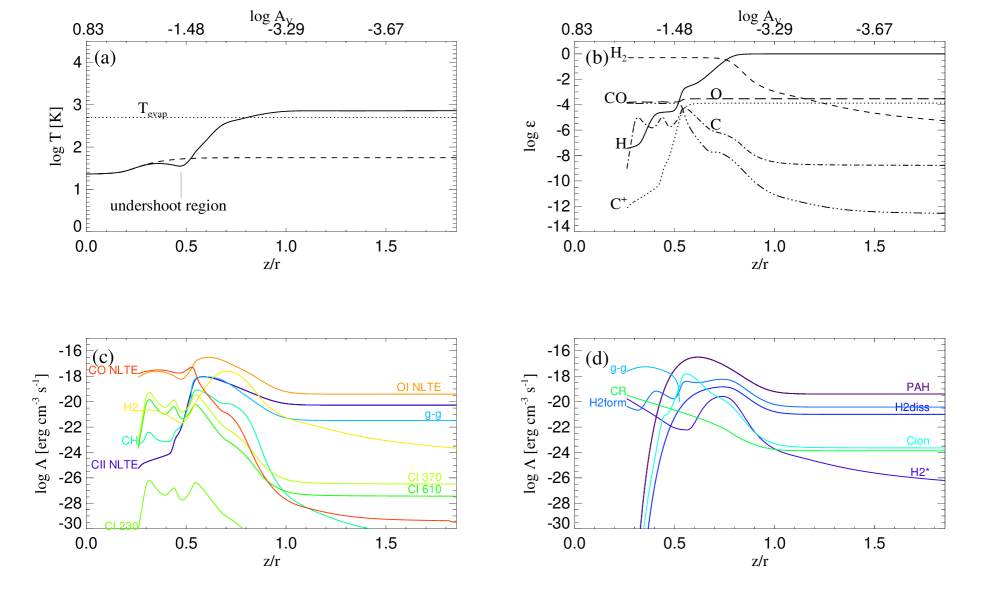
The resulting gas temperature for the standard model is shown in Fig. 3 together with the dust temperature from the input model. The gas temperature in the disk atmosphere is much larger than the dust temperature. Deeper in the disk, slightly above the surface, gas and dust are well collisionally coupled and hence in thermal equilibrium (within a 10% error margin). A very pronounced feature of these models is the hot region, K in the disk atmosphere at radii smaller than 50 AU, which we will address as “hot finger” in the following (the region is labelled in the right panel of Fig. 3). Another feature of these models is the “undershoot region” for the gas temperature around the surface. This is the region, where the gas temperature contours in Fig. 3 change their slope and the gas temperature drops actually below the dust temperature. For a more quantitative illustration of this model, we included two perpendicular slices at 20 and 100 AU (Fig. 5 and 6), where we indicate the location of the “undershoot region”.
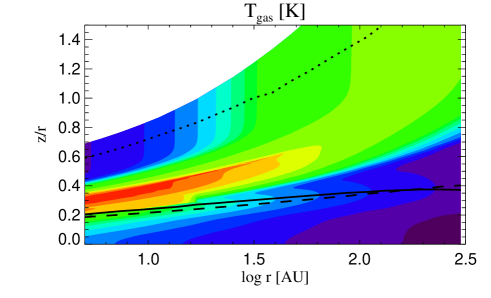
The second model without PAH heating is shown in Fig. 4. The lower equilibrium gas temperatures in the surface layers are due to the lack of PAH heating as compared to the standard model. Nevertheless, it is important to notice that the lower part of the “hot finger” is still present in this model. As for the standard model, the assumption of T Tdust is satisfied below the surface.
All the above described features are explained in the following paragraphs by a complex combination between gas chemistry and gas heating/cooling processes. We will concentrate on the standard model and explain only differences arising from the absence of PAHs in the second model.
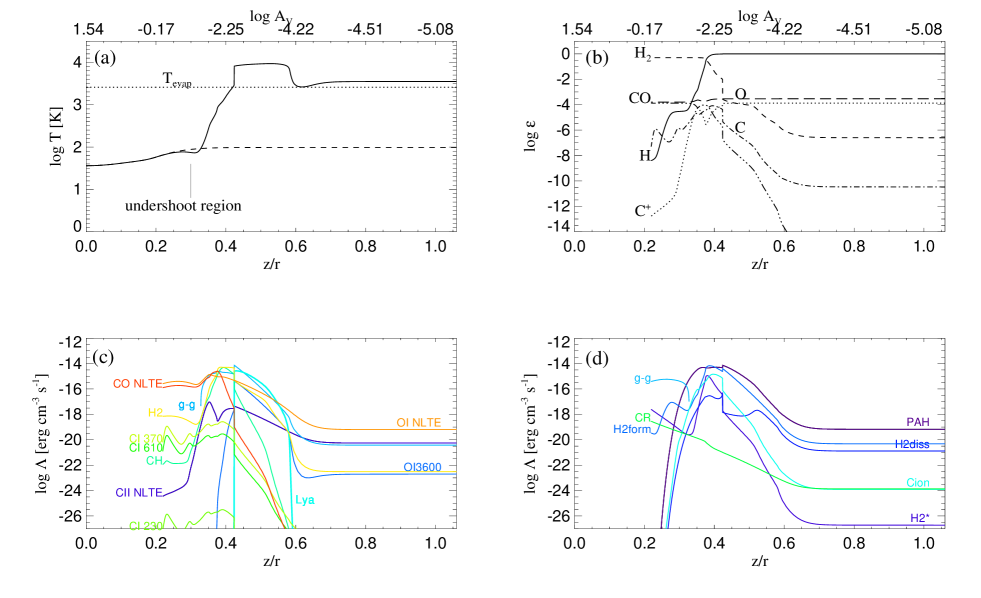
The heating is dominated by photoelectric heating (PE) due to PAHs and small carbonaceous dust grains. At the lower boundary of the “hot finger”, where the electron abundance and hence the PE heating drops, the gas is heated primarily by H2 formation (see Fig. 5d). As H2 becomes the dominant carrier of hydrogen deeper in the disk, this heating process turns off. We verified that our models resolve the H/H2 transition. For a more detailed discussion of the H2 chemistry, we refer to the next paragraph.
Cooling is mainly due to [O i] fine structure lines. In the “hot finger” region, Lyman and H2 ro-vibrational line cooling are the dominant cooling processes followed by gas-grain collisions (see Fig. 5c). At larger radii, beyond the “hot finger” region, the balance between [O i] fine structure cooling and PE heating sets the gas temperature (Fig. 6c and d).
The steep temperature rise at the upper boundary of the hot finger is due to a different scaling behaviour of the main heating and cooling rates, photoelectric heating versus [O i] line cooling. PE heating scales roughly as : it depends linearly on the grain number density, which is linked by a constant to the total number density, and it depends indirectly on electron density through the PE heating efficiency. The higher the electron density, the lower the grain charge and hence the larger the efficiency of the PE heating. Given the strong radiation fields that illuminate the surface of the disk, carbon is the main source of electrons, because it is fully ionized: . While the PE heating scales with , cooling is dominated by [O i] fine structure lines in NLTE and hence scales with . If the density rises, the increase in PE heating is much larger than the increase in cooling. Therefore, the gas temperature rises. Since PE heating depends only weakly on temperature , has to increase strongly to compensate the density effect. The temperature levels off again as LTE is reached and the cooling lines are collisionally dominated and scaling with . The high temperatures obtained in this model depend sensitively on the atomic data that enters the calculation of the cooling lines. The reason is that the PE heating depends only weakly on the gas temperature in the regime of high irradiation. Therefore, any small change in the cooling rates — due to e.g. uncertainties in the collision cross sections — causes a large change in the equilibrium solution of the gas temperature. However, this holds only for the uppermost layers of the disk. In the “hot finger” region, densities are typical of the order of cm-3, and O i level population numbers deviate by less than 10% from LTE. Thus, the gas temperature in this region is hardly affected by uncertainties in the O-H or O-e- collision cross sections.
In the inner regions of the disk, AU, the gas temperature shows a steep temperature gradient just below the hot finger (Fig. 5a). This is due to the large drop in H2 formation heating as most of the hydrogen is turned into molecular hydrogen.
The undershoot feature near the surface is an intrinsic feature that is due to the physical description of the gas-grain interaction. [O i] and CO cooling dominate the energy balance in the regions, where T Tdust. As the density rises towards the midplane, the line cooling is so efficient that Tgas drops even below Tdust. This feature is not present in the model calculations of Jonkheid et al. (2004). If the gas-grain collisional coupling would be larger or the [O i] fine-structure line cooling smaller, gas and dust would start to couple at higher in the disk and hence the undershoot region would vanish. This could e.g. be achieved by a different density gradient ([O i] fine-structure lines become optically thick at higher ) and/or smaller grains (gas-grain collisional cooling is enhanced compared to [O i] fine-structure lines and CO cooling). We assumed here, that the 0.1 m grains are responsible for the gas-grain cooling, not the small PAHs.
In the model without PAHs, the lower part of the “hot finger” is still present (Fig. 4). In this part, PE heating is not the dominant heating process and hence the omission of PAHs does not change the overall picture. Mainly, H2 formation heating is balanced by H2 ro-vibrational line cooling and gas-grain collisions. Hence, the resulting gas temperature is the same as in the standard model. However, the upper layers of the disk without PAHs are much cooler than in the standard model. [C+] 158 m line cooling is now the dominant cooling process inwards of AU. Interestingly, the gas temperature drops as one gets closer to the star. This seems at first glance counterintuitive, because the strength of the radiation field increases and therefore one would expect a stronger PE heating rate
| (9) |
However, the PE heating efficiency drops in the absence of PAHs much faster than and thus the heating rate becomes smaller. The ISM grains, which are rather large compared to the PAHs, become strongly charged in the presence of high UV radiation fields. Therefore it becomes more difficult for an electron to escape the grain and actually heat the gas. In the model with PAHs, the slope of the PE heating efficiency is much flatter, because the PAHs, which are actually large molecules, are less charged than the ISM grains.
3.2 Gas chemistry
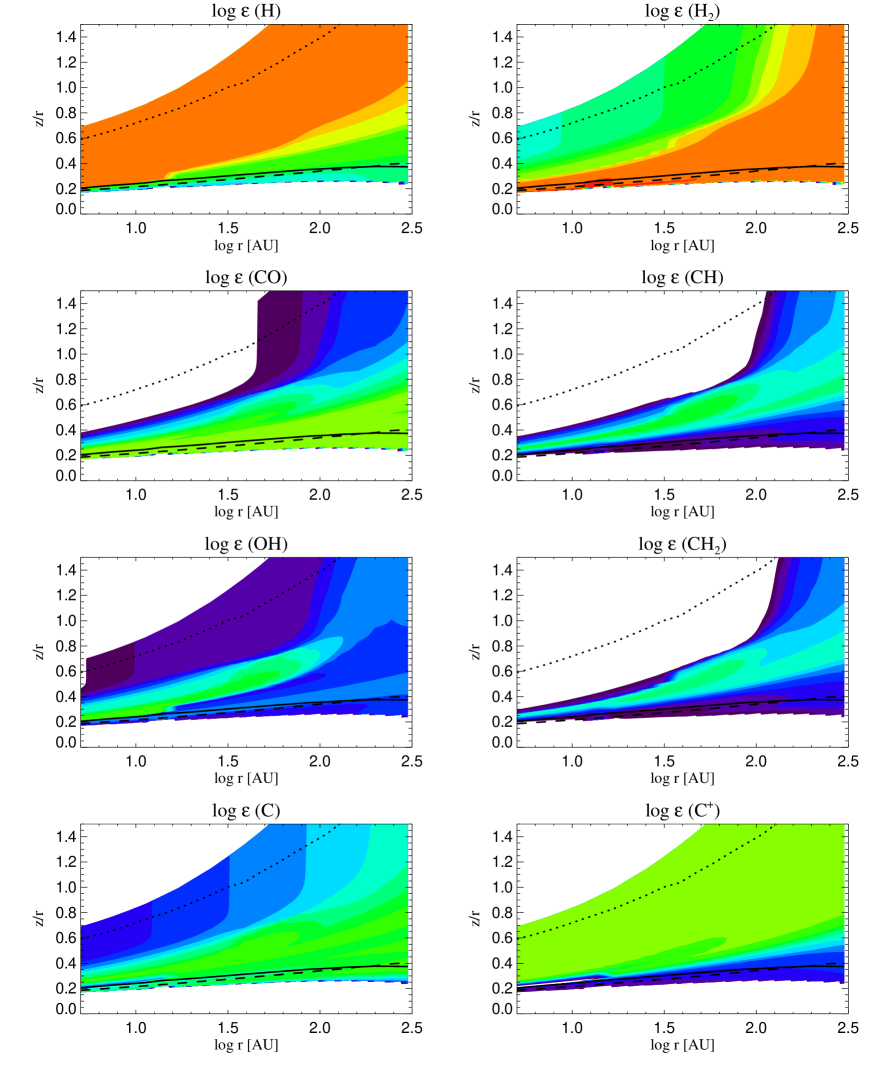
Fig. 7 illustrates the abundances of the most important atoms and molecules in the disk. The H/H2 transition occurs well above the warm disk surface layer. The same holds for the C+/C/CO transition. Interestingly, the hot finger is almost devoid of H2, because it is chemically destroyed at high temperatures. At low AV (), H2 is photodissociated, but deeper in the disk, the UV radiation is efficiently shielded and H2 is mainly destroyed via collisions with first H-atoms and then O atoms, leading to the formation of H and OH. The latter is subsequently photodissociated into its atomic components. Hence, H2 is destroyed chemically and not via direct photodissociation by stellar UV photons. There exists a region in our model, where the CO photodissociation front lies at the same AV than the H2 dissociation front (see Fig. 5b). Leaving out the PAHs does not change the resulting chemical structure of the model.
An interesting feature is the “hot finger” region, which shows a very high abundance of OH. Similarly, there are intermediate layers in the disk atmosphere, where CH and CH2 show an abundance maximum. Although these layers do not contain a lot of disk mass, they may still be observable. The column densities of CO, CH, and CH2 are , , and cm-2 at a distance of 100 AU for the standard model.
The disk atmosphere contains a significant amount of gas in molecular form. The high temperature of this gas might help to excite e.g. molecules such as H2, which would otherwise not be observable.
4 Disk evaporation
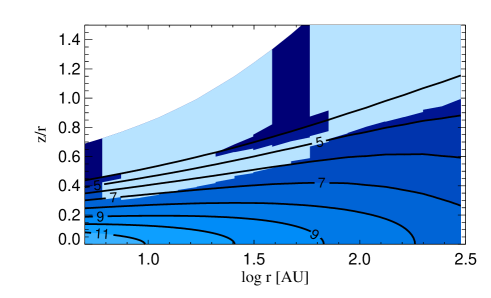
Given the gas temperatures derived for the disk model with PAHs, H i will evaporate from the upper disk layers. Its thermal velocity in the standard model is large enough to overcome gravity. However, it exceeds the escape velocity
| (10) |
only marginally. is here the gravitational constant, the stellar mass and the distance from the star. Fig. 8 shows the region, where hydrogen gas can escape given the rather conservative criterium
| (11) |
is the mass of a hydrogen atom and the Boltzmann constant.
The thermal velocities of the heavier elements are smaller than the escape velocity and they could only escape if they are entrained with the evaporating hydrogen flow. Given a collision rate , their mean free path in a hydrogen flow is (Kwok, 1975)
| (12) | |||||
is the masses of the heavy element, is the Bohr radius, and is the hydrogen particle density. Assuming the minimum density from our models, 5000 cm-3 in the surrounding medium, we find that the maximum free path for an oxygen atom is AU. Although the mean free path of the heavy elements is rather small, the force acting on these particles is smaller than gravity.
Firm conclusions on the possibility of evaporation can only be drawn from dynamical calculations, which account for additional forces like the pressure gradient and centrifugal term. The deviation from Keplerian velocity is approximated as
| (14) | |||||
(Klahr & Lin, 2000), where is the Keplerian frequency, the sound speed, and the gas mass density. Although is rather small in the cold disk midplane, the warm disk surface ( K) will rotate substantially subkeplerian, . This may also give rise to shear instability.
It should however be kept in mind, that there is some uncertainty in the gas temperature due to the atomic data that enters the cooling line calculations and the rather simple fitting formulas used for the heating processes. However, Adams et al. (2004) have recently shown that the evaporation flow starts indeed already at subsonic velocities. In our case, this would mean that the evaporation would start deeper in the disk, leading to a much higher mass loss rate. The uncertainty in the gas temperature will then be less important, because rather than switching from non-evaporation to evaporation, the mass loss process would be rather smooth and differ only in its efficiency. In the model without PAHs, the gas temperature is generally lower and disk evaporation is thus less effective.
5 Conclusions
We find that the dust and gas temperature in protoplanetary disks around T Tauri stars are well coupled up to the location of the ‘superheated surface layer’ where the dust emission features are produced. This means that for models aimed at predicting dust continuum emission from protoplanetary disks, the assumption of equal gas and dust temperature is probably not too far from the truth.
At radii smaller than 50 AU, the gas temperature can reach values of K above the disk photosphere. First estimates indicate that at least hydrogen can evaporate from the disk surface. To verify this, an iteration procedure is required, in which the resulting gas temperature structure is inserted into the equation of hydrostatic equilibrium, yielding a new density structure, which then feeds back into the chemistry-heating-cooling model. This, however, is beyond the scope of the present paper. We can nevertheless speculate on the consequences of such an iteration given the results of our present model: in the upper layers of the innermost disk regions, AU, the gas temperature depends hardly on density. Therefore, we do not expect our gas temperature structure to change a lot in these regions, if the feedback on the disk structure would be taken into account (more flaring in the outer parts and hence a different density structure). But at larger radii, AU, the “hot finger” and hence the evaporating region, could vanish if the density structure of the disk changes.
It is especially interesting to note the importance of PAHs on the resulting gas temperature structure of the upper disk atmosphere. PAHs are a significant heating source in the uppermost layers. The presence of PAHs in the calculations presented here is necessary for the possibility of disk evaporation. It does, however, not lead to significant changes in the chemical structure of the model.
Above the superheated surface layer, the dust and the gas thermally decouple. Some molecular species, such as H2, CO, CH, CH2, OH, probe the very upper layers of the disk, in the region where the gas temperature has already decoupled from the dust. In order to make reliable predictions for these molecular lines, a detailed gas temperature and molecular abundance calculation of the kind presented here is important. Jonkheid et al. (2004) found strong increases, up to a factor 10, in the [O i] and [C ii] fine structure line fluxes, due to different excitation conditions in the disk models with a detailed calculation of the gas temperature. The accuracy of the gas temperature determination is extremely difficult to assess, especially given the fact that atomic and molecular collision cross sections are often poorly known at high temperatures and our limited knowledge of the grain composition and size in these disks. There are e.g. only very few direct detections of PAHs in T Tauri disks. It is very important for the models to seek for input from the observations. Instruments like VISIR at the VLT have the high resolution () that is necessary to pick up the narrow gas lines from these disks. If such gas line observations would reveal the presence of an extremely hot disk surface layer, we might have an indirect evidence for the presence of PAHs in disks around T Tauri stars.
In this paper we have always assumed that the dust and the gas are well-mixed, i.e. that the dust has not settled toward lower elevations above the midplane. In reality, however, in the very surface layers of the disk, this settling process takes place on a very short time scale. At 10 AU, for instance, a dust grain of 0.1 m settles below the initial photospheric height in less than 103 years. A detailed study of the consequences that this settling process has on the appearance of the disk has been given recently by (Dullemond & Dominik, 2004b, in press). In future work this process will have to be included into the present model, in order to study the effect of dust settling on the temperature structure of the disk.
Finally, some short speculations on the dynamical consequences of our gas temperature results: the strong temperature gradients, especially above the hot finger, suggest that convective instabilities might occur. Material expanding into the upper layers of the disk atmosphere will encounter a steep negative temperature gradient that might exceed the adiabatic one. In addition, these strong temperature gradients could also give rise to shear instabilities. Such convective and shear instabilities could lead to additional mixing, especially in the upper layers of the disk, where one would like to keep the small dust grains.
Acknowledgements.
We are grateful to Ewine van Dishoeck and Bastiaan Jonkheid for a detailed comparison of our codes and numerous discussions on the details of thermal balance calculations. We acknowledge also the fruitful discussions on this topic taking place during an ongoing detailed comparison of several PDR codes. Furthermore, we would like to thank David Hollenbach and Doug Lin for interesting discussions on the dynamical consequences of these models during a workshop on protoplanetary disks held at Ringberg castle. An anonymous referee helped us to improve the perspicuity of the paper significantly. I. Kamp acknowledges support by a grant from the Netherlands Organisation of Scientific Research (NWO).References
- Adams et al. (2004) Adams, F. C., Hollenbach, D., Laughlin, G., and Gorti, U. ApJ, submitted
- Bakes & Tielens (1994) Bakes, E. L. O., and Tielens, A. G. G. M. 1994, ApJ 427, 822
- Bell et al. (1997) Bell, K.R., Cassen, P.M., Klahr, H.H., Henning, Th. 1997, ApJ 486, 372
- Cazaux & Tielens (2002) Cazaux, S., and Tielens, A. G. G. M. 2002, ApJ 577, L127
- Chiang & Goldreich (1997) Chiang, E. I., and Goldreich, P. 1997, ApJ 490, 368
- D‘Alessio et al. (1998) D’Alessio, P., Canto, J., Calvet, N., and Lizano, S. 1998, ApJ, 500, 411
- Dullemond et al. (2002) Dullemond, C. P., van Zadelhoff, G. J., Natta, A. 2002, A&A 389, 464
- Dullemond & Dominik (2004a) Dullemond, C. P., Dominik, C. 2004a, A&A 417, 159
- Dullemond & Dominik (2004b) Dullemond, C. P., Dominik, C. 2004b, A&A in press
- Gürtler et al. (1999) Gürtler, J., Schreyer, K., Henning, Th., Lemke, D., Pfau, W. 1999, A&A 346, 205
- Hollenbach et al. (1991) Hollenbach, D. J., Takahashi, T., and Tielens, A. G. G. M. 1991, ApJ 377, 192
- Jonkheid et al. (2004) Jonkheid, B., Faas, F., van Zadelhoff, G.-J., van Dishoeck, E. F. 2004, A&A submitted
- Kamp & Bertoldi (2000) Kamp, I., and Bertoldi, F. 2000, A&A 353, 276
- Kamp & van Zadelhoff (2001) Kamp, I., and van Zadelhoff, G.-J. 2001, A&A 373, 641
- Kamp & Sammar (2004) Kamp, I., Sammar, F. 2004, A&A submitted
- Klahr & Lin (2000) Klahr, H. H., and Lin, D. N. C. 2000, ApJ 554, 1095
- Kwok (1975) Kwok, S. 1975 ApJ 198, 583
- Lachaume et al. (2003) Lachaume, R., Malbet, F., and Monin, J.-L. 2003, A&A 400, 185
- Le Teuff et al. (2000) Le Teuff, Y. H., Millar, T. J., and Markwick, A. J. 2000, A&AS 146, 157
- Mizuno et al. (2001) Mizuno, A., Yamaguchi, R., Tachihara, K., Toyoda, S., Aoyama, H., Yamamoto, H., Onishi, T., and Kukui, Y. 2001, PASJ 53, 1071
- Natta & Krügel (1995) Natta, A., Krügel, E. 1995, A&A 302, 849
- Palla & Stahler (2002) Palla, F., and Stahler, S. W. 2002, ApJ 581, 1194
- Sternberg & Dalgarno (1995) Sternberg, A., and Dalgarno, A. 1995, ApJS 99, 565
- Tielens & Hollenbach (1985) Tielens, A. G. G. M., and Hollenbach, D. 1985, ApJ 291, 747
- Willacy & Langer (2000) Willacy, K., and Langer, W. D. 2000, ApJ 544, 903
- van Zadelhoff et al. (2003) van Zadelhoff, G.-J., Aikawa, Y., Hogerheijde, M. R., and van Dishoeck, E. F. 2003, A&A 397, 789