Multiwavelength Study Of Two Unidentified -Ray Sources
Abstract
Most counterparts of the identified low–latitude –ray sources are Isolated Neutron Stars (INSs). Since INSs are characterized by an extremely high value of , a systematic X–ray/optical coverage of the fields of unidentified low–latitude –ray sources is the best way to unveil INS counterparts of unidentified sources. Since the low–latitude sources are heavily affected by the interstellar absorption in both the X-ray and optical bands, we decided to apply the above strategy to two middle–latitude EGRET sources, which could belong to a local galactic population: 3EG J0616-3310 and 3EG J1249-8330. Here we report on the global X-ray characterisation of about 300 objects, on their candidate optical counterparts and on the preliminary results of their identification.
1 X–ray observations, data reduction and source detection

3EG J0616-3310 and 3EG J1249-8330 are two middle–latitude (), still unidentified, EGRET sources (Fig. 1). Since they have no candidate extra–galactic counterparts, we assumed that Isolated Neutron Stars (INSs) are the most likely sources of the –ray emission. To this aim, we performed a multi–wavelength search of celestial objects with high (i.e. 1000) X–ray–to–optical flux ratios, according to an investigation strategy which was already successfully used for the identification of Geminga [Bignami and Caraveo (1996)] and of other EGRET sources [Mirabal and Halpern (2001), Caraveo (2001)].
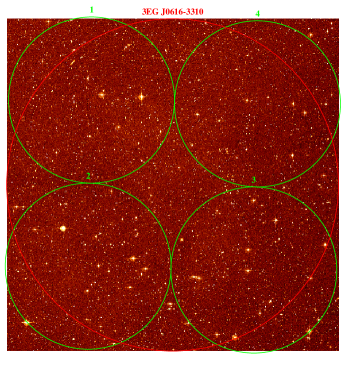
Both sources are positioned within error circles of radius which corresponds roughly to the diameter of the EPIC field–of–view, the focal plane camera of the XMM–Newton observatory. Each region was covered by four 10 ks EPIC pointings (Fig. 2) and each of the eight pointings includes three data-sets for the PN, MOS1 and MOS2 cameras [Strüder et al. (2001), Turner et al. (2001)], respectively. All data-sets were independently processed with the standard XMM-Newton Science Analysis System (SAS).

After the standard processing pipeline, we performed the source detection in 7 different energy ranges. Namely, we considered two coarse soft/hard bands (0.5–2 and 2–10 keV) and a finer energy division (0.3–0.5, 0.5–1, 1–2, 2–4.5, 4.5–10 keV).
To increase the signal–to–noise (S/N) ratio and to reach fainter X–ray flux limits, we analysed together the events from the three instruments, then we selected only the sources with a detection likelihood in at least one of the predefined energy ranges. With this criterion we found a total of 146 sources in the 3EG J0616-3310 error circle and 148 sources in the 3EG J1249-8330 one [La Palombara et al. (2003)].
2 X–ray results
2.1 Full statistics
In Table 1 we report the number, as well as the percentage, of the sources detected in each energy range.
| Source | 3EG J0616-3310 | 3EG J1249-8330 |
| Range (keV) | N(%) | N(%) |
| 0.5–2 | 119 (81.5) | 119 (80.4) |
| 2–10 | 41 (28.1) | 42 (28.4) |
| 0.3–0.5 | 28 (19.2) | 14 (9.5) |
| 0.5–1 | 73 (50) | 43 (29.1) |
| 1–2 | 81 (55.5) | 77 (52) |
| 2–4.5 | 47 (32.2) | 36 (24.3) |
| 4.5–10 | 4 (2.7) | 8 (5.4) |
| Total | 146 | 148 |
The number of detected sources within each field is strongly dependent on the selected energy band. More than 80% of all sources are detected in the range between 0.5 and 2 keV, with more than 50 % of the total detected in the sub–range 1–2 keV. However, only very few sources are detected at very high or very low energies. It is also interesting to remark that the percentage of sources detected below 1 keV is lower for the 3EG J1249-8330 field than for the 3EG J0616-3310, whereas the number of sources is comparable at higher energies. Such a difference is very likely due to the column density of the interstellar gas, which is higher in the first field ( and for 3EG J0616-3310 and 3EG J1249-8330, respectively).
2.2 Source distribution over the Count Rates
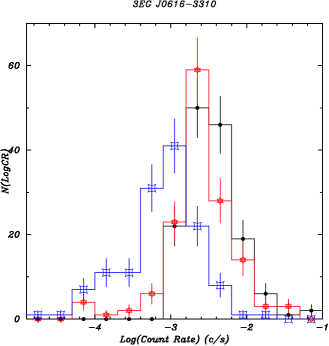
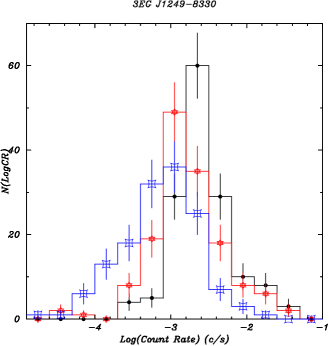
Fig. 3 shows the histogram of the source distribution over the logarithm of their Count Rate (CR) in three energy ranges for the whole error–circle of the two EGRET fields. Note that in the full energy range (i.e. 0.3-10 keV) the distribution peak is around logCR=-2.65 (i.e. cts/s) for both error–circles. Since the number of detected sources for CR bin decreases below the peak CR, we assume that our sample becomes incomplete for lower CR values: therefore we consider the CR peak values as our completeness limit.
Moreover, we can see that, in the case of 3EG J0616-3310, the source distributions in the low and in the full enegy range are very similar, since the peak count rate below 2 keV is equal to or just below the full energy one; in the high energy range, however, the source distribution is very different and most of the detected sources have count rates below cts/s. For 3EG J1249-8330 there is a larger difference between the full and the low energy ranges, perhaps due to the higher column density of the interstellar gas.
2.3 Source distribution over the Signal–to–Noise ratio


In Figure 4 we report the histogram of the source distribution as a function of the S/N ratio (in the whole energy range) for the two EGRET fields. The two distributions peak at 4.5 and 5.5 for, respectively, the 3EG J0616-3310 and the 3EG J1249-8330 sources. Moreover, in the case of the 3EG J0616–3310 sample, a significant fraction of the sources has a S/N ratio higher than 10; on the other hand, only one source of the 3EG J1249-8330 field has a very high (47.16) S/N ratio.
2.4 Source Hardness Ratios
The count statistics of the sources in our sample is very low (usually of the order of a few tens of photons) and therefore it is not possible to accumulate a significant spectrum and to perform a spectral fit. As an alternative, we used the CR in the seven energy ranges to calculate four different Hardness Ratios (HRs):
-
•
HR1=[CR(0.5-1)-CR(0.3-0.5)]/[CR(0.5-1)+CR(0.3-0.5)]
-
•
HR2=[CR(1-2)-CR(0.5-1)]/[CR(1-2)+CR(0.5-1)]
-
•
HR3=[CR(2-4.5)-CR(0.5-2)]/[CR(2-4.5)+CR(0.5-2)]
-
•
HR4=[CR(4.5-10)-CR(2-4.5)]/[CR(4.5-10)+CR(2-4.5)]
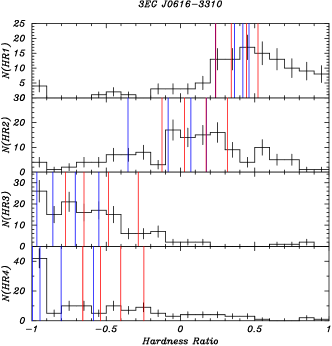
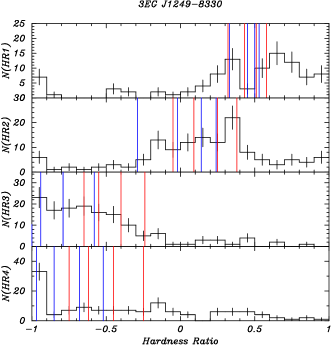
Fig. 5 illustrates the histograms of the number of detected sources as a function of the single HRs. From a global point of view, we found that most of the sources have HR1>0, -0.2<HR2<+0.4, HR3<0 and HR4-1. These results suggest that our source population is characterised, on average, by rather soft spectra, with the count distributions peaking between 0.5 and 2 keV. In the majority of cases, the CR is higher in the 1–2 keV range than in the 0.5–1 keV one, while several sources show a significant CR up to 4.5 keV but only very few of them have a very soft or a very hard spectrum.
We also performed simulations to estimate the expected HRs for different spectral models. For comparison, the results are shown as vertical bars in the Fig. 5. It is possible to see that the measured HR values are compatible with a rather wide range of both temperatures and photon indexes, thus suggesting that we are sampling a variety of types of serendipitous sources. Such a result is not surprising, since the two areas observed are at medium galactic latitude and therefore should contain both galactic and extragalactic X–ray sources. Making use of the results of the simulations, we could tentatively assign to each source its most likely spectral parameters, both in the form of temperature and photon–index.
2.5 The Log(N)–Log(S) source distribution
In order to evaluate the source fluxes, we considered the total count rate of each source in the 0.3–10 keV energy range and assumed a template power–law spectrum with photon–index . As far as the hydrogen column density , we considered the estimated mean total galactic value for each of the eight EPIC pointings. To compute the corresponding count-rate-to-flux Convertion Factor (CF) for the eight individual pointings, we considered separately the three EPIC focal plane cameras and carefully combined both their CFs and their effective exposure times.


Fig. 6 shows the cumulative Log(N)–Log(S) distributions of the sources detected in the two energy ranges 0.5–2 and 2–10 keV. For comparison, it shows also the lower and upper limits of the same distributions as measured at high galactic latitude, where only extragalactic sources should be observed [Baldi et al. (2002)]. It is interesting to note that in the soft energy band the source density is higher than at high latitudes. This indicates a significant excess of galactic sources. The same is not true in the hard energy range, where the source distribution is in good agreement with the high–latitude one, implying that galactic sources provide a negligible contribution at high energies.
3 The optical analysis
3.1 Search for optical counterparts
In order to search for possible optical counterparts of our X–ray sources, we cross–correlated their coordinates with the position of the sources of two optical/infrared catalogues: GSC2.2 (http://www–gsss.stsci.edu) and 2MASS (http://pegasus.phast.umass.edu). We found that only for very few cases an X–ray source could be clearly associated with a single optical object: we used the celestial positions of these optical sources to perform the astrometric correction of all the X–ray source coordinates, which turned out to be always lower than 2′′. Therefore we assigned a conservative value of 5′′ to our X–ray error circle radii.
Firstly, we considered the X–ray sources of all the eight pointings and selected, as possible optical counterparts, all the GSC2.2 and 2MASS sources within their error circles. For some X–ray sources we found more than one candidate, while for several sources we found no counterpart within 5′′. Such a result does not come as a surprise. The GSC2.2 catalogue has a Bj limiting magnitude 22.5 in the IIIaJ passband. Taking into account both the completeness limit of the X–ray source detection and the typical ranges of the various classes of X–ray sources (section 3.2), we estimated that the faintest counterparts should have V 22 for stars and V 25 for other classes of celestial objects. We therefore expect not to be able to detect the optical counterparts for several X–ray sources, for which we assume a limiting magnitude Bj=22.5.
To reach deeper limiting magnitudes we used the Wide Field Imager of the MPG/ESO 2.2 m telescope at La Silla. Three of the four EPIC pointings of 3EG J0616-3310 (i.e. the pointings 2, 3 and 4 of Fig.2) were observed down to V25.5 [see Schirmer et al. (2003 for the description of the data processing)]. Since our optical data should provide reliable counterparts for a large fraction of our X–ray sources, we analysed them separately. Even in this case, however, we found no counterpart within 5′′ for a few X–ray sources, for which we assumed a limiting magnitude V=25.5.
3.2 Source characterization and identification
Based on the available X–ray and optical data, we performed a preliminary characterization of all the X–ray sources in our sample.
From the X–ray point–of–view, we considered both the detection bands yielding significant detection and, based on them, the reliable HRs of each source; then we compared these parameters with the results of our numerical simulations. In this way we were able to constrain the possible range of values for each source spectral parameter, be it temperature or photon–index, yielding a rough indication on the source type.
From the magnitudes of the selected counterparts (Bj for the GSC2.2 data and V for the WFI ones), we obtained the corresponding optical fluxes and, then, the X–ray–to–optical flux ratios. In order to use this parameter for the source characterization, we had to select a ‘reference classification scheme’. To this aim, we considered the results of the Hamburg–RASS optical identification program [Zickgraf et al. (2003)], which provides the typical ranges of values of the ratio for each class of celestial sources. They were obtained using a different X–ray energy range (0.1–2.4 keV instead of 0.3–10 keV), different spectral models (specific for each class of sources instead of a fixed power–law) and, in the case of the WFI data, a different optical filter (Johnson V instead of SERC Bj). Therefore we had to adapt the Hamburg-RASS results to the parameters used in our work [Chieregato (2004)]. Moreover, for a few of the WFI counterparts we had already a suggested classification, based on the photometric data [Hatziminaoglou et al. (2000)].
Based on the above procedure, we could divide our X–ray sources in three sets of data:
-
•
Classified Sources, which have a single optical counterpart and whose X–ray and optical parameters agrees to provide a reliable classification
-
•
Sources with candidate counterparts, which have either more than one optical counterpart or a single one but whose X–ray and optical parameters do not yield a unique classification
-
•
Sources without candidate optical counterparts within a 5′′ radius
| EGRET field | 3EG J0616-3310 | 3EG J1249–8330 | |
| EPIC pointings | 1 | 2-4 | 5-8 |
| Total number of X–ray sources | 50 | 96 | 148 |
| Classified X–ray sources | 13 (26 %) | 24 (25 %) | 22 (15 %) |
| X–ray sources with candidate counterparts | 10 (20 %) | 55 (57 %) | 32 (22 %) |
| Total number of candidate optical counterparts | 26 | 126 | 61 |
| X–ray sources without candidate counterparts | 27 (54 %) | 17 (18 %) | 94 (63 %) |
Tab. 2 shows the number of sources for the three cases, together with the total number of possible counterparts: there we have considered the two EGRET fields separately; moreover, we have also distinguished between pointing which are covered by the GSC2.2 data only (1, 5-8) and pointings which are covered by the WFI data too (2-4). In the latter case there is a much lower percentage of X–ray sources without candidate counterparts, in comparison with the former one; on the other hand, both the percentage of X–ray sources with candidate counterparts and the total number of candidate counterparts is very high. These results are due to the deeper optical coverage (see previous section). This means that the missing counterparts are fainter than V25.5 and Bj22.5 for, respectively, pointings 2-4 and pointings 1, 5-8.
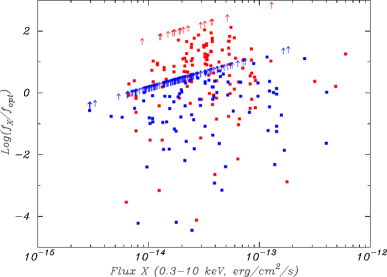
Fig. 7 shows the values as a function of the X–ray fluxes for all the X–ray sources of our sample, both with and without optical counterparts (for sources without optical counterpart lower limits have been computed). The plot shows that there is a large spread in the ratios at all values of the X–ray fluxes.
-
•
When we consider only the sources with a candidate counterpart, we note that the maximum ratios are rather low: 15 for the sources with only a GSC2.2 counterpart and 130 for the sources with a WFI counterpart. These values are compatible with extragalactic identifications (AGN or cluster of galaxies) but not with an INS one.
-
•
When we include also the sources without optical counterpart we estimated the flux ratios based on the limiting magnitudes (Bj22.5 or V25.5) and obtained lower limits to the values. They range between 0.4 and 25 for the GSC2.2 limit and between 45 and 700 for the WFI limit: this last value is very interesting, since it approaches the expected X–ray–to–optical flux ratio for an INS (1000).
4 Conclusions and perspectives
Thanks to the XMM-EPIC observations, we have detected about 150 X–ray sources in both the error–circle of 3EG J1249-8330 and 3EG J0616-3310. Using survey optical data to search for counterparts within 5′′, we had a success rate of 40 %, leaving 60 % of the X–ray sources unidentified down to a limiting magnitude Bj22.5. Ad hoc optical observations changed completely the scenario, since we observed a candidate counterpart brighter than V25.5 for other 80 % of the X–ray sources. The estimated lower limits of the X–ray–to–optical flux ratios of the remaining sources are rather high and some of them potentially in agreement with the expected value for an INSs. Therefore, this sample of sources is very promising in order to find the counterpart of the two unidentified EGRET sources and will be the object of further, deeper investigations.
References
- Baldi et al. (2002) Baldi A. et al., 2002, Ap.J., 564, 190
- Bignami and Caraveo (1996) Bignami G.F. and Caraveo P.A., 1996, Ann. Rev. Astr. Astroph., 34, 331
- Caraveo (2001) Caraveo P.A., 2001, Gamma–Ray Astrophysics, 4–6 April, 2001 Baltimore (MD), AIP Proceedings, 587, 641, astro-ph/0107370
- Chieregato (2004) Chieregato M. et al., 2004, A&A submitted
- Hatziminaoglou et al. (2000) Hatziminaoglou E. et al., 2000, A&A, 359, 9
- La Palombara et al. (2003) La Palombara et al., 2003, Recent Res. Devel. Astronomy & Astrophys., 1, 739
- Mirabal and Halpern (2001) Mirabal N. and Halpern J.P., 2001, Ap.J., 547, L137
- see Schirmer et al. (2003 for the description of the data processing) Schirmer M. et al., 2003, A&A, 407, 869
- Strüder et al. (2001) Strüder L. et al., 2001, A&A, 365, L18
- Turner et al. (2001) Turner M.J.L. et al., 2001, A&A, 365, L27
- Zickgraf et al. (2003) Zickgraf F.J. et al., 2003, A&A, 406, 535