Properties of Molecular Gas in Massive Low Surface Brightness Galaxies,
Including New 12CO Observations of Three Malin 1 ‘Cousins’
Abstract
To date, the only low surface brightness (LSB) galaxies which have been detected in CO are the Massive LSB (MLSB) galaxies. In 2003, O’Neil, Schinnerer, & Hofner hypothesized that is the prominent bulge component in MLSB galaxies, not present in less massive low surface brightness galaxies, which gives rise to the detectable quantities of CO gas. To test this hypothesis, we have used the IRAM 30m telescope to obtain three new, deep CO J(10) and J(21) observations of MLSB galaxies. Two of the three galaxies observed were detected in CO – one in the J(10) line and the other in both the J(10) and J(21) lines, bringing the total number of MLSB galaxies with CO detections to 5, out of a total of 9 MLSB galaxies observed at CO to date. The third object had no detection to 2 mK at CO J(10). Comparing all MLSB galaxy CO results with surveys of high surface brightness galaxies, we find the MLSB galaxies’ M and M/MHI values fall within the ranges typically found for high surface brightness objects, albeit at the low end of the distribution, with the two MLSB galaxies detected at CO in this survey having the highest M/MHI values yet measured for any LSB system, by factors of 2–3.
1 Introduction
Despite more than a decade of study, the star formation processes within low surface brightness (LSB) galaxies, those objects with central surface brightness at least 1 magnitude fainter than the night sky (uncorrected for inclination), remain enigmatic. The general properties of LSB galaxies – blue colors, high gas mass-to-luminosity ratios, and low metallicities – lead to the conclusion that LSB systems are under-evolved compared to their high surface brightness (HSB) counterparts. When combined with the low gas density (typically ) and low baryonic-to-dark matter content typical of LSB systems, the question can be raised not of why LSB galaxies are under-evolved, but instead of how LSB systems form stars at all (O’Neil, Schinnerer, & Hofner 2003, and references therein).
One of the primary methods for studying the star formation rate and efficiency in galaxies is through study of the galaxies’ interstellar medium (ISM), and one mechanism for studying a galaxy’s ISM is through observing its CO content. Until recently, all attempts at detecting CO in LSB systems had been unsuccessful (Braine, Herpin, & Radford, 2000; de Blok & van der Hulst, 1998; Schombert, et al., 1990), leading to speculation as to why LSB galaxies appear to lack molecular gas. However, in the past three years the first detections of CO in LSB galaxies have been made, giving the first look into the ISM of LSB systems (O’Neil, Schinnerer, & Hofner, 2003; O’Neil & Schinnerer, 2003; O’Neil, Hofner, & Schinnerer, 2000).
While the three detections to date of CO gas in LSB galaxies are of considerable importance, it is clear further study is paramount to understand LSB systems – knowing the CO content of only three LSB galaxies does not provide enough information to understand the molecular gas content of LSB systems as a whole. To aid in our understanding, we undertook CO observations of three additional LSB galaxies, with properties similar in most respects to the properties of the LSB galaxies with detected CO. The results of those observations are described herein.
| Name | Type | MB | D25 | i | log() | Neighborsa | |||
|---|---|---|---|---|---|---|---|---|---|
| [mag arcsec-2] | [mag] | [kpc] | [∘] | [km s-1] | [km s-1] | ||||
| Observations from this paper | |||||||||
| UGC 04144 | Sc | 24.41,b | -20.0 | 42 | 83 | 9.91 | 97951 | 4941 | 1 |
| UGC 05440 | Sd | 25.71,b | -20.5 | 96 | 65 | 10.81 | 189321 | 5311 | 0 |
| UGC 06124 | S | 26.01,b | -19.9 | 81 | 82 | 10.31 | 139701 | 5831 | 0 |
| Previous Detections | |||||||||
| UGC 01922 | S? | c | -19.8 | 59 | 38 | 10.331 | 108941 | 11201,d | 2 |
| UGC 12289 | Sd | 23.3 | -19.7 | 57 | 22 | 10.131 | 101601 | 4881 | 2 |
| P06-1 | Sd | 23.2 | -18.6 | 29 | 70 | 9.87 | 10882 | 458 | 1 |
| Previous Non-detections | |||||||||
| UGC 06968 | Sc | c | -21.1 | 48 | 71 | 10.30 | 8232 | 574 | 3 |
| LSBC F582-2 | Sbc | c | 41 | 66 | 9.99 | 7043 | 310 | 1 | |
| Malin 1 | S | 26.4 | -21.4 | 240 | 20 | 10.6 | 24733 | 710 | 0 |
Note. — Unless otherwise noted, properties are from O’Neil, Schinnerer, & Hofner (2003) and references therein.
aThe number of galaxies within a 750 kpc/2,000 radius, as found with NED. bA measured for this galaxy is not available. The central surface brightness is defined as , where is the photographic magnitude from the UGC, D is the diameter in arcmin, 8.89 is the conversion from arcmin to arcsec, and 0.26 is an average conversion from mpg to mB (Bothun, et al., 1985).
cThe classification of this galaxy as an LSB galaxy is from Schombert (1998).
dThe velocity width for UGC 01922 uncorrected for inclination is 690 (Giovanelli & Haynes, 1985).
References. — 1O’Neil, et al. (2004);
| Name | RA | DEC | † | † |
|---|---|---|---|---|
| [J2000] | [J2000] | [mK] | [mK] | |
| UGC 04144 | 07:59:27.3 | 07:26:30.0 | 3.4 | 2.0 |
| UGC 05440 | 10:05:35.9 | 04:16:45.0 | 1.7 | 3.4 |
| UGC 06124 | 11:03:39.5 | 31:51:30.0 | 2.0 | 2.6 |
Note. — †R.m.s. estimates are from the smoothed data (26.9 resolution).
2 Observations
As mentioned above, the three sources observed for this project have properties similar to those of the three LSB galaxies which previously have been detected in CO. That is, all three galaxies observed fall into the category of Massive LSB (MLSB) galaxies, or ‘Malin 1’ cousins (named after the largest and most famous of the MLSB galaxies), with M M⊙, W 450 , M18.5, and D50 kpc. A complete description of the previously known properties of all MLSB galaxies observed at CO, including those observed for this paper are given in Table 1.
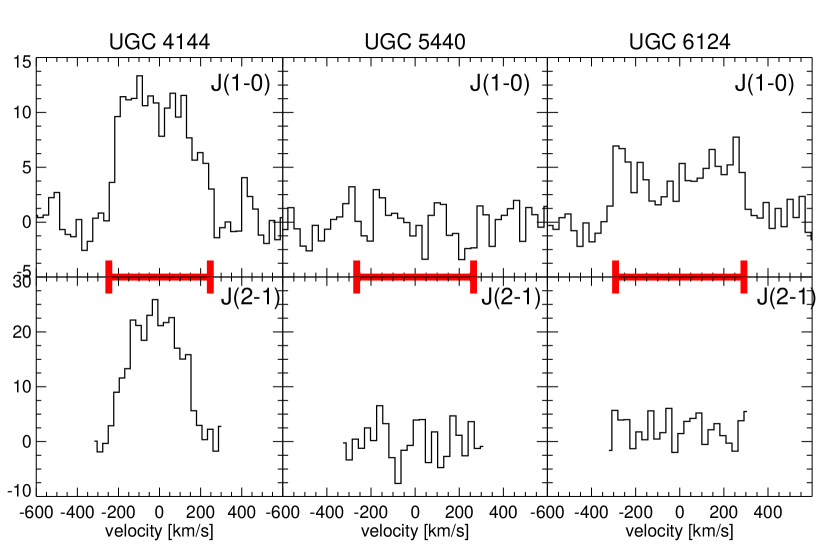
The CO J(1–0) and J(2–1) rotational transitions of the galaxies were observed using the IRAM 30m telescope in the period from 7-8 March, 2003. Table 2 lists the adopted positions (determined using the digitized Palomar sky survey plates and accurate to 2-3′′) and heliocentric velocities (O’Neil, et al., 2004) for our target sources. The beams (22′′ at 110 GHz) were centered on the nucleus of each galaxy. This resulted in a coverage of the inner 14, 27, and 24 kpc for UGC 04144, UGC 05440, and UGC 06124, respectively. Pointing and focus were checked every hour and pointing was found to be within the telescope limits (better than ). For each source both transitions were observed simultaneously with two receivers. Both back ends were set using with 510 MHz bandwidth and 1.25 MHz resolution, resulting in an unsmoothed resolutions of 3.36 and 1.68 for the 3mm and 1mm observations, respectively. For data reduction, the lines were smoothed to 26.9 resolution. Each target was observed on-source for a total of 66 minutes.
All observations used the wobbling secondary with the maximal beam throw of . The image side band rejection ratios were measured to be dB for the mm SIS receivers and dB for the mm SIS receivers. The data were calibrated using the standard chopper wheel technique (Kutner & Ulich, 1981) and are reported in main beam brightness temperature TMB. Typical system temperatures during the observations were 170–190K and 350–450K in the mm and mm band, respectively. All data reduction was done using CLASS – the Continuum and Line Analysis Single-dish Software developed by the Observatoire de Grenoble and IRAM (Buisson, et al., 2002).
3 Results
Two of the three galaxies observed, UGC 04144 and UGC 06124, were detected in CO while the third galaxy, UGC 05440, was not detected, with an upper limit of 0.82 K and MM⊙(Figure 1). Due to its distance (vHEL=18932 ), the upper M limit placed on UGC 05440 was too high for any significance. However, the limit placed on M/MHI is low for a galaxy of its luminosity. Table Properties of Molecular Gas in Massive Low Surface Brightness Galaxies, Including New 12CO Observations of Three Malin 1 ‘Cousins’ lists the CO properties of all three objects, as determined by our observations. For comparison with previous studies (O’Neil, Schinnerer, & Hofner 2003, and references therein) we used a standard CO H2 conversion factor (X) of adopted from Sanders, et al. (1986). As discussed in O’Neil, Hofner, & Schinnerer (2000), this assumption does not include dependence based on the structure of the ISM, metallicity, etc. A discussion of any errors which may arise due to this assumption can be found in O’Neil, Schinnerer, & Hofner (2003).
Of the three galaxies observed, UGC 04144 is the most nearby, making it unsurprising that UGC 04144’s J(10) flux is considerably higher than that found for the other galaxies. However, it is notable that both UGC 04144 and UGC 06124 have M/MHI values considerably higher than is found for the other MLSB galaxies with CO detections. Before these observations, the average value of M/MHI for the MLSB galaxies was 0.08. In contrast, UGC 06124 has M/MHI = 0.14 and UGC 04144 has M/MHI = 0.38. Comparing these galaxies with the other MLSB galaxies observed, both those with and without CO detections, shows very little differences in their properties. All galaxies observed have similar morphologies (Sc/Sd), colors (from U through K – NED111NED is the NASA Extragalactic Database, available online at http://nedwww.ipac.caltech.edu/), H I masses, and total (dynamic) masses. Two of the MLSB galaxies have both 1.4 GHz continuum and IRAS detections – UGC 04144 (f1.4GHz=4.7 mJy, f60μm=0.40 Jy) and UGC 01922 (f1.4GHz=38.5 mJy), f60μm=0.33 Jy (Condon, et al., 1998; Beichman, et al., 1988; Moshir, et al., 1992), but UGC 01922 has M/MHI of only 0.07. Similarly, the number of neighboring galaxies does not seem to alter the quantity of molecular in within these galaxies. UGC 04144 has one nearby neighbor (NGC 02499, at a distance of 350 kpc and =185 ), while UGC 06124 has no galaxies within a 750 kpc/2,000 radius (Table 1).
The single quantity which does appear to distinguish UGC 04144 and UGC 06124 from the other MLSB galaxies observed is their high inclination (i=83∘ and 82∘ for UGC 04144 and UGC 06124, respectively, versus i=22∘, 38∘, and 70∘ for the other three galaxies with CO detections). However, the error for the inclination measurements is 5–10∘, making the inclination of UGC 04144/UGC 06124 comparable to that of [OBC97] P06-1 (i=70∘), UGC 06968 (i=71∘). As a result, while it is possible the high inclination angle has contributed to the higher M/MHI values seen for UGC 04144 and UGC 06124, it is unlikely this is the only explanation. Follow-up H I and CO imaging should help resolve this question.
4 Conclusions – Molecular Gas in LSB Galaxies
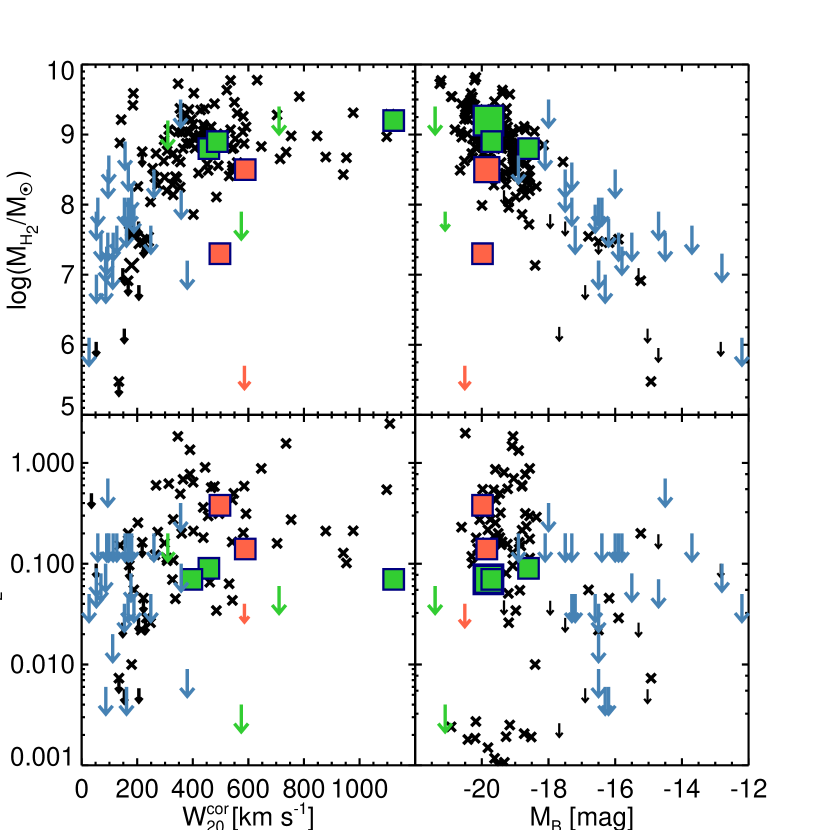
With the results in this paper we have added two more measurements of molecular gas in LSB galaxies, bringing the total number of detections up to five, out of a total of nine MLSB (and 37 LSB galaxies of any type). Figure 2 compares the findings in this paper with all other LSB galaxy CO studies and with a sample of measurements from a variety of other galaxy studies. These include ‘standard’ HSB disk galaxy studies (Boselli, et al., 1996; Casoli, et al., 1996), dwarf galaxy studies (Tacconi & Young, 1987), and a study of extreme late-type spiral galaxies (Matthews & Gao, 2001). In all cases a conversion factor of was used to allow ready comparison between the results.
As can be seen in Figure 2, both the detected CO and upper limits placed on the non-detections (and by inference H2 detections and upper limits) for LSB galaxies fall within the ranges typically found for high surface brightness objects. (The one exception to this, UGC 06968, is described in detail in O’Neil, Schinnerer, & Hofner 2003.) Using the data from Casoli, et al. (1996), Boselli, et al. (1996), and Tacconi & Young (1987) gives =0.510.78 for all HSB galaxies and =0.530.80 for HSB galaxies with M. These numbers, though, are skewed due to the presence of a few galaxies with . Looking instead at the median value for the HSB galaxies with M is =0.27. The MLSB galaxies with CO detections have =0.07 – 0.5, with =0.09, within the range of the values for the HSB galaxies, albeit a bit lower. As no correction has been made to the MLSB galaxy data to account for surveying only the central 10-25 kpc of each galaxy for CO, the fact that the MLSB galaxies’ M/MHI appears to be somewhat lower than that found for the HSB galaxies cannot be considered significant.
It is also clear from Figure 2 that the only LSB galaxies which have been detected at CO are the massive LSB galaxies. Unlike their less massive counterparts which often have little or no central concentration of matter, the higher gravitational potential at the center of MLSB galaxies typically results in a dense central bulge. O’Neil, Schinnerer, & Hofner (2003) speculate that it is within this high density region that the star formation history of massive LSB galaxies most readily mimics that of HSB galaxies, resulting in an overall higher star formation rate, and producing the molecular gas detected. This speculation is given considerable more weight with our most recent observations. Previously, detection of molecular gas in LSB galaxies seemed like an impossible task, with the first CO detection occurring only after 10 years of searching. Yet in this paper we described observing only three LSB galaxies and detecting CO in two of the three – a 67% detection rate. As all three sources were chosen using the criteria described in O’Neil, Schinnerer, & Hofner (2003) – LSB galaxies with high dynamical masses, M, and large central bulges – it would appear O’Neil et al.’s speculation has merit. The high detection rate shows we are now able to reliably find CO gas within the central region of MLSB galaxies.
References
- Beichman, et al. (1988) Infrared Astronomical Satellite (IRAS) Catalogs and Atlases, vol. 1 1988, ed. C. Beichman, et al., NASA RP-1190 (Washington, DC: GPO)
- de Blok & van der Hulst (1998) de Blok, W.J.G, & van der Hulst, J.W. 1998 A&A 336, 49
- Boselli, et al. (1996) Boselli, A., Mendes de Oliveira, C., Balkowski, C., Cayatte, V., Casoli, F. 1996 A&A 314, 738
- Bothun, et al. (1985) Bothun, G., Beers, T., Mould, J., & Huchra, J. 1985 AJ 90 2487
- Braine, Herpin, & Radford (2000) Braine, J., Herpin, F., & Radford, S. J. E. 2000 A&A 358 494
- Buisson, et al. (2002) Buisson, G., et al. (2002) CLASS Continuum and Line Analysis System Handbook, online at http://iram.fr/GS/class/class.html
- Casoli, et al. (1996) Casoli, F., Dickey, J., Kazes, I., Boselli, A., Gavazzi, G., Jore, K. 1996 A&AS 116, 193
- Condon, et al. (1998) Condon, J., et al. 1998 AJ 115, 1693
- Giovanelli & Haynes (1985) Giovanelli, R. & Haynes, M. 1985 AJ 90, 2445
- Kutner & Ulich (1981) Kutner, M. L. & Ulich B. L. 1981, ApJ 250 341
- Matthews & Gao (2001) Matthews, L. & Gao, Y. 2001 ApJ 549, L191
- Moshir, et al. (1992) Moshir, M. et al. 1992, Explanatory Supplement to the IRAS Faint Source Survey, version 2, JPL D-10015 8/92 (Pasadena: JPL).
- O’Neil, et al. (2004) O’Neil, K., Bothun, G., van Driel, W., & Monnier-Ragnine, D. 2004 A&A, accepted
- O’Neil, Schinnerer, & Hofner (2003) O’Neil, K., Schinnerer, E., & Hofner 2003 ApJ 588, 230
- O’Neil & Schinnerer (2003) O’Neil, K. & Schinnerer, E. 2003 ApJL 588, 35
- O’Neil, Hofner, & Schinnerer (2000) O’Neil, K., Hofner, P., & Schinnerer, E. 2000, ApJL 545, L99
- Sanders, et al. (1986) Sanders, D., Scoville, N., Young, J., Soifer, B., Schloerb, F., Rice, W., & Danielson, G. 1986 ApJ 305, L45
- Schombert (1998) Schombert, J. 1998 AJ 116, 1650
- Schombert, et al. (1990) Schombert, J., Bothun, Gregory D., Impey, Chris D., & Mundy, Lee G. 1990 AJ 100, 1523
- Tacconi & Young (1987) Tacconi, L. & Young, J. 1987 ApJ 322, 681
| Galaxy | Line | Width | ) | |||
|---|---|---|---|---|---|---|
| [K km s-1] | [km s-1] | [km s-1] | ||||
| Observations from this paper | ||||||
| UGC 04144 | 10 | 3.56 | 9797 | 430 | 7.3 | 0.38 |
| UGC 04144 | 21 | 7.17 | 9763 | 429 | 9.0 | 0.20 |
| UGC 05440 | 10 | 0.50 | 5.7 | |||
| UGC 05440 | 21 | 0.59 | 5.6 | |||
| UGC 06124 | 10 | 1.72 | 13940 | 517 | 8.5 | 0.14 |
| UGC 06124 | 21 | 0.78 | 7.9 | |||
| Previous Detections | ||||||
| UGC 019221 | 10 | 1.38 | 10795 | 404 | 9.2 | 0.07 |
| UGC 019221 | 21 | 2.96 | 10802 | 403 | 8.9 | 0.04 |
| UGC 122891 | 10 | 1.16 | 10162 | 200 | 9.0 | 0.07 |
| UGC 122891 | 21 | 0.69 | 10185 | 201 | 8.2 | 0.01 |
| P06-12 | 10 | 0.95 | 10904 | 302 | 8.8 | 0.09 |
| P06-12 | 21 | 1.14 | 10903 | 216 | 8.3 | 0.03 |
| Previous Non-detections | ||||||
| UGC 069681 | 10 | 0.21 | 7.9 | 0.004 | ||
| UGC 069681 | 21 | 0.58 | 7.8 | 0.003 | ||
| LSBC F582-22 | 10 | 0.54 | 9.2 | 0.2 | ||
| Malin 12 | 10 | 0.15 | 9.4 | 0.06 | ||
| Malin 12 | 21 | 0.35 | 8.7 | 0.01 | ||
Note. — Non-detection limits are (N = the number of channels, TMB is the 1 rms main beam temperature).
As described in Section 3, conversion to M was done using