Deep VLT spectroscopy of the blue compact dwarf galaxies Tol 1214–277 and Tol 65††thanks: Based on observations obtained at the European Southern Observatory, Paranal, Chile (ESO Programs 63.P-0003 and 65.N-0642)
We present VLT spectroscopic observations with different spectral resolutions and different slit orientations of the two metal-deficient blue compact dwarf (BCD) galaxies Tol 1214–277 and Tol 65. The oxygen abundances in the brightest H ii regions of Tol 1214–277 and Tol 65 are found to be 12 + log O/H = 7.55 0.01 and 7.54 0.01, or /24††thanks: 12+log(O/H)⊙ = 8.92 (Anders & Grevesse Anders89 (1989)).. The nitrogen-to-oxygen abundance ratios in the two galaxies are log N/O = –1.64 0.03 and –1.60 0.02 and lie in the narrow range found for other most metal-deficient BCDs. The helium mass fraction derived in several H ii regions in both galaxies is consistent with a high primordial helium mass fraction, 0.244. We confirm the detection of the high-ionization forbidden emission line [Fe v] 4227 in the spectrum of Tol 1214–277. Additionally, weak [Ne iv] 4725, [Fe vi] 5146, 5177, and [Fe vii] 5721, 6087 emission lines are detected in the high-resolution spectrum of Tol 1214–277. The detection of these lines implies the presence of hard radiation with photon energy in the range 4 – 8 Ryd. Emission lines are detected in the spectra of eight galaxies in the fields of Tol 1214–277 and Tol 65. Seven of these galaxies are background objects, while one galaxy has a redshift close to that of Tol 1214–277. Situated at a projected distance of 14.5 kpc from Tol 1214–277, this galaxy is probably a companion of the BCD.††thanks: Tables 2, 3, 4 and 8 are also available in electronic form at the CDS via anonymous ftp to cdsarc.u-strasbg.fr (130.79.128.5) or via http://cdsweb.u-strasbg.fr/cgi-bin/qcat?J/A+A/
Key Words.:
galaxies: starburst – galaxies: abundances – galaxies: individual (Tol 1214–277, Tol 65)1 Introduction
| Field | Date | Slit # | Spectral elements | Spectral range | Slit | P.A. | Exposure | Airmass | Seeing |
|---|---|---|---|---|---|---|---|---|---|
| Tol 1214–277 | 18.05.1999 | 1 | G300V + GG 375 | 3600–7400Å | 1″ | 39∘ | 2660 s | 1.7 | 069 |
| 25.06.2000 | 1 | G300V + GG 375 | 3600–7400Å | 1″ | 39∘ | 2900 s | 1.5 | 112 | |
| 28.06.2000 | 2 | G300V + GG 375 | 3600–7400Å | 1″ | 73∘ | 2900 s | 1.5 | 104 | |
| 25.06.2000 | 3 | G600B | 3600–5400Å | 1″ | 154∘ | 3900 s | 1.1 | 133 | |
| 25.06.2000 | 3 | G600R + GG 435 | 5300–7400Å | 1″ | 154∘ | 2900 s | 1.2 | 161 | |
| Tol 65 | 15.05.1999 | 4 | G300V + GG 375 | 3600–7400Å | 1″ | 135∘ | 2420 s | 1.4 | 034 |
| 30.06.2000 | 5 | G300V + GG 375 | 3600–7400Å | 1″ | 51∘ | 2900 s | 1.6 | 080 | |
| 30.06.2000 | 6 | G600B | 3600–5400Å | 1″ | 129∘ | 3900 s | 1.2 | 096 | |
| 30.06.2000 | 6 | G600R + GG 435 | 5300–7400Å | 1″ | 129∘ | 2900 s | 1.3 | 103 |


Detailed spectroscopic studies of extremely metal-poor local blue compact dwarf (BCD) galaxies based on observations with large telescopes are useful to derive accurately their element abundances and shed light on the properties and origin of these galaxies. BCDs may be considered local counterparts to high-redshift nearly primordial star-forming galaxies because of their low metallicity and active star formation. Spectroscopic studies of other galaxies in the field of BCDs are aimed at searching for companion galaxies. Such a companion galaxy has been found, e.g. for the second most metal-deficient BCD known, SBS 0335–052, at a projected distance of 22 kpc (Pustilnik et al. PU97 (1997, 2001); Lipovetsky et al. L99 (1999)). The gravitational interaction between the galaxies in such pairs has been suggested as a triggering mechanism of star formation in BCDs (Pustilnik et al. PU01 (2001); Noeske et al. N01 (2001)).
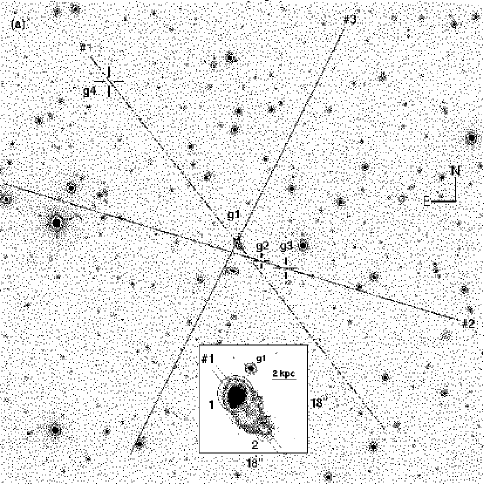
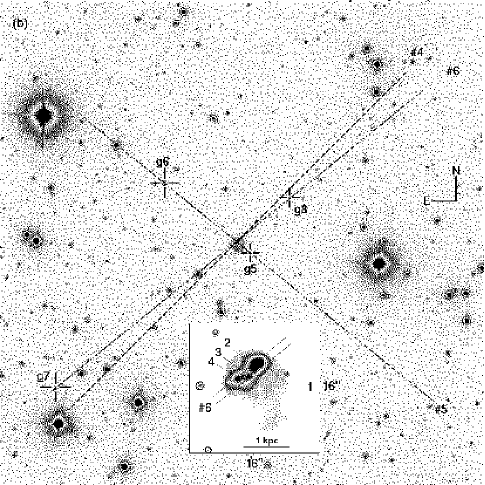
We focus here on two BCDs, Tol 1214–277 Tol 21 and Tol 65 Tol 1223–359 ESO 380 – G027. Using deep VLT imaging of these BCDs, Fricke et al. (F01 (2001)) and Papaderos et al. (P99 (1999)) have studied their morphological properties. In Tol 1214–277, a very bright and compact star-forming region (region 1 in the inset of Fig. 1, left panel) at the north-eastern edge of the galaxy is embedded in a relatively blue extended low-surface-brightness (LSB) component with some other fainter star-forming regions (Fricke et al. F01 (2001)). As for Tol 65, Papaderos et al. (P99 (1999)) have found several regions of star formation in the northern part (see inset in Fig. 1, right panel), also embedded in a relatively blue LSB component. The distances to Tol 1214–277 and Tol 65 are respectively 103.9 Mpc and 36.0 Mpc, using the observed radial velocities of 7795 km s-1 and 2698 km s-1 and assuming a Hubble constant = 75 km s-1 Mpc-1 (Thuan & Izotov TI97 (1997)). The presence of massive stars in these BCDs is indicated by strong nebular lines (Izotov et al. 2001a ) and, in the case of Tol 1214–277, by a UV stellar N v 1240 line with a P Cygni profile (Thuan & Izotov TI97 (1997)).
The very low metallicity of Tol 1214–277 and Tol 65 has been established by earlier spectroscopic work (Kunth & Sargent K83 (1983); Campbell, Terlevich & Melnick C86 (1986); Pagel et al. P92 (1992); Masegosa, Moles & Campos-Aguilar M94 (1994)). Recently, Fricke et al. (F01 (2001)) and Izotov et al. (2001a ) using VLT and Keck spectroscopic observations have derived the oxygen abundance 12 + log O/H = 7.52 and 7.54 in Tol 1214–277, and Izotov et al. (2001a ) have found 12 + log O/H = 7.54 in Tol 65. Hence these two galaxies are the most metal-deficient BCDs known in the Southern hemisphere, after SBS 0335–052 with 12 + log O/H = 7.30 (Izotov et al. 1997b ). We present here new VLT spectroscopic observations of these two BCDs to pursue two problems. The first one concerns the N/O abundance ratio. Pagel et al. (P92 (1992)) have measured the nitrogen-to-oxygen abundance ratio in Tol 65 to be log N/O = –1.81 0.15, significantly lower than the mean value log N/O –1.60 0.02 obtained by Thuan et al. (TIL95 (1995)) and Izotov & Thuan (IT99 (1999)) for low-metallicity BCDs with 12 + log O/H 7.6. On the other hand, the N/O abundance ratio in Tol 1214–277 is similar to that of other BCDs. Recently, Izotov et al. (2001a ) using low-resolution Keck spectra of Tol 1214–277 and Tol 65 have found log N/O = –1.64 for both galaxies, more in line with other low-metallicity BCDs. To understand the origin of nitrogen in a low-metallicity environment (e.g., Meynet & Maeder MM02 (2002)), it is important to check these results with new high-quality spectroscopic data with better spectral resolution.
The second problem concerns the nature of the hard radiation field in low-metallicity BCDs. Tol 1214–277 shows the strongest He ii 4686 emission among all known star-forming emission-line galaxies. This suggests that the radiation field in the BCD is very hard, with a significant amount of the ionizing photons at 228Å, equivalent to a photon energy 4 Ryd. Fricke et al. (F01 (2001)) have discovered the high-ionization [Fe v] 4227 emission line in the spectra of Tol 1214–277 and SBS 0335–052, further supporting the presence of hard radiation in the star-forming regions of low-metallicity BCDs. They have proposed that the main source of radiation at 228Å are fast shocks. Later Izotov, Chaffee & Schaerer (2001b ) confirmed the presence of the [Fe v] 4227 emission line in the spectrum of SBS 0335–052 and found some other high-ionization [Fe v] – [Fe vii] emission lines. The source of highly ionized iron is not yet well established and new high signal-to-noise spectroscopic observations are necessary to understand the main sources of high ionization.
In the following, we investigate the spectral properties of Tol 1214–277 and Tol 65 with new deep VLT data. In Sect. 2 we describe the data, and in Sect. 3 we discuss the chemical abundances. High-ionization emission lines and the origin of hard radiation in Tol 1214–277 are discussed in Sect. 4. The properties of the emission-line galaxies in the fields of Tol 1214–277 and Tol 65 are discussed in Sect. 5. We summarize our results in Sect. 6.
2 Observations and data reduction
Spectroscopic data for Tol 1214–277 and Tol 65 with different position angles (P.A.) were taken with VLT/FORS 1 in service mode during two observing periods, on 15 – 18 May, 1999 and 25 – 30 June, 2000 (Table 1). The positions of the slits are shown in Fig. 1. Low-resolution spectra were obtained with the G300V grism and the GG 375 second-order blocking filter. This yields a spatial resolution along the slit of 02 pixel-1, a scale perpendicular to the slit of 2.6 Å pixel-1, a spectral coverage of 3600 – 7400 Å, and a spectral resolution of 10 Å (FWHM). High-resolution spectra have been obtained separately for the blue and red parts with the grisms G600B and G600R respectively, giving a spatial resolution along the slit of 02 pixel-1, a scale perpendicular to the slit of 1.2 Å pixel-1, and a spectral resolution of 5 Å (FWHM). The spectra in the red parts were obtained with a GG 435 second-order blocking filter. The spectral coverage was 3600 – 5400 Å in the blue and 5300 – 7400 Å in the red. A 1″ 400″ slit was used for all observations. The airmass during the observations varied from 1.1 to 1.7. The positions of the slits were chosen to go through all brightest H ii regions in both BCDs and some suspected emission-line galaxies in the fields of Tol 1214–277 and Tol 65 (Fig. 1, Table 1). With the total exposure times shown in Table 1, the spectra have a signal-to-noise ratio S/N 50 in the continuum of the brightest parts of the BCDs. They were broken up into two subexposures, to allow for cosmic-ray removal. A spectrum of a He-Ne-Ar comparison lamp was obtained for wavelength calibration.
Data reduction was carried out using the IRAF111IRAF: the Image Reduction and Analysis Facility is distributed by the National Optical Astronomy Observatory. software package. This included bias subtraction, cosmic-ray removal, flat-field correction, wavelength calibration and night-sky emission subtraction. Spectrophotometric standard stars were observed during the same nights with 2″ wide slits. However, because of hardware problems of the spectrograph those spectra were shifted by 300 pixels along the dispersion axis compared to object spectra, and were therefore unusable. The flux calibration was done using calibrated spectra of Tol 1214–277 and Tol 65 obtained previously by Izotov et al. (2001a ) with the Keck telescope. For this, we removed the emission lines and obtained the continuum distributions for both the flux-calibrated Keck and uncalibrated VLT spectra. The transformation curve to flux-calibrate the VLT spectra is then obtained by dividing one continuum by the other.
3 Chemical abundances
We derive the element abundances in the brightest H ii regions of Tol 1214–277 and Tol 65 using all available data obtained during the two periods of observations. The seeing during the observations varied over a wide range, from 034 to 161 (FWHM). We were able to extract one-dimensional spectra of all four regions from the low-resolution long-slit spectrum of Tol 65, obtained on 15 May 1999 (slit #4) with exceptionally good seeing (034 FWHM). However, the seeing during the high-resolution spectroscopic observations of Tol 65 on 30 June, 2000 (slit #6) was not as good (103 FWHM), so that we were able to extract only one-dimensional spectra for the combined regions (1+2) and (3+4). The one-dimensional spectra from the low-resolution long-slit spectrum of Tol 65 were extracted within an aperture of 1″ 1″. In all other cases, the spectra were extracted within an aperture of 2″ 1″.
The emission line fluxes were measured with the IRAF SPLOT routine using Gaussian profile fitting. The errors of the line fluxes are defined by the total photon counts in each line and are derived from the non-flux-calibrated spectra. They have been propagated in the calculations of the elemental abundance errors. Fluxes have been corrected for underlying stellar absorption (for hydrogen lines) and interstellar extinction using the observed Balmer decrement, following the procedure described by Izotov et al. (ITL94 (1994); 1997a ). This is done by minimizing the deviations of the hydrogen emission line fluxes corrected for extinction and underlying absorption, from their theoretical values. All non-blended hydrogen emission lines were used. The Whitford (W58 (1958)) reddening law was adopted.
3.1 Emission-line fluxes
3.1.1 High-resolution spectra
The spectrum of the brightest region 1 of Tol 1214–277 was obtained with slit #3 (Fig. 1), oriented roughly perpendicular to the major axis of the galaxy. It is shown in Fig. 2. The spectrum is dominated by very strong emission lines, reflecting the ongoing star formation activity. Because of the high signal-to-noise ratio and the high spectral resolution, several weak permitted and forbidden nebular emission lines are present in the spectrum. The emission lines [O i] 6300 and [S iii] 6312, H 6563 and [N ii] 6583 are well separated, allowing for a reliable determination of sulfur and nitrogen abundances. Remarkable spectral features are the nebular high-ionization He ii 4686, 5411 and [Fe v] 4227 emission lines discussed by Fricke et al. (F01 (2001)) and suggesting the presence of a very hard radiation with photon energies 4 Ryd in the BCD. In addition to these findings, we detect the [Ne iv] 4725 emission line and weak [Fe vi] 5146, 5177, [Fe vii] 5721, 6087 emission lines. This makes Tol 1214–277 the second known BCD, after SBS 0335–052 (Izotov et al. 2001b ), with detected [Fe vi] – [Fe vii] emission lines.
The corrected fluxes and equivalent widths of emission lines together with the extinction coefficient (H), the absolute flux (H) of the H emission line and the equivalent width (abs) of hydrogen absorption lines for region 1 of Tol 1214–277 are listed in Table 2.
The high resolution spectra of regions 1+2 and 3+4 in Tol 65 were obtained with slit #6 (Fig. 1) oriented along the chain of star-forming regions in the northern part of the galaxy and are shown, respectively, in Fig. 3 and 4. As for the spectrum of region 1 in Tol 1214–277, they are characterised by strong emission lines. However, the emission lines of the high ionization ions, except for the He ii 4686 emission line, are not present in the spectra of these regions implying milder ionizing radiation as compared to Tol 1214–277. The corrected fluxes and the equivalent widths of emission lines together with the extinction coefficient (H), the absolute flux (H) of the H emission line and the equivalent width (abs) of hydrogen absorption lines for regions 1+2 and 3+4 of Tol 65 are listed in Table 2. Note that the flux of the He ii 4686 emission line relative to H is stronger in the more evolved starbursts of regions 3+4, with lower equivalent width of H, as compared to the younger bursts in regions 1+2.
We derive a redshift = 0.02603 0.00008 for region 1 in Tol 1214–277 using the 44 brightest emission lines. As for Tol 65, redshifts = 0.00974 0.00010 for regions 1+2, using the 40 brightest lines, and = 0.00966 0.00010 of regions 3+4, using the 29 brightest lines, are obtained.
| Tol 1214–277 | Tol 65 | |||||||
| region 1 | regions 1+2 | regions 3+4 | ||||||
| (Å) Ion | ()/(H) | (Å) | ()/(H) | (Å) | ()/(H) | (Å) | ||
| 3704 H16 | 0.0153 0.0018 | 2.0 0.2 | … | … | … | … | ||
| 3712 H15 | 0.0160 0.0017 | 2.2 0.1 | … | … | … | … | ||
| 3727 [O ii] | 0.3584 0.0061 | 47.8 0.4 | 0.5561 0.0092 | 97.8 0.4 | 0.7865 0.0177 | 37.2 1.3 | ||
| 3750 H12 | 0.0328 0.0018 | 5.0 0.2 | 0.0574 0.0027 | 5.0 0.2 | 0.0454 0.0298 | 0.8 0.6 | ||
| 3770 H11 | 0.0419 0.0018 | 6.2 0.2 | 0.0660 0.0026 | 6.1 0.2 | 0.0514 0.0262 | 1.1 0.6 | ||
| 3798 H10 | 0.0590 0.0020 | 8.9 0.2 | 0.0797 0.0025 | 8.2 0.2 | 0.0675 0.0201 | 1.9 0.6 | ||
| 3820 He i | 0.0132 0.0015 | 2.0 0.2 | 0.0102 0.0012 | 2.0 0.2 | … | … | ||
| 3835 H9 | 0.0639 0.0020 | 9.9 0.2 | 0.0946 0.0025 | 11.5 0.2 | 0.0749 0.0166 | 2.1 0.6 | ||
| 3868 [Ne iii] | 0.3739 0.0062 | 57.5 0.4 | 0.2816 0.0047 | 48.8 0.3 | 0.2932 0.0088 | 12.8 0.7 | ||
| 3889 H8 + He i | 0.2182 0.0040 | 35.1 0.3 | 0.2125 0.0039 | 35.5 0.3 | 0.2058 0.0147 | 8.4 0.6 | ||
| 3968 [Ne iii] + H7 | 0.3192 0.0054 | 54.2 0.4 | 0.2790 0.0049 | 42.0 0.3 | 0.2553 0.0155 | 10.3 0.6 | ||
| 4026 He i | 0.0196 0.0010 | 3.4 0.2 | 0.0158 0.0010 | 2.9 0.2 | 0.0132 0.0053 | 0.6 0.4 | ||
| 4068 [S ii] | 0.0051 0.0010 | 0.9 0.2 | 0.0095 0.0010 | 1.6 0.2 | … | … | ||
| 4101 H | 0.2814 0.0047 | 52.6 0.4 | 0.2719 0.0046 | 48.8 0.3 | 0.2691 0.0134 | 12.7 0.6 | ||
| 4227 [Fe v] | 0.0068 0.0008 | 1.4 0.2 | … | … | … | … | ||
| 4340 H | 0.4981 0.0078 | 111.5 0.6 | 0.4661 0.0073 | 96.8 0.5 | 0.4714 0.0134 | 27.3 0.7 | ||
| 4363 [O iii] | 0.1775 0.0031 | 40.5 0.4 | 0.0975 0.0020 | 22.7 0.3 | 0.0941 0.0044 | 5.5 0.6 | ||
| 4389 He i | 0.0049 0.0009 | 1.2 0.2 | 0.0036 0.0009 | 1.0 0.2 | … | … | ||
| 4471 He i | 0.0364 0.0011 | 9.2 0.3 | 0.0352 0.0011 | 8.7 0.2 | 0.0312 0.0034 | 2.0 0.4 | ||
| 4658 [Fe iii] | 0.0039 0.0008 | 1.1 0.2 | 0.0052 0.0007 | 1.4 0.2 | 0.0072 0.0027 | 0.5 0.4 | ||
| 4686 He ii | 0.0531 0.0013 | 15.2 0.3 | 0.0077 0.0009 | 2.2 0.2 | 0.0233 0.0029 | 1.5 0.5 | ||
| 4711 [Ar iv]+He i | 0.0294 0.0010 | 8.6 0.3 | 0.0123 0.0008 | 3.4 0.2 | 0.0079 0.0034 | 0.5 0.3 | ||
| 4725 [Ne iv] | 0.0020 0.0004 | 0.6 0.2 | … | … | … | … | ||
| 4740 [Ar iv] | 0.0187 0.0009 | 5.6 0.3 | 0.0064 0.0006 | 1.8 0.2 | 0.0066 0.0052 | 0.5 0.3 | ||
| 4861 H | 1.0000 0.0149 | 311.6 1.0 | 1.0000 0.0150 | 267.7 0.8 | 1.0000 0.0183 | 77.0 1.0 | ||
| 4922 He i | 0.0093 0.0008 | 3.1 0.2 | 0.0093 0.0007 | 2.9 0.2 | … | … | ||
| 4959 [O iii] | 1.7625 0.0259 | 570.4 1.3 | 1.2645 0.0188 | 355.7 0.9 | 1.1589 0.0190 | 91.1 1.0 | ||
| 4988 [Fe iii] | 0.0046 0.0005 | 1.4 0.2 | 0.0048 0.0005 | 1.4 0.2 | … | … | ||
| 5007 [O iii] | 5.2819 0.0770 | 1696.0 2.2 | 3.7565 0.0555 | 1054.2 1.4 | 3.4617 0.0548 | 279.0 1.6 | ||
| 5146 [Fe vi] | 0.0015 0.0006 | 0.6 0.2 | … | … | … | … | ||
| 5177 [Fe vi] | 0.0008 0.0005 | 0.3 0.2 | … | … | … | … | ||
| 5200 [N i] | 0.0010 0.0006 | 0.4 0.2 | 0.0035 0.0007 | 1.3 0.2 | … | … | ||
| 5271 [Fe iii] | 0.0014 0.0009 | 0.6 0.4 | 0.0027 0.0009 | 1.0 0.3 | … | … | ||
| 5411 He ii | 0.0037 0.0006 | 1.6 0.3 | … | … | … | … | ||
| 5517 [Cl iii] | 0.0022 0.0005 | 1.0 0.3 | 0.0019 0.0004 | 0.8 0.2 | … | … | ||
| 5537 [Cl iii] | 0.0011 0.0005 | 0.5 0.2 | 0.0016 0.0004 | 0.7 0.2 | … | … | ||
| 5721 [Fe vii] | 0.0012 0.0005 | 0.6 0.2 | … | … | … | … | ||
| 5876 He i | 0.0927 0.0018 | 50.4 0.6 | 0.1043 0.0019 | 48.5 0.5 | 0.0966 0.0035 | 12.7 0.8 | ||
| 6087 [Fe vii] | 0.0023 0.0006 | 1.3 0.3 | … | … | … | … | ||
| 6300 [O i] | 0.0080 0.0005 | 5.1 0.3 | 0.0178 0.0006 | 10.1 0.3 | 0.0190 0.0026 | 2.9 0.5 | ||
| 6312 [S iii] | 0.0076 0.0005 | 4.8 0.3 | 0.0114 0.0005 | 6.6 0.3 | 0.0149 0.0018 | 2.3 0.5 | ||
| 6363 [O i] | 0.0032 0.0005 | 2.0 0.3 | 0.0062 0.0006 | 3.7 0.7 | … | … | ||
| 6548 [N ii] | 0.0035 0.0005 | 1.8 0.3 | 0.0061 0.0005 | 2.3 0.2 | … | … | ||
| 6563 H | 2.7389 0.0435 | 1798.1 3.3 | 2.7667 0.0444 | 1601.8 2.5 | 2.6651 0.0458 | 422.4 2.5 | ||
| 6583 [N ii] | 0.0094 0.0006 | 4.7 0.3 | 0.0171 0.0006 | 9.3 0.3 | 0.0214 0.0018 | 4.1 0.7 | ||
| 6678 He i | 0.0249 0.0008 | 18.6 0.5 | 0.0269 0.0007 | 17.4 0.4 | 0.0256 0.0017 | 4.2 0.7 | ||
| 6717 [S ii] | 0.0192 0.0006 | 14.4 0.5 | 0.0503 0.0011 | 32.9 0.5 | 0.0646 0.0022 | 10.8 0.8 | ||
| 6731 [S ii] | 0.0159 0.0006 | 12.0 0.4 | 0.0402 0.0010 | 26.3 0.4 | 0.0439 0.0019 | 7.4 0.8 | ||
| 7065 He i | 0.0256 0.0008 | 22.5 0.6 | 0.0296 0.0008 | 23.0 0.5 | 0.0238 0.0018 | 4.6 0.9 | ||
| 7135 [Ar iii] | 0.0215 0.0007 | 19.0 0.6 | 0.0281 0.0008 | 23.3 0.5 | 0.0315 0.0020 | 6.6 0.9 | ||
| 7281 He i | 0.0050 0.0005 | 4.6 0.4 | 0.0066 0.0005 | 6.1 0.5 | 0.0044 0.0017 | 1.0 0.7 | ||
| 7320 [O ii] | 0.0051 0.0005 | 4.7 0.4 | 0.0115 0.0005 | 11.2 0.4 | 0.0146 0.0017 | 3.2 0.9 | ||
| 7330 [O ii] | 0.0045 0.0004 | 4.2 0.4 | 0.0099 0.0005 | 10.0 0.4 | 0.0124 0.0015 | 2.7 0.9 | ||
| (H) dex | 0.105 0.019 | 0.065 0.019 | 0.000 0.020 | |||||
| (H)a | 1.62 0.01 | 1.64 0.01 | 0.38 0.01 | |||||
| (abs) Å | 0.0 0.2 | 5.9 0.2 | 1.3 0.6 | |||||
ain units 10-14 erg s-1cm-2.
| Region 1 | Region 2 | ||||||||||
| 1999 | 2000 | 1999 | 2000 | ||||||||
| (Å) Ion | ()/(H) | a | ()/(H) | a | ()/(H) | a | ()/(H) | a | |||
| 3727 [O ii] | 0.2370.007 | 40.6 | 0.2850.007 | 42.6 | 1.9280.342 | 53.8 | 1.3610.209 | 40.8 | |||
| 3750 H12 | 0.0440.009 | 4.0 | 0.0340.006 | 4.3 | … | … | … | … | |||
| 3770 H11 | 0.0500.008 | 5.1 | 0.0490.006 | 6.7 | … | … | … | … | |||
| 3798 H10 | 0.0640.007 | 7.5 | 0.0670.006 | 9.5 | … | … | … | … | |||
| 3820 He i | 0.0090.003 | 1.5 | 0.0090.002 | 1.4 | … | … | … | … | |||
| 3835 H9 | 0.0680.003 | 8.2 | 0.0610.005 | 8.7 | … | … | … | … | |||
| 3868 [Ne iii] | 0.3210.006 | 57.4 | 0.3570.007 | 56.4 | … | … | … | … | |||
| 3889 H8 + He i | 0.2080.006 | 35.3 | 0.2160.006 | 34.0 | … | … | … | … | |||
| 3968 [Ne iii] + H7 | 0.2970.007 | 53.6 | 0.3170.007 | 53.5 | … | … | … | … | |||
| 4026 He i | 0.0170.002 | 3.4 | 0.0170.002 | 3.1 | … | … | … | … | |||
| 4068 [S ii] | 0.0060.001 | 1.3 | 0.0090.002 | 1.6 | … | … | … | … | |||
| 4101 H | 0.2630.006 | 52.1 | 0.2770.006 | 53.1 | … | … | … | … | |||
| 4227 [Fe v] | 0.0100.002 | 2.3 | 0.0090.002 | 1.8 | … | … | … | … | |||
| 4340 H | 0.4760.008 | 107.5 | 0.4880.008 | 110.0 | 0.4180.093 | 7.3 | 0.4820.081 | 15.6 | |||
| 4363 [O iii] | 0.1710.003 | 40.6 | 0.1720.003 | 39.8 | … | … | … | … | |||
| 4389 He i | 0.0050.001 | 1.3 | 0.0050.001 | 1.2 | … | … | … | … | |||
| 4471 He i | 0.0330.002 | 8.3 | 0.0370.001 | 10.0 | … | … | … | … | |||
| 4658 [Fe iii] | … | … | 0.0040.001 | 1.1 | … | … | … | … | |||
| 4686 He ii | 0.0570.002 | 16.6 | 0.0530.001 | 15.0 | … | … | … | … | |||
| 4711 [Ar iv]+He i | 0.0330.001 | 9.5 | 0.0320.001 | 9.3 | … | … | … | … | |||
| 4740 [Ar iv] | 0.0230.001 | 6.7 | 0.0200.001 | 6.0 | … | … | … | … | |||
| 4861 H | 1.0000.015 | 320.2 | 1.0000.015 | 315.3 | 1.0000.086 | 32.6 | 1.0000.068 | 50.2 | |||
| 4922 He i | 0.0110.001 | 3.7 | 0.0080.001 | 2.6 | … | … | … | … | |||
| 4959 [O iii] | 1.7100.025 | 580.1 | 1.7360.025 | 571.7 | 0.4930.052 | 20.9 | 0.3800.035 | 16.4 | |||
| 5007 [O iii] | 5.1270.075 | 1794.0 | 5.2200.075 | 1789.0 | 1.4470.102 | 63.7 | 1.3140.073 | 59.7 | |||
| 5200 [N i] | 0.0030.001 | 1.4 | … | … | … | … | … | … | |||
| 5411 He ii | 0.0040.001 | 1.6 | 0.0040.001 | 1.7 | … | … | … | … | |||
| 5876 He i | 0.0900.002 | 50.5 | 0.0950.002 | 49.9 | … | … | … | … | |||
| 6300 [O i] | 0.0100.001 | 6.5 | 0.0090.001 | 5.7 | … | … | … | … | |||
| 6363 [O i] | 0.0030.001 | 2.2 | 0.0030.001 | 2.0 | … | … | … | … | |||
| 6563 H | 2.4010.038 | 1799.0 | 2.7390.043 | 1807.0 | 2.8790.196 | 227.2 | 2.8780.153 | 268.1 | |||
| 6583 [N ii] | 0.0070.001 | 3.7 | 0.0100.001 | 5.7 | … | … | … | … | |||
| 6678 He i | 0.0250.001 | 21.4 | 0.0260.001 | 19.3 | … | … | … | … | |||
| 6717 [S ii] | 0.0160.001 | 13.8 | 0.0180.001 | 13.2 | … | … | … | … | |||
| 6731 [S ii] | 0.0140.001 | 12.3 | 0.0150.001 | 10.6 | … | … | … | … | |||
| 7065 He i | 0.0270.001 | 22.6 | 0.0260.001 | 22.4 | … | … | … | … | |||
| 7135 [Ar iii] | 0.0220.001 | 20.1 | 0.0220.001 | 19.1 | … | … | … | … | |||
| (H) dex | 0.0850.019 | 0.0650.019 | 0.0000.073 | 0.0300.063 | |||||||
| (H)b | 1.690.01 | 1.620.01 | 0.020.01 | 0.020.01 | |||||||
| (abs) Å | 3.50.7 | 0.90.6 | 3.90.6 | 0.11.0 | |||||||
ain Å.
bin units 10-14 erg s-1cm-2.
| Region 1 | Region 2 | Region 3 | Region 4 | ||||||||
| (Å) Ion | ()/(H) | a | ()/(H) | a | ()/(H) | a | ()/(H) | a | |||
| 3727 [O ii] | 0.4490.010 | 91.6 | 0.6840.021 | 78.2 | 0.7390.080 | 18.4 | 0.6140.030 | 33.7 | |||
| 3750 H12 | 0.0300.005 | 6.0 | 0.0190.012 | 2.2 | … | … | … | … | |||
| 3770 H11 | 0.0380.005 | 7.7 | 0.0220.013 | 2.5 | … | … | … | … | |||
| 3798 H10 | 0.0440.005 | 8.5 | 0.0370.013 | 4.3 | … | … | … | … | |||
| 3835 H9 | 0.0620.005 | 12.1 | 0.0590.014 | 6.5 | … | … | … | … | |||
| 3868 [Ne iii] | 0.3130.006 | 60.7 | 0.2500.010 | 26.9 | 0.2780.046 | 5.4 | 0.3040.015 | 14.0 | |||
| 3889 H8 + He i | 0.1800.006 | 33.8 | 0.1770.014 | 19.0 | 0.1890.084 | 1.9 | 0.1530.016 | 7.1 | |||
| 3968 [Ne iii] + H7 | 0.2750.007 | 51.0 | 0.2370.013 | 25.7 | 0.2260.063 | 2.5 | 0.2490.017 | 11.8 | |||
| 4026 He i | 0.0160.002 | 3.0 | … | … | … | … | … | … | |||
| 4068 [S ii] | 0.0090.001 | 1.8 | … | … | … | … | … | … | |||
| 4101 H | 0.2530.006 | 51.6 | 0.2470.012 | 29.1 | 0.2430.052 | 3.6 | 0.2290.014 | 11.9 | |||
| 4340 H | 0.4930.009 | 111.6 | 0.4850.013 | 65.2 | 0.4850.036 | 10.1 | 0.5110.014 | 32.1 | |||
| 4363 [O iii] | 0.1220.003 | 28.0 | 0.0940.005 | 12.8 | 0.0970.029 | 2.3 | 0.1190.008 | 7.4 | |||
| 4389 He i | 0.0050.002 | 1.3 | … | … | … | … | … | … | |||
| 4471 He i | 0.0360.001 | 9.1 | 0.0380.004 | 5.9 | … | … | 0.0220.006 | 1.5 | |||
| 4658 [Fe iii] | 0.0040.001 | 1.1 | … | … | … | … | … | … | |||
| 4686 He ii | 0.0060.001 | 1.8 | … | … | … | … | 0.0340.005 | 2.6 | |||
| 4711 [Ar iv]+He i | 0.0140.001 | 4.1 | 0.0120.002 | 2.1 | … | … | … | … | |||
| 4740 [Ar iv] | 0.0070.001 | 2.1 | … | … | … | … | … | … | |||
| 4861 H | 1.0000.015 | 310.9 | 1.0000.017 | 191.3 | 1.0000.032 | 33.9 | 1.0000.019 | 89.3 | |||
| 4922 He i | 0.0070.001 | 2.3 | … | … | … | … | … | … | |||
| 4959 [O iii] | 1.3410.020 | 430.5 | 1.0950.018 | 217.5 | 1.0340.030 | 37.8 | 1.2840.022 | 122.4 | |||
| 5007 [O iii] | 4.0430.059 | 1371.0 | 3.2770.051 | 659.0 | 3.1360.076 | 119.4 | 3.8100.062 | 363.3 | |||
| 5200 [N i] | 0.0050.001 | 1.8 | … | … | … | … | … | … | |||
| 5271 [Fe iii] | 0.0030.001 | 1.4 | … | … | … | … | … | … | |||
| 5517 [Cl iii] | 0.0030.001 | 1.3 | … | … | … | … | … | … | |||
| 5537 [Cl iii] | 0.0020.001 | 1.0 | … | … | … | … | … | … | |||
| 5876 He i | 0.1040.002 | 54.8 | 0.0990.003 | 34.2 | 0.0920.011 | 5.5 | 0.0960.004 | 14.8 | |||
| 6300 [O i] | 0.0200.001 | 12.7 | 0.0240.002 | 9.4 | … | … | … | … | |||
| 6363 [O i] | 0.0060.001 | 12.7 | … | … | … | … | … | … | |||
| 6563 H | 2.7490.043 | 1807.0 | 2.7480.046 | 1173.0 | 2.4510.065 | 194.9 | 2.5260.045 | 560.8 | |||
| 6583 [N ii] | 0.0130.001 | 7.0 | 0.0240.004 | 12.1 | … | … | … | … | |||
| 6678 He i | 0.0280.001 | 19.6 | 0.0290.003 | 13.0 | … | … | 0.0310.004 | 7.5 | |||
| 6717 [S ii] | 0.0430.001 | 30.5 | 0.0720.002 | 31.2 | 0.0710.009 | 6.1 | … | … | |||
| 6731 [S ii] | 0.0330.001 | 23.8 | 0.0440.002 | 19.4 | 0.0420.007 | 3.7 | … | … | |||
| 7065 He i | 0.0340.001 | 27.7 | 0.0270.002 | 14.9 | … | … | 0.0270.004 | 7.7 | |||
| 7135 [Ar iii] | 0.0280.001 | 24.2 | 0.0340.003 | 19.0 | … | … | 0.0330.004 | 9.5 | |||
| 7281 He i | 0.0060.001 | 5.1 | 0.0080.003 | 4.9 | … | … | … | … | |||
| (H) dex | 0.0450.019 | 0.0000.020 | 0.0000.030 | 0.0000.021 | |||||||
| (H)b | 1.790.01 | 0.540.01 | 0.120.01 | 0.300.01 | |||||||
| (abs) Å | 0.30.8 | 0.01.2 | 1.80.4 | 0.00.5 | |||||||
ain Å.
bin units 10-14 erg s-1cm-2.
| Tol 1214–277 | Tol 65 | ||||
|---|---|---|---|---|---|
| Value | region 1 | regions 1+2 | regions 3+4 | ||
| (O iii)(K) | 19970250 | 17270210 | 17720460 | ||
| (O ii)(K) | 15680180 | 14750170 | 14920370 | ||
| (S iii)(K) | 18280210 | 16030170 | 16400390 | ||
| (S ii)(cm-3) | 25090 | 19050 | 1010 | ||
| (He ii)(cm-3) | 7040 | 26050 | 2010 | ||
| (3889) | 0.0 | 0.0 | 0.0 | ||
| O+/H+(105) | 0.2800.009 | 0.5170.018 | 0.6920.048 | ||
| O+2/H+(105) | 3.0410.093 | 2.9430.093 | 2.5600.163 | ||
| O+3/H+(106) | 2.1360.105 | 0.3050.036 | 0.9040.136 | ||
| O/H(105) | 3.5340.094 | 3.4900.095 | 3.3430.170 | ||
| 12 + log(O/H) | 7.5480.012 | 7.5430.012 | 7.5240.022 | ||
| N+/H+(107) | 0.6440.032 | 1.3120.046 | 1.6030.127 | ||
| ICF(N)a | 12.6 | 6.76 | 4.83 | ||
| log(N/O) | –1.6380.025 | –1.5950.019 | –1.6350.041 | ||
| Ne+2/H+(105) | 0.4360.014 | 0.4670.015 | 0.4550.031 | ||
| ICF(Ne)a | 1.16 | 1.19 | 1.31 | ||
| log(Ne/O) | –0.8430.018 | –0.8000.019 | –0.7500.037 | ||
| S+/H+(107) | 0.3300.011 | 0.9370.023 | 1.0790.049 | ||
| S+2/H+(107) | 2.2360.164 | 4.7720.257 | 5.8500.794 | ||
| ICF(S)a | 2.91 | 1.88 | 1.56 | ||
| log(S/O) | –1.6760.030 | –1.5130.023 | –1.4900.055 | ||
| Cl+2/H+(108) | 0.5050.115 | 0.6910.121 | … | ||
| ICF(Cl)a | 1.85 | 1.77 | … | ||
| log(Cl/O) | –3.5780.100 | –3.4550.077 | … | ||
| Ar+2/H+(107) | 0.5670.020 | 0.9080.028 | 0.9790.068 | ||
| Ar+3/H+(107) | 1.4690.077 | 0.6710.067 | 0.6570.526 | ||
| ICF(Ar)a | 1.01 | 1.02 | 1.04 | ||
| log(Ar/O) | –2.2370.021 | –2.3370.023 | –2.2950.143 | ||
| Fe+2/H+(107) | 0.6610.129 | 1.0270.149 | 1.3820.517 | ||
| ICF(Fe)a | 15.8 | 8.44 | 6.04 | ||
| log(Fe/O) | –1.5300.086 | –1.6050.064 | –1.6030.164 | ||
| O/Fe | 0.1100.086 | 0.1850.064 | 0.1830.164 | ||
| He+/H+(4471) | 0.07770.0027 | 0.07170.0023 | 0.06710.0072 | ||
| He+/H+(5876) | 0.07690.0021 | 0.07980.0018 | 0.08030.0029 | ||
| He+/H+(6678) | 0.07550.0024 | 0.07740.0021 | 0.07600.0051 | ||
| He+/H+(mean) | 0.07670.0014 | 0.07680.0012 | 0.07790.0024 | ||
| He+2/H+(4686) | 0.00490.0001 | 0.00070.0001 | 0.00210.0003 | ||
| He/H | 0.08160.0014 | 0.07750.0012 | 0.08000.0024 | ||
| 0.24590.0043 | 0.23650.0037 | 0.24230.0075 | |||
aICF is the ionization correction factor.
| Tol 1214–277 (region 1) | Tol 65 | ||||||
|---|---|---|---|---|---|---|---|
| Value | 1999 | 2000 | region 1 | region 2 | region 3 | region 4 | |
| (O iii)(K) | 19850260 | 19760250 | 18740250 | 18240500 | 190303260 | 19100740 | |
| (O ii)(K) | 15640190 | 15650180 | 15300190 | 15110390 | 153902460 | 15410560 | |
| (S iii)(K) | 18170220 | 18100210 | 17260210 | 16840420 | 175002700 | 17550610 | |
| (S ii)(cm-3) | 410150 | 22090 | 14060 | 1010 | 1010 | 1010 | |
| (He ii)(cm-3) | 101 | 701 | 22050 | 101 | … | 103 | |
| (3889) | 0.3 | 0.0 | 0.2 | 0.2 | … | 0.2 | |
| O+/H+(105) | 0.1890.008 | 0.2240.009 | 0.3720.014 | 0.5790.043 | 0.5940.250 | 0.4910.051 | |
| O+2/H+(105) | 2.9890.096 | 3.0670.095 | 2.6450.087 | 2.2760.150 | 1.9850.784 | 2.4070.217 | |
| O+3/H+(106) | 2.1810.119 | 2.0190.100 | 0.2140.031 | … | … | 0.9470.201 | |
| O/H(105) | 3.3970.097 | 3.4940.096 | 3.0390.088 | 2.8550.156 | 2.5780.823 | 2.9930.224 | |
| 12 + log(O/H) | 7.5310.012 | 7.5430.012 | 7.4830.013 | 7.4560.024 | 7.4110.139 | 7.4760.032 | |
| N+/H+(107) | 0.4970.038 | 0.6720.048 | 0.8940.040 | 1.7860.213 | … | … | |
| ICF(N)a | 17.9 | 15.6 | 8.16 | 4.93 | … | … | |
| log(N/O) | –1.5810.035 | –1.5240.033 | –1.6200.023 | –1.5110.057 | … | … | |
| Ne+2/H+(105) | 0.3800.013 | 0.4260.014 | 0.4240.015 | 0.3610.026 | 0.3620.147 | 0.3930.038 | |
| ICF(Ne)a | 1.14 | 1.14 | 1.15 | 1.25 | 1.30 | 1.24 | |
| log(Ne/O) | –0.8950.019 | –0.8570.019 | –0.7960.020 | –0.8000.040 | –0.7390.225 | –0.7870.053 | |
| Cl+2/H+(108) | … | … | 0.8570.144 | … | … | … | |
| ICF(Cl)a | … | … | 1.91 | … | … | … | |
| log(Cl/O) | … | … | –3.2700.074 | … | … | … | |
| Ar+2/H+(107) | 0.5950.027 | 0.5830.020 | 0.7980.029 | 1.0070.081 | … | 0.9330.116 | |
| Ar+3/H+(107) | 1.7890.109 | 1.6180.086 | 0.6220.095 | … | … | … | |
| ICF(Ar)a | 1.01 | 1.01 | 1.01 | 1.89 | … | 2.11 | |
| log(Ar/O) | –2.1520.023 | –2.1980.021 | –2.3250.033 | –2.1760.042 | … | –2.1820.063 | |
| Fe+2/H+(107) | … | 0.6920.012 | 0.7280.184 | … | … | … | |
| ICF(Fe)a | … | 19.5 | 10.2 | … | … | … | |
| log(Fe/O) | … | –1.3810.073 | –1.6390.110 | … | … | … | |
| O/Fe | … | –0.0060.074 | 0.1920.111 | … | … | … | |
| He+/H+(4471) | 0.07260.0032 | 0.07830.0031 | 0.07420.0029 | 0.08160.0086 | … | 0.04810.0119 | |
| He+/H+(5876) | 0.07680.0015 | 0.07880.0014 | 0.08050.0015 | 0.08270.0026 | … | 0.08100.0035 | |
| He+/H+(6678) | 0.07680.0027 | 0.07880.0024 | 0.08060.0026 | 0.08540.0076 | … | 0.09430.0122 | |
| He+/H+(mean) | 0.07620.0012 | 0.07870.0011 | 0.07950.0012 | 0.08290.0023 | … | 0.07950.0033 | |
| He+2/H+(4686) | 0.00530.0001 | 0.00490.0001 | 0.00060.0001 | … | … | 0.00310.0005 | |
| He/H | 0.08150.0012 | 0.08360.0012 | 0.08010.0012 | 0.08290.0023 | … | 0.08260.0033 | |
| 0.24570.0038 | 0.25040.0036 | 0.24250.0036 | 0.24880.0072 | … | 0.24820.0102 | ||
aICF is the ionization correction factor.
3.1.2 Low-resolution spectra
We show in Fig. 5 the low-resolution spectra of regions 1 and 2 in Tol 1214–277 obtained during the two 1999 and 2000 runs, with slit #1 (Fig. 1) oriented along the major axis of the galaxy. The corrected fluxes and equivalent widths of the emission lines are shown in Table 3. As in the case of the high-resolution spectra, the high-ionization He ii 4686, 5411 and [Fe v] 4227 emission lines were also detected in region 1. The low spectral resolution precludes flux measurement of the [S iii] 6312 emission line, blended with the [O i] 6300 emission line. Likewise, the [N ii] 6583 emission line is blended with H. The [N ii] 6583 fluxes in the spectra of region 1 were therefore measured by setting the continuum at the top of the wing of the H emission line. Region 2 is characterised by a blue spectrum, however only a few strongest emission lines with low equivalent widths are detected. The temperature-sensitive [O iii] 4363 emission line is not seen, precluding a reliable abundance determination.
We show the four spectra of regions 1 to 4 in Tol 65 in Fig. 6. The corrected fluxes and equivalent widths of emission lines are shown in Table 4. Note that the observed H/H flux ratios in regions 3 and 4 are lower than the theoretical recombination value. This likely reflects uncertainties in the flux calibration of the Tol 65 spectrum. Therefore, for regions 3 and 4 we set the extinction coefficient (H) = 0. The high spatial resolution allows to identify more accurately the regions with He ii 4686 emission. It is seen from Table 4 that the He ii 4686/H flux ratio is small in region 1 and much larger in region 4. No He ii emission is detected in regions 2 and 3. Hence, the ionization radiation is the hardest in region 4.
3.2 Heavy element abundances
To derive element abundances, we adopted a two-zone photoionized H ii region model (Stasińska S90 (1990)) including a high-ionization zone with temperature (O iii), and a low-ionization zone with temperature (O ii). The electron temperature (O iii) is derived from the [O iii]4363/(4959+5007) ratio using a five-level atom model. That temperature is used for the derivation of the He+, He+2, O+2, Ne+2 and Ar+3 ionic abundances. (O ii) is obtained from (O iii) using the relation given in Izotov et al. (ITL94 (1994)), based on a fit to the photoionization models of Stasińska (S90 (1990)). The temperature (O ii) is used to derive the O+, N+, S+ and Fe+2 ion abundances. For S+2, Cl+2 and Ar+2 we have adopted an electron temperature intermediate between (O iii) and (O ii) following the prescriptions of Garnett (G92 (1992)).
The oxygen abundance is derived as
| (1) |
where
| (2) |
Total abundances of other heavy elements were computed after correction for unseen stages of ionization, as described in Izotov et al. (ITL94 (1994)), Thuan et al. (TIL95 (1995)) and Guseva et al. (G03 (2003)).
3.2.1 High-resolution spectra
The heavy element abundances obtained from the high-resolution spectra of region 1 in Tol 1214–277 (slit #3) and of regions 1+2 and 3+4 in Tol 65 (slit #6) are shown in Table 5. We also show in this Table the electron temperatures (O iii), (O ii), and (S iii), the electron number density (S ii) and (He ii), and the ionization correction factors ICF used for the abundance determination.
The oxygen abundances of Tol 1214–277 and Tol 65 are very similar. They are in general agreement with those obtained in previous studies.
The high spectral resolution allows us to determine the nitrogen abundance with great accuracy because the [N ii] 6583 emission line is not blended with H. The nitrogen-to-oxygen abundance ratios log N/O = –1.60 - –1.64 obtained here agree well with those found by Izotov et al. (2001a ), but differ significantly from the value obtained by Pagel et al. (P92 (1992)). For Tol 1214–277, Pagel et al. (P92 (1992)) derived a higher value, log N/O = –1.46 0.06, while, for Tol 65, they found log N/O = –1.81 0.15, lower than the mean for the most metal-deficient BCDs (Izotov & Thuan IT99 (1999)). Our new determination of the N/O abundance ratio in these two BCDs supports the finding by Thuan et al. (TIL95 (1995)) and Izotov & Thuan (IT99 (1999)) that log N/O for BCDs with 12 + log O/H 7.60 lies in a narrow range, with a mean value of –1.60.
In Fig. 7 we compare several heavy element-to-oxygen abundance ratios determined from the high- and low-resolution spectra for Tol 1214–277 (filled stars) and Tol 65 (filled squares) with those derived for a sample of 93 BCDs by Izotov & Thuan (IT99 (1999, 2004)), Lipovetsky et al. (L99 (1999)) and Guseva et al. (G03 (2003)) (open circles). The heavy element abundance ratios in Tol 1214–277 and Tol 65 are in general agreement with those derived for other very low-metallicity BCDs.
Note the increasing trend of [O/Fe] with increasing 12 + log O/H (open symbols in Fig. 7f). The relatively low [O/Fe] in Tol 1214–277 and Tol 65 (filled symbols in Fig. 7f) further supports that trend. Such a trend can be explained by a larger Fe depletion onto dust in galaxies with larger oxygen abundance.
3.2.2 Low-resolution spectra
The heavy element abundances obtained from the low-resolution spectra, together with the adopted electron temperatures, electron number densities and ionization correction factors, are shown in Table 6 for region 1 in Tol 1214–277, observed in 1999 and 2000 at slit position #1, and regions 1 to 4 in Tol 65, observed in 1999 at slit position #4. The oxygen abundance for region 1 in Tol 1214–277 derived from the low-resolution observations is very similar to that obtained from the high-resolution observations (Table 5). The other heavy element abundances are also in good agreement. The oxygen abundance for regions 1 – 4 in Tol 65 derived from the low-resolution spectra is slightly lower than that found for regions 1+2 and 3+4 from the high-resolution spectra. The agreement between other heavy element abundances is good.
3.3 Helium abundance
He emission-line strengths in the high- and low-resolution spectra of region 1 in Tol 1214–277 and regions 1–4 in Tol 65 are converted to singly ionized helium He+/H+ and doubly ionized helium He+2/H+ abundances, using the theoretical He i recombination line emissivities by Smits (S96 (1996)).

| Name | (J2000.0) | (J2000.0) |
|---|---|---|
| Tol 1214–277a | 12h17m171 | –28∘02′33″ |
| g1 | 12 17 17.0 | –28 02 27 |
| g2 | 12 17 15.5 | –28 02 49 |
| g3 | 12 17 14.0 | –28 02 53 |
| g4 | 12 17 25.0 | –28 00 17 |
| Tol 65a | 12 25 46.9 | –36 14 01 |
| g5 | 12 25 45.6 | –36 14 13 |
| g6 | 12 25 51.5 | –36 13 12 |
| g7 | 12 25 59.1 | –36 16 05 |
| g8 | 12 25 42.9 | –36 13 24 |
a Coordinates of the brightest region 1.
The helium mass fraction was calculated as
| (3) |
where = + is the number density of helium relative to hydrogen (Pagel et al. P92 (1992)).
The main mechanisms causing deviations of the observed He i emission line fluxes from their theoretical values are collisional and fluorescent enhancement. In order to correct for these effects, we have adopted the procedure, discussed in more detail in Izotov et al. (ITL94 (1994); 1997a ) and Izotov & Thuan (IT98 (1998)). The singly ionized helium abundance and He mass fraction is obtained for each of the three He i 4471, 5876 and 6678 lines. We then derive the weighted mean of these three determinations, the weight of each line being scaled to its intensity. The obtained ionic and total He abundances (, , ) and mass fractions () in Tol 1214–277 and Tol 65 are shown in Tables 5 and 6. In general, they are consistent with the He abundances found by Izotov et al. (2001a ) from the Keck observations of both BCDs. They are also consistent with the primordial helium mass fraction = 0.244 – 0.245 obtained by Izotov & Thuan (IT98 (1998)) and Izotov et al. (I99 (1999)). An exception is the He mass fraction determined from the high-resolution spectrum of regions 1+2 in Tol 65, which is lower (Table 5). However, at the 95% confidence level, it is consistent with other determinations of in Tol 65.
| (Å) Ion | (Å) | ()a | (Å) | |
| g1 (slit #3) | ||||
| 3727 [O ii] | 4585.20.1 | 12.50.7 | 52 3 | 0.2303 |
| 4340 H | 5338.20.3 | 1.70.3 | 7 1 | 0.2299 |
| 4861 H | 5979.40.2 | 4.30.5 | 18 2 | 0.2299 |
| 4959 [O iii] | 6100.50.7 | 2.00.8 | 6 2 | 0.2302 |
| 5007 [O iii] | 6159.60.4 | 5.11.1 | 15 3 | 0.2302 |
| g2 (slit #2) | ||||
| 5007 [O iii] | 5137.00.9 | 1.90.5 | 20 5 | 0.0260 |
| 6563 H | 6732.50.8 | 2.30.5 | 43 10 | 0.0259 |
| g3 (slit #2) | ||||
| 3727 [O ii] | 5999.00.4 | 12.21.0 | 47 4 | 0.6096 |
| 4861 H | 7821.10.4 | 6.70.8 | 26 3 | 0.6088 |
| g4 (slit #1) | ||||
| 3727 [O ii] | 6421.81.0 | 8.41.7 | 34 7 | 0.7231 |
| g5 (slit #5) | ||||
| 3727 [O ii] | 4105.71.0 | 10.61.6 | 51 8 | 0.1016 |
| 4861 H | 5350.11.1 | 1.20.6 | 4 2 | 0.1005 |
| 4959 [O iii] | 5463.22.6 | 3.31.2 | 13 5 | 0.1017 |
| 5007 [O iii] | 5515.90.9 | 3.90.9 | 15 4 | 0.1017 |
| 6563 H | 7228.50.4 | 9.91.0 | 118 12 | 0.1014 |
| g6 (slit #5) | ||||
| 3727 [O ii] | 4942.40.2 | 107.73.6 | 27 1 | 0.3261 |
| 4861 H | 6445.40.4 | 34.43.2 | 7 1 | 0.3258 |
| 5007 [O iii] | 6637.20.5 | 34.52.9 | 7 1 | 0.3256 |
| g7 (slit #6) | ||||
| 3727 [O ii] | 5304.70.7 | 6.00.9 | 65 12 | 0.4233 |
| 4861 H | 6917.40.8 | 1.90.6 | 47 22 | 0.4229 |
| 4959 [O iii] | 7056.00.8 | 1.60.8 | 50 17 | 0.4229 |
| 5007 [O iii] | 7124.00.4 | 3.60.7 | 230 17 | 0.4229 |
| g8 (slit #6) | ||||
| 3727 [O ii] | 4762.00.5 | 4.70.7 | 52 9 | 0.2777 |
| 4861 H | 6210.11.9 | 1.00.6 | 18 11 | 0.2775 |
| 4959 [O iii] | 6334.01.5 | 1.20.6 | 28 14 | 0.2773 |
| 5007 [O iii] | 6395.20.7 | 2.40.8 | 33 10 | 0.2773 |
ain units 10-17 erg s-1cm-2.
b redshift.


4 High-ionization emission lines in Tol 1214–277
Several emission lines of the high-ionization ions are detected in the high-resolution spectrum of Tol 1214–277 (Table 2, Fig. 2). The presence of these lines implies the existence of a substantial ionizing radiation field with 228Å (equivalent to photon energies 4 Ryd) in the brightest H ii region 1. In addition to confirming the findings of previous papers such as [Fe v] 4227 and strong He ii 4686 emission, we detect here also emission lines of Ne iv (the ionization potential of Ne+3 is 4.664 Ryd), Fe vi (the ionization potential of Fe+5 is 5.513 Ryd) and Fe vii (the ionization potential of Fe+6 is 7.281 Ryd). The large difference in the ionization potentials of these different ions allows in principle to determine the slope of the hard radiation spectrum.
To constrain the nature of the hard ionizing radiation in Tol 1214–277, we compare our observations with a spherically symmetric ionization-bounded H ii region model calculated with the CLOUDY94 code (Ferland F96 (1996); Ferland et al. F98 (1998)) for the physical conditions of the brightest H ii region. The input parameters are the element abundances from Table 5 and the flux of ionizing photons (in s-1) at 912Å as determined from the H emission line luminosity (H). Because the spectrum of Tol 1214–277 is not properly flux-calibrated, we adopt log = 52.7 from Izotov et al. (I04 (2004)). As source of ionizing radiation, we chose to use the hottest CoStar stellar atmosphere model F1, with a heavy element mass fraction = 0.004 (/5) (the lowest available for the CoStar models) and an effective temperature = 54000K (Schaerer & de Koter S97 (1997)). This model predicts harder radiation for 228Å as compared to Kurucz (K79 (1979))’s stellar atmosphere models.
The model predicts the He ii 4686 flux and the [Ne iv] 4725/[Ne iii] 3868 flux ratio to be respectively 50 and 200 times lower than the ones observed. As for the high-ionization iron lines, the model predicts flux ratios [Fe vi] 5146/[Fe iii] 4658 and [Fe vii] 6087/[Fe iii] 4658 respectively 500 and 105 times lower than the ones observed. The disagreement between predicted and observed emission line fluxes increases for ions of higher ionization degree. This implies that the spectrum of hard radiation for energies 4 Ryd in Tol 1214–277 increases more steeply at higher energies, as compared to the predictions of the CoStar models. The disagreement between the observed and predicted fluxes and flux ratios is not likely to diminish significantly if models with the lower Tol 1214–277 ionized gas metallicity are used, because log / is nearly constant for main-sequence stellar population models with /50 (Schaerer S02 (2002, 2003)). Here is the flux of ionizing photons with 228Å ( 4 Ryd). In principle, it is possible to reproduce the observed He ii 4686 and [Ne iv] 4725 emission line fluxes by assuming that the massive stars in the ionizing cluster of Tol 1214–277 have the very low metallicity, of 10-7. However, the predicted equivalent widths of H and Ly emission lines in such models (Schaerer S02 (2002, 2003)) are several times larger than those observed (Table 2; Thuan & Izotov TI97 (1997)). Furthermore, these models cannot reproduce the observed fluxes of [Fe vi] and [Fe vii] emission lines. This suggests that an additional compact source of X-ray emission is likely to be present in the brightest H ii region of Tol 1214–277. Fast shocks with velocities of 400 – 500 km s-1 (Dopita & Sutherland DS96 (1996)) would reproduce both the He ii and Fe vii emission. High mass X-ray binary systems are also possible sources of X-ray emission.
We now estimate the X-ray luminosity needed to account for the high-ionization lines. Using the value of derived from the observations, we scale the spectral energy distribution of stellar atmosphere model F1 to fit the line fluxes of the low-ionization ions. Adopting a multiplicative factor of 105, required to bring the ionizing radiation fluxes at 100Å ( 7 – 8 Ryd) of the CoStar models to the level of the observed fluxes of the Fe vii ions, we find that the X-ray luminosity of the ionizing cluster should be as high as 1039 – 1040 erg s-1, in agreement with the conclusions of Izotov et al. (I04 (2004)) who discovered unusually strong [Ne v] 3426 emission in the spectrum of Tol 1214–277. We note also that Thuan et al. (T04 (2004)) using Chandra observations have found in the two most metal-deficient BCDs known, I Zw 18 and SBS 0335–052, X-ray point sources with 0.5 – 10 Kev luminosities in the range 1.3 – 8.5 1039 erg s-1, just the range of X-ray luminosities predicted by our scaling argument.
5 Emission-line galaxies in the fields of Tol 1214–277 and Tol 65
One of the aims of this study was the search for emission-line companion galaxies of Tol 1214–277 and Tol 65. For this we use spectroscopic observations with different slit orientations (slits #1 – #6 in Table 1 and Fig. 1), chosen to go through extended sources with irregular morphology and/or blue colour, as seen on deep VLT images of the fields around Tol 1214–277 and Tol 65 (Fricke et al. F01 (2001); Papaderos et al. P99 (1999)).
We found in total four emission-line galaxies in the field of Tol 1214–277 and four emission-line galaxies in the field of Tol 65. These galaxies are labeled in Fig. 1, and their equatorial coordinates at epoch J2000.0 are given in Table 7, along with the coordinates of Tol 1214–277 and Tol 65. Note that the galaxies g2 and g3 correspond to the galaxies and discussed by Fricke et al. (F01 (2001)), and the galaxy g5 corresponds to the galaxy in Papaderos et al. (P99 (1999)).
The spectra of the emission-line galaxies in the fields of Tol 1214–277 and Tol 65 are shown respectively in the left and right panels of Fig. 8. In each spectrum, except for that of galaxy g4 (Fig. 8d), several emission lines are detected, most often the [O ii] 3727, H 4861, [O iii] 4959, 5007 lines. In the spectrum of g4, only one emission line is present. We identify the line to be [O ii] 3727, as the continuum longward of this emission line increases, as seen in the spectra of several other galaxies in Fig. 8. Note also that the spectrum of g1 is contaminated by the emission lines of Tol 1214–277.
In Table 8 we show the rest-frame and observed wavelengths, fluxes and equivalent widths of the lines in the emission-line galaxies, and redshifts, derived for each line. Note that, despite the noisy spectra, the redshifts derived from different emission lines in the same galaxy are in very good agreement.
All emission-line galaxies in the fields of Tol 1214–277 and Tol 65 except for galaxy g2, are more distant background galaxies with redshifts ranging from 0.1 to 0.7. In particular galaxy g5, suggested by Papaderos et al. (P99 (1999)) to be a low-surface-brightness companion galaxy of Tol 65, is in fact a background galaxy.
The only companion galaxy to Tol 1214–277 is g2. Its spectrum is characterized by a flux increase to the blue and two weak emission lines, [O iii] 5007 and H, with the same redshift as Tol 1214–277. The projected linear distance between Tol 1214–277 and g2 is 14.5 kpc.
Tol 1214–277 is not unique among the most metal-deficient BCDs in having a companion galaxy. Such companions are also seen for other very metal-deficient BCDs such as SBS 0335–052 (Pustilnik et al. PU97 (1997)) and HS 0822+3542 (Pustilnik et al. PU03 (2003)) at projected distances of 22 kpc and 11 kpc, respectively. VLA 21 cm observations of SBS 0335–052 (Pustilnik et al. PU01 (2001)) reveal that the BCD and its companion are embedded in a large cloud of neutral gas implying a common origin. It would be interesting to carry out such H i VLA observations for Tol 1214–277 to check whether the BCD and its companion galaxy are also part of the same system.
6 Conclusions
Our main conclusions from the VLT spectroscopic study of the blue compact dwarf (BCD) galaxies Tol 1214–277 and Tol 65 and the fields around these galaxies may be summarized as follows:
1. The oxygen abundances 12 + log O/H in the brightest regions of Tol 1214–277 and Tol 65 derived from high-resolution spectra are, respectively, 7.55 0.01 and 7.54 0.01, or /24. These values are in good agreement with previous determinations by Fricke et al. (F01 (2001)) and Izotov et al. (2001a ). The high spectral resolution allows to separate the [N ii] 6583 emission line from the strong H emission line and reliably determine the nitrogen abundance. We find log N/O = –1.64 0.03 and –1.60 0.02 respectively, in agreement with previous determinations by Izotov et al. (2001a ), and consistent with the mean value of log N/O = –1.60 obtained by Izotov & Thuan (IT99 (1999)) for very metal-deficient BCDs with 12 + log O/H 7.6.
2. The He mass fraction derived for several regions in Tol 1214–277 and Tol 65 is in the range = 0.242 – 0.250, consistent with the values obtained by Izotov et al. (2001a ) for both galaxies, and with the primordial He mass fraction = 0.244 – 0.245 obtained by Izotov & Thuan (IT98 (1998, 2004)) and Izotov et al. (I99 (1999)). An exception is the He mass fraction = 0.237 derived for regions 1 + 2 in Tol 65 because of likely contamination by underlying stellar He i absorption. However, at the 95% confidence level, this value is consistent with other determinations of the He abundance in Tol 65.
3. Strong He ii 4686 emission, with an intensity as high as 5% of that of the H emission line, and the high ionization line [Fe v] 4227 are seen in the spectrum of Tol 1214–277, confirming previous findings by Fricke et al. (F01 (2001)) and Izotov et al. (2001a ). Additionally, weak [Ne iv] 4725, [Fe vi] 5146, 5177, [Fe vii] 5721, 6087 emission lines are detected. This implies the presence of intense X-ray emission in Tol 1214–277. In particular, to produce the observed [Fe vii] emission line fluxes and assuming that the X-ray sources are located in the compact region, the X-ray luminosity of the brightest H ii region in Tol 1214–277 should be as high as 1039 – 1040 erg s-1.
4. We find four emission-line galaxies in the field of Tol 1214–277, and four emission-line galaxies in the field of Tol 65. Seven of these galaxies are background star-forming galaxies with redshifts in the range 0.1 – 0.7. One emission-line galaxy in the field of Tol 1214–277 has the same redshift as the BCD and is likely a companion galaxy at a projected distance of 14.5 kpc.
Acknowledgements.
Y.I.I. acknowledges the Göttingen Academy of Sciences for a Gauss professorship. He and N.G.G. have been supported by DFG grant 436 UKR 17/22/03, by Swiss SCOPE 7UKPJ62178 grant and by grant No. 02.07/00132 of the Ukrainian fund for fundamental investigations. They are grateful for the hospitality of the Göttingen Observatory. P.P. and K.J.F. acknowledge support by the Volkswagen Foundation under grant No. I/72919. Y.I.I. and T.X.T. have been partially supported by NSF grant AST 02-05785. The research described in this publication was made possible in part by Award No. UP1-2551-KV-03 of the U.S. Civilian Research & Development Foundation for the Independent States of the Former Soviet Union (CRDF).References
- (1) Aller, L. H. 1984, Physics of Thermal Gaseous Nebulae, Dordrecht: Reidel
- (2) Anders, E., & Grevesse, N. 1989, Geochim.Cosmochim.Acta, 53, 197
- (3) Campbell, A., Terlevich, R., & Melnick, J. 1986, MNRAS, 223, 811
- (4) Dopita, M. A., & Sutherland, R. S. 1996, ApJS, 102, 161
- (5) Ferland, G. J. 1996, CLOUDY, Univ. of Kentucky, Dept. of Phys. and Astron. Internal Rep.
- (6) Ferland, G. J., Korista, K. T., Verner, D. A., Ferguson, J. W., Kingdon, J. B., & Verner, E. M. 1998, PASP, 110, 761
- (7) Fricke, K. J., Izotov, Y. I., Papaderos, P., Guseva, N. G., & Thuan, T. X. 2001, AJ, 121, 169
- (8) Garnett, D. R. 1992, AJ, 103, 1330
- (9) Guseva, N. G., Papaderos, P., Izotov, Y. I., Green, R. F., Fricke, K. J., Thuan, T. X., & Noeske, K. G. 2003, A&A, 407, 105
- (10) Izotov, Y. I., & Thuan, T. X. 1998, ApJ, 500, 188
- (11) Izotov, Y. I., & Thuan, T. X. 1999, ApJ, 511, 639
- (12) Izotov, Y. I., & Thuan, T. X. 2004, ApJ, 602, 200
- (13) Izotov, Y. I., Chaffee, F. H., & Green, R. F. 2001a, ApJ, 562, 727
- (14) Izotov, Y. I., Chaffee, F. H., & Schaerer, D. 2001b, A&A, 378, L45
- (15) Izotov, Y. I., Thuan, T. X., & Lipovetsky, V. A. 1994, ApJ, 435, 647
- (16) Izotov, Y. I., Thuan, T. X., & Lipovetsky, V. A. 1997a, ApJS, 108, 1
- (17) Izotov, Y. I., Lipovetsky, V. A., Chaffee, F. H., Foltz, C. B., Guseva, N. G., & Kniazev, A. Y. 1997b, ApJ, 476, 698
- (18) Izotov, Y. I., Chaffee, F. H., Foltz, C. B., et al. 1999, ApJ, 527, 757
- (19) Izotov, Y. I., Noeske, K. G., Guseva, N. G., Papaderos, P., Thuan, T. X., & Fricke, K. J. 2004, A&A, 415, L27
- (20) Kurucz, R. L. 1979, ApJS, 40, 1
- (21) Kunth, D., & Sargent, W. L. W. 1983, ApJ, 273, 81
- (22) Lipovetsky, V. A., Chaffee, F. H., Izotov, Y. I., et al. 1999, ApJ, 519, 177
- (23) Masegosa, J., Moles, M., & Campos-Aguilar, A. 1994, ApJ, 420, 576
- (24) Meynet, G., & Maeder, A. 2002, A&A, 381, L25
- (25) Noeske, K. G., Iglesias-Páramo, J., Vílchez, J. M., Papaderos, P., & Fricke, K. J. 2001, A&A, 371, 806
- (26) Pagel, B. E. J., Simonson, E. A., Terlevich, R. J., & Edmunds, M. G. 1992, MNRAS, 255, 325
- (27) Papaderos, P., Fricke, K. J., Thuan, T. X., Izotov, Y. I., & Nicklas, H. 1999, A&A, 352, L57
- (28) Pustilnik, S. A., Brinks, E., Thuan, T. X., Lipovetsky, V. A., & Izotov, Y. I. 2001, AJ, 121, 1413
- (29) Pustilnik, S. A., Lipovetsky, V. A., Izotov, Y. I., et al. 1997, AstL, 23, 308
- (30) Pustilnik, S. A., Kniazev, A. Y., Pramskij, A. G., Ugryumov, A. V., & Masegosa, J. 2003, A&A, 409, 917
- (31) Schaerer, D. 2002, A&A, 382, 28
- (32) Schaerer, D. 2003, A&A, 397, 527
- (33) Schaerer, D., & de Koter, A. 1997, A&A, 322, 598
- (34) Smits, D. P. 1996, MNRAS, 278, 683
- (35) Stasińska G. 1990, A&AS, 83, 501
- (36) Thuan, T. X., & Izotov, Y. I. 1997, ApJ, 489, 623
- (37) Thuan, T. X., Izotov, Y. I., & Lipovetsky, V. A. 1995, ApJ, 445, 108
- (38) Thuan, T. X., Bauer, F. E., Papaderos, P., & Izotov, Y. I., 2004, ApJ, May 1
- (39) Whitford, A.E. 1958, AJ, 63, 201