Pox 186: an ultracompact galaxy with dominant ionized gas emission
We present a ground-based optical spectroscopic and HST , , photometric study of the blue compact dwarf (BCD) galaxy Pox 186. It is found that the emission of the low-surface brightness (LSB) component in Pox 186 at radii 3″ ( 270 pc in linear scale) is mainly gaseous in origin. We detect H emission out to radii as large as 6″. At radii 3″ the light of the LSB component is contaminated by the emission of background galaxies complicating the study of the outermost regions. The surface brightness distribution in the LSB component can be approximated by an exponential law with a scale length 120 pc. This places Pox 186 among the most compact dwarf galaxies known. The derived is likely to be an upper limit to the scale length of the LSB component because of the strong contribution of the gaseous emission. The oxygen abundance in the bright H ii region derived from the 4.5m Multiple Mirror Telescope (MMT)††thanks: The MMT Observatory is a joint facility of the Smithsonian Institution and the University of Arizona. and 3.6m ESO telescope††thanks: Based on observations collected at the European Southern Observatory, Chile, ESO program 71.B-0032(A). spectra are 12 + log(O/H) = 7.76 0.02 and 7.74 0.01 (/15)††thanks: 12+log(O/H)⊙ = 8.92 (Anders & Grevesse Anders89 (1989))., respectively, in accordance with previous determinations. The helium mass fractions found in this region are = 0.2480.009 (MMT) and = 0.2480.004 (3.6m) suggesting a high primordial helium abundance.
Key Words.:
galaxies: abundances — galaxies: dwarf — galaxies: compact — galaxies: individual (Pox 186)1 Introduction
The blue compact dwarf (BCD) galaxy Pox 186 PGC 046982 was classified by Kunth, Sargent & Kowal (K81 (1981)) as an ultracompact galaxy at redshift = 0.003903 with an almost stellar appearance and strong emission lines in its spectrum. It was spectroscopically studied by Kunth & Sargent (K83 (1983)). They derived an oxygen abundance 12 + log(O/H) = 7.72 0.02. Later, Kunth, Maurogordato & Vigroux (KMV88 (1988)) presented the results of a , , photometric study of Pox 186. They found that the galaxy is very compact with a diameter of only 350 pc at a surface brightness = 25 mag arcsec-2. Since no H i emission was detected with the Nançay radio telescope, Kunth et al. (KMV88 (1988)) put an upper limit of 2107 on the neutral hydrogen mass.
Using ground-based and photometric data, Doublier et al. (D00 (2000)) found that the central star-forming region of Pox 186 consists of three compact super-star clusters (SSCs). They measured a relatively red colour in the extended component at radii 2″ suggesting that the stellar populations in the low-surface-brightness (LSB) component of Pox 186 are old.
Corbin & Vacca (V02 (2002)) obtained HST , , photometric and UV spectroscopic data as well as ground-based optical spectra. They do not find multiple super-star clusters, contrary to Doublier et al. (D00 (2000)). Corbin & Vacca (V02 (2002)) also concluded that the red colour of the extended component is mostly stellar, dominated by K and M stars. Based on the irregular morphology and the presence of a tail in the central part of the galaxy they suggested that this system is in the stage of formation after merging of two smaller galaxies.
Pox 186 with its small linear extent belongs to the rare class of very compact dwarf galaxies and may be considered an example of the building blocks from which larger galaxies may have formed. This strengthens the motivation for more detailed studies of this object. The conclusions obtained from previous papers on the properties and the evolutionary status of Pox 186 remain controversial. In the most recent papers Doublier et al. (D00 (2000)) and Corbin & Vacca (V02 (2002)) argue, based on broad-band photometric data alone, that the ionized gas emission is not important in the LSB component, while Gil de Paz, Madore & Pevunova (GMP03 (2003)) have clearly detected nebular emission at radii 2″ in the H image of Pox 186.
In this paper we use new spectroscopic observations of Pox 186 and re-analyze archival HST images in order to better understand morphological and physical properties of this galaxy. Observations and data reduction are described in Sect. 2. We present the results in Sect. 3. Our main conclusions are summarized in Sect. 4.
2 Observations and data reduction

2.1 Spectroscopy
The 4.5m Multiple Mirror Telescope (MMT) long-slit spectroscopic observations over a wavelength range 3650 – 7500Å were carried out on 20 April, 1994. The blue channel spectrograph with a 3072 1024 CCD detector in conjunction with a 2″ 180″ slit, and a grating with 500 grooves mm-1 and a second-order blocking filter L-37 were used. The spatial scale along the slit was 03 pixel-1. The spectrum was binned in the spatial direction resulting in a spatial resolution of 06. The spectral resolution was 7 Å (FWHM). The slit was oriented at position angle P.A. = 0 and centered on the bright H ii region (Fig. 1). The spectrum was obtained at an airmass of 1.64 and a seeing of 1″. The total exposure time of 2400 s was broken into three subexposures of 600 s and 2900 s. No correction for atmospheric refraction was applied because the observations were done at a position angle close to the parallactic one. Two spectrophotometric standard stars were observed for flux calibration. For wavelength calibration spectra of a He-Ne-Ar comparison lamp were obtained after each exposure.
The observations with the 3.6-m ESO telescope (La Silla) were obtained on 25 April, 2003. We used a grism (3400–7400) and no second-order blocking filter. The long slit with the width of 1″ was centered on the brightest part of the H ii region at position angle P.A. = –68. The seeing was 065. The spectra were obtained at airmass 1.113. The total exposure time of 3600 s was split up into three subexposures. The spectra were binned along the spatial and dispersion axes resulting in a spatial scale along the slit of 0314 pixel-1, and a spectral resolution of 13.2 Å (FWHM). No correction for atmospheric refraction was made because of the small airmass during the observations. Three spectrophotometric standard stars were observed for flux calibration.
The data reduction was made with the IRAF111IRAF is the Image Reduction and Analysis Facility distributed by the National Optical Astronomy Observatory, which is operated by the Association of Universities for Research in Astronomy (AURA) under cooperative agreement with the National Science Foundation (NSF). software package. This includes bias–subtraction, flat–field correction, cosmic-ray removal, wavelength calibration, night sky background subtraction, correction for atmospheric extinction and absolute flux calibration of the two–dimensional spectrum.
One-dimensional spectra of the bright H ii region were extracted within apertures of 2″ 6″ and 1″ 32 from the MMT and 3.6m data, respectively, and are shown in Fig. 2. The strong increase of the continuum shortward 3660Å in the 3.6m spectrum is due to the Balmer jump in the ionized gas emission, indicating that the contribution of the ionized gas to the total emission is very large.
The presence of numerous strong emission lines in the spectra of Pox 186 allows the reliable determination of the BCD redshift. The redshift of Pox 186 as derived from the observed wavelengths of the 17 brightest emission lines in the MMT spectrum and of the 27 brightest emission lines in the 3.6m spectrum is respectively = 0.004130.00005 and = 0.004130.00010. After correction of for the motion relative to the Local Group centroid and the Virgocentric flow (Kraan-Korteweg K86 (1986)) we derive the distance to Pox 186 as 18.5 Mpc, assuming a Hubble constant of 75 km s-1 Mpc-1. At this distance 1″ corresponds to a linear extent of 90 pc.
2.2 Photometry
We use the broad-band HST WFPC2 images of Pox 186 in F336W (2700 s), F555W (600 s) and F814W (22700 s) from the HST data archive (HST Proposal ID: 8333, PI: M. Corbin). The images were reduced and calibrated by the pipeline package at the Space Telescope Science Institute (STScI) and further processed using ESO MIDAS222Munich Image Data Analysis System, provided by the European Southern Observatory (ESO).. In all bands the object was centered on the PC chip, yielding a scale of 0046 pixel-1. We combined the images in F336W and F814W and removed the cosmic rays using the IRAF/STSDAS routine CRREJ. Only a single F555W image was obtained. Therefore, the cosmic rays in this image were removed manually. We converted instrumental F336W, F555W, F814W magnitudes to the standard , , magnitudes following the prescriptions by Holtzman et al. (H95 (1995)).
All images were corrected for Galactic extinction assuming = 0.201 mag, based on Schlegel, Finkbeiner & Davis (S98 (1998); see NASA Extragalactic Database (NED)).
| MMT | 3.6m | ||||||
| (Å) Ion | ()/(H)a | ()/(H)b | (Å)c | ()/(H)a | ()/(H)b | (Å)c | |
| 3727 [O ii] | 0.279 0.075 | 0.279 0.076 | 88.6 22.0 | 0.3020.002 | 0.3380.002 | 54.60.3 | |
| 3750 H12 | … | … | … | 0.0140.001 | 0.0230.003 | 2.80.3 | |
| 3771 H11 | … | … | … | 0.0270.001 | 0.0370.002 | 6.00.3 | |
| 3798 H10 | … | … | … | 0.0410.001 | 0.0520.002 | 9.50.3 | |
| 3835 H9 | 0.052 0.013 | 0.073 0.021 | 12.1 2.3 | 0.0620.001 | 0.0750.002 | 14.80.3 | |
| 3868 [Ne iii] | 0.420 0.014 | 0.419 0.014 | 120.62.5 | 0.4210.002 | 0.4640.002 | 101.90.4 | |
| 3889 H8 + He i | 0.173 0.010 | 0.190 0.014 | 47.82.2 | 0.1840.001 | 0.2080.002 | 45.20.3 | |
| 3968 [Ne iii] + H7 | 0.287 0.007 | 0.305 0.012 | 73.5 1.3 | 0.2710.001 | 0.3020.002 | 68.40.3 | |
| 4026 He i | 0.022 0.004 | 0.022 0.004 | 6.0 1.0 | 0.0180.001 | 0.0200.001 | 4.70.2 | |
| 4068 [S ii] | … | … | … | 0.0080.002 | 0.0090.002 | 2.20.4 | |
| 4101 H | 0.228 0.005 | 0.245 0.010 | 60.0 0.9 | 0.2390.001 | 0.2620.002 | 64.40.3 | |
| 4340 H | 0.455 0.008 | 0.468 0.012 | 126.81.0 | 0.4470.002 | 0.4730.002 | 131.30.4 | |
| 4363 [O iii] | 0.144 0.004 | 0.143 0.004 | 40.3 0.9 | 0.1480.001 | 0.1540.001 | 43.60.3 | |
| 4471 He i | 0.040 0.003 | 0.040 0.003 | 11.1 0.8 | 0.0370.001 | 0.0380.001 | 11.40.2 | |
| 4686 He ii | 0.005 0.002 | 0.005 0.002 | 1.5 0.6 | 0.0110.001 | 0.0110.001 | 3.90.5 | |
| 4713 [Ar iv] + He i | 0.037 0.003 | 0.037 0.003 | 11.5 0.8 | 0.0410.001 | 0.0420.001 | 14.90.3 | |
| 4740 [Ar iv] | 0.019 0.003 | 0.019 0.003 | 6.0 0.8 | 0.0260.001 | 0.0260.001 | 9.50.3 | |
| 4861 H | 1.000 0.015 | 1.000 0.017 | 334.91.1 | 1.0000.002 | 1.0000.002 | 375.00.6 | |
| 4922 He i | 0.012 0.002 | 0.012 0.002 | 4.4 0.6 | 0.0130.001 | 0.0130.001 | 5.00.4 | |
| 4959 [O iii] | 2.086 0.031 | 2.054 0.031 | 726.71.3 | 2.0940.004 | 2.0690.004 | 817.90.9 | |
| 5007 [O iii] | 6.212 0.091 | 6.114 0.091 | 2208.02.0 | 6.2950.011 | 6.1920.011 | 2497.01.5 | |
| 5876 He i | 0.112 0.003 | 0.109 0.003 | 56.6 1.2 | 0.1110.001 | 0.1020.001 | 58.30.6 | |
| 6300 [O i] | 0.010 0.002 | 0.010 0.002 | 5.5 1.2 | 0.0090.001 | 0.0080.001 | 5.40.4 | |
| 6312 [S iii] | 0.015 0.002 | 0.015 0.002 | 8.4 1.1 | 0.0140.001 | 0.0130.001 | 8.50.4 | |
| 6563 H | 2.850 0.042 | 2.775 0.045 | 1620.02.4 | 3.1590.006 | 2.7760.006 | 2075.01.9 | |
| 6584 [N ii] | 0.017 0.002 | 0.016 0.002 | 9.9 1.3 | … | … | … | |
| 6678 He i | 0.029 0.002 | 0.028 0.002 | 16.8 1.2 | 0.0330.001 | 0.0290.001 | 22.70.6 | |
| 6717 [S ii] | 0.045 0.003 | 0.044 0.003 | 27.7 1.4 | 0.0320.001 | 0.0280.001 | 22.60.4 | |
| 6731 [S ii] | 0.033 0.003 | 0.032 0.003 | 19.6 1.5 | 0.0280.001 | 0.0250.001 | 19.90.4 | |
| 7065 He i | 0.031 0.003 | 0.030 0.003 | 18.4 2.2 | 0.0340.001 | 0.0290.001 | 24.30.7 | |
| 7136 [Ar iii] | 0.051 0.004 | 0.049 0.004 | 39.3 3.9 | 0.0630.001 | 0.0540.001 | 46.70.8 | |
| (H) dex | 0.0200.019 | 0.1650.002 | |||||
| (H)a,d | 4.080.01 | 3.480.01 | |||||
| (abs) Åe | 4.82.3 | 1.40.3 | |||||
aobserved fluxes.
bfluxes corrected for extinction and underlying stellar absorption.
cmeasured equivalent widths of the emission lines.
din units 10-14 erg s-1cm-2.
ecalculated equivalent widths of underlying hydrogen
absorption lines.
3 Results
3.1 Element abundances in the central star-forming region
In this section we derive the element abundances in the bright H ii region of Pox 186 and study its physical properties. Spectra used for the abundance determination are shown in Fig. 2.
The fluxes and equivalent widths of the emission lines with the errors have been measured by fitting Gaussians to the line profiles. For this we use the IRAF routine SPLOT. The errors have been propagated through the determination of the element abundances. Following the procedure detailed in Izotov et al. (ITL94 (1994); 1997a ) we corrected the observed emission line fluxes for the interstellar extinction and underlying hydrogen stellar absorption lines using the observed Balmer decrement of hydrogen emission lines. The correction was done by minimizing the deviations of corrected hydrogen emission line flux ratios from the theoretical ones. For this the H9 and H – H emission lines were used to correct the MMT spectrum, and the H12 – H9, H – H emission lines were used to correct the 3.6m spectrum. The H7 and H8 lines were not used because they are blended with the other emission lines. The observed (()) and corrected (()) emission line fluxes relative to the H emission line fluxes, their equivalent widths , the extinction coefficients (H), the observed fluxes of the H emission line, and the equivalent widths of the hydrogen absorption lines for the bright H ii region are shown in Table 1 for the MMT and 3.6m data, respectively.
In general, the agreement between the corrected emission line fluxes and their equivalent widths for the two observations is good. Note the very high equivalent widths of the H and H emission lines, implying a young age of the starburst in the central part of Pox 186. The extinction coefficients (H) = 0.02 0.02 (MMT) and 0.16 0.00 (3.6m) are in good agreement with the typical values of BCDs. We assume that (H) derived from the 3.6m spectrum is more reliable because of its higher signal-to-noise ratio and the lower airmass during the observations. Our derived (H) differs from the value (H) = 0.41 (() = 0.28) by Corbin & Vacca (V02 (2002)). Note that the H flux in both of our spectra is 2 times larger than that measured by Corbin & Vacca (V02 (2002)) within a larger aperture. However, our values are consistent with the H flux derived by Gil de Paz et al. (GMP03 (2003)) from narrow-band imaging of Pox 186.
The electron temperature , electron number density , ionic and total heavy element abundances were derived following Izotov et al. (ITL94 (1994); 1997a ) and Thuan et al. (til95 (1995)). Because the resolution of the 3.6m spectrum is low the [S ii] 6717 and 6731 lines are blended. Therefore, the number density (S ii) derived from this spectrum by deblending the [S ii] doublet is not certain. The same is valid for the sulfur abundance which is derived from the [S ii] 6717+6731 and [S iii] 6312 emission lines. The auroral [S iii] 6312 emission line in the 3.6m spectrum is blended with the [O i] 6300 emission line and its flux was derived after a deblending procedure. The flux of the [Ar iii] 7135 emission line and hence the Ar abundance derived from the 3.6m spectrum may be affected by contamination with the second order because no blocking filter was used. Finally, no nitrogen abundance was derived from the 3.6m spectrum because the weak [N ii] 6584 emission line is blended with strong H.
The electron temperatures (O iii), (S iii) (Ar iii), (O ii) for the high-, intermediate- and low-ionization regions respectively, the electron number densities (S ii), ionization correction factors (ICF), ionic and total heavy element abundances are shown in Table 2. The oxygen abundance 12 + log(O/H) = 7.76 0.02 (MMT) and 7.74 0.01 (3.6m) for the bright H ii region are within the errors in agreement with 12 + log(O/H) = 7.72 0.02 derived by Kunth & Sargent (K83 (1983)) and 7.73 derived by Corbin & Vacca (V02 (2002)).
The five brightest He i 3889, 4471, 5876, 6678, 7065 emission lines were used for determining the He abundance. Their fluxes were corrected for collisional and fluorescent enhancements according to Izotov et al. (ITL94 (1994); 1997a ). This was made by minimizing the deviations of the corrected He i line flux ratios from the recombination ratios, varying the electron number density in He+ zone and optical depth in the He i 3889 transition. Singly ionized helium abundances He+/H+ derived from the corrected He i 4471, 5876, 6678 line fluxes and their weighted mean are shown in Table 2. A small contribution of He+2 was added, because He ii 4686 is present. The mean 4He mass fractions = 0.2480.009 (MMT) and 0.2480.004 (3.6m) (Table 2) are consistent with the value = 0.2450.012 derived for Pox 186 by Kunth & Sargent (K83 (1983)). They are also consistent with the primordial 4He mass fraction = 0.244 0.002, derived by extrapolating the vs O/H linear regression to O/H = 0 (Izotov & Thuan IT98 (1998)), or with = 0.245 0.002 derived from the spectroscopic observations of the two most metal-deficient BCDs I Zw 18 and SBS 0335–052 (Izotov et al. I99 (1999)).
The N/O, Ne/O, S/O and Ar/O abundance ratios vs oxygen abundance 12 + log(O/H) in Pox 186 are shown in Fig. 3 by the filled triangles and filled squares, respectively, for the MMT and 3.6m observations. For comparison, by the open circles are shown the BCDs from Izotov & Thuan (IT99 (1999)). We find a rather high value of log(N/O) in Pox 186 for its oxygen abundance (Fig. 3) which is however in agreement with log(N/O) = –1.38 derived by Kunth & Sargent (K83 (1983)) and with the value of –1.42 recomputed by Kobulnicky & Skillman (Kob96 (1996)) from the Kunth & Sargent data.
The most striking feature of Fig. 3 is that the S/O abundance ratio derived from the MMT spectrum is 2 times higher than the mean value for BCDs. On the other hand the sulfur abundance derived from the 3.6m spectrum is lower. However, the [S iii] 6312 emission line in the 3.6m spectrum is blended with the [O i] 6300 emission line. This makes the sulfur abundance derived from the 3.6m spectrum less reliable. Sulfur, similar to oxygen, neon and argon, is produced by massive stars. The Ne/O abundance ratio in Pox 186 does not show a deviation from the mean BCD value and the Ar/O abundance ratio is slightly above the mean. Therefore, no significant deviation is expected for the S/O abundance ratio. Thus, we conclude that the apparently high S/O abundance ratio in Pox 186 is probably not due to nucleosynthetic processes.
| Value | MMT | 3.6m | |
|---|---|---|---|
| (O iii)(K) | 16390240 | 1694060 | |
| (O ii)(K) | 14390200 | 1461050 | |
| (Ar iii)(K) | 15300200 | 1576050 | |
| (S iii)(K) | 15300200 | 1576050 | |
| (S ii)(cm-3) | 70110 | 35060 | |
| O+/H+(105) | 0.2760.076 | 0.3290.010 | |
| O+2/H+(105) | 5.3870.205 | 5.0570.137 | |
| O+3/H+(106) | 0.2950.130 | 0.0640.008 | |
| O/H(105) | 5.6930.219 | 5.4490.138 | |
| 12 + log(O/H) | 7.760.02 | 7.740.01 | |
| N+/H+(107) | 1.3050.124 | … | |
| ICF(N)a | 20.62 | … | |
| log(N/O) | –1.330.04 | … | |
| Ne+2/H+(105) | 0.7960.039 | 0.8080.023 | |
| ICF(Ne)a | 1.06 | 1.08 | |
| log(Ne/O) | –0.830.03 | –0.800.02 | |
| S+/H+(107) | 0.8090.043 | 0.5680.014 | |
| S+2/H+(107) | 7.0811.108 | 5.6750.324 | |
| ICF(S)a | 4.31 | 3.60 | |
| log(S/O) | –1.220.06 | –1.380.03 | |
| Ar+2/H+(107) | 1.7230.145 | 1.7860.047 | |
| Ar+3/H+(107) | 2.2340.321 | 2.9230.112 | |
| ICF(Ar)a | 1.01 | 1.00 | |
| log(Ar/O) | –2.160.04 | –2.060.02 | |
| He+/H+(4471) | 0.0810.006 | 0.0800.002 | |
| He+/H+(5876) | 0.0840.004 | 0.0820.002 | |
| He+/H+(6678) | 0.0800.006 | 0.0840.003 | |
| He+/H+ (mean) | 0.0820.003 | 0.0820.001 | |
| He+2/H+(4686) | 0.0000.000 | 0.0010.000 | |
| He/H | 0.0820.003 | 0.0830.001 | |
| 0.2480.009 | 0.2480.004 |
aICF is the ionization correction factor.
Inspection of Table 2 shows that the ionization correction factor ICF(S) in Pox 186 is high, compared to those for neon and argon. In Fig. 4 we show for the sample of BCDs the dependences on the ICF(S) of the [O iii]4959/[O ii]3727 and [O ii]3727/H flux ratios [(a) and (b), respectively] and oxygen abundance 12 + log(O/H) (c). Pox 186 is shown by stars. Observations of other BCDs shown by filled circles are collected from Izotov & Thuan (IT04 (2004)), Izotov, Thuan & Lipovetsky (1997a ), Fricke et al. (F01 (2001)), Izotov, Chaffee & Green (ICG01 (2001)), Izotov et al. (I99 (1999); 2004a ), Guseva et al. (G03 (2003)). It is seen from Fig. 4 that Pox 186 deviates from other BCDs and exhibits the largest ICF(S).
In this paper we use the ICFs obtained from the ionization-bounded H ii region models of Stasińska (S90 (1990)). The ICFs are fitted by Izotov et al. (ITL94 (1994); 1997a ) and Thuan et al. (til95 (1995)) as functions of O+/O and O+2/O abundance ratios, where O = O+ + O+2. However, there is some evidence that the ICFs for sulfur obtained from the Stasińska (S90 (1990))’ models may not be correct. Recently, Pérez-Montero & Díaz (PD03 (2003)) presented long-slit spectroscopic observations in the red and near-infrared of a sample of the emission-line galaxies. Using these data and photoionization models obtained with the CLOUDY code (Ferland F02 (2002)) they found that the S/O abundance ratios are 0.2 dex lower than those obtained with the Izotov et al. (ITL94 (1994); 1997a ) correction factors. Furthermore, Stasińska & Izotov (SI03 (2003)) produced a new grid of photoionized H ii region models which reproduce the relations between the observed emission line fluxes for a large sample of BCDs. Based on these models and additionally taking into account dielectronic recombination of sulfur and argon ions Izotov et al. (2004b ) obtained new ICFs for heavy elements. The S/O abundance ratios for BCDs from the comparison sample recalculated with new ICFs are decreased by 0.15 dex compared to the values shown in Fig. 3c, in agreement with Pérez-Montero & Díaz (PD03 (2003)). The effect is larger for Pox 186, 0.25 dex. However, even with the new ICFs the S/O ratio in Pox 186 is 0.2 dex higher than in other BCDs.
The H ii region in Pox 186 is characterised by a very high O+2/O+ abundance ratio of 20 (Table 2). Hence, almost all oxygen in this H ii region is in the O+2 form. Such a situation may occur if the H ii region is not ionization-bounded, but density-bounded. The abundance of O+ ion is sensitive to this effect because of the essentially same ionization potentials of H0 and O0. Therefore, the fraction O+/O in the density-bounded H ii region is lower than that in the ionization-bounded H ii region. Then the ionization correction factors, which are obtained for ionization-bounded H ii regions, may not be valid for some elements. Since the sulfur abundance is derived from the low-ionization ions S+ and S+2 it is also sensitive to the structure of the outer part of the H ii region. Indeed, the ionization correction factor ICF(S) is proportional to O/O+ in the ionization-bounded H ii regions with low O+/O abundance ratio (Izotov et al. ITL94 (1994); 1997a ; 2004b ). On the other hand, ICF(Ne) 1 and ICF(Ar) 1 in a H ii region with low O+/O abundance ratio, as in the case of Pox 186, because the abundances of neon and argon are derived from the ions in higher ionization stages compared to sulfur. These ions are situated in the inner part of the H ii region and hence the ICFs for neon and argon are less sensitive to the structure of the outer zone of the H ii region.
There is some observational evidence that the H ii region in Pox 186 may be density-bounded. First, no H i 21 cm emission was detected (Kunth et al. KMV88 (1988)). Second, Corbin & Vacca (V02 (2002)) noted that the Ly emission line is likely present in the UV spectrum of Pox 186. However, this detection is not very confident because of blending with the geocoronal Ly. In fact, Ly emission is only indicative of a density-bounded H ii region. Such emission is also expected from an ionization-bounded H ii region under certain conditions (e.g., Kunth et al. K03 (2003) and references therein). An example is the BCD Tol 1214–277 with the second largest ICF(S) after Pox 186 (Fig. 4). Its S/O abundance ratio is close to the mean BCD value (e.g., Izotov et al. ICG01 (2001)). Izotov et al. (2004a ) have shown that the emission line fluxes in Tol 1214–277 are best reproduced by an ionization-bounded H ii region model. Nevertheless, Thuan & Izotov (ti97 (1997)) have detected the Ly emission line in the UV HST GHRS spectrum of Tol 1214–277 with the largest equivalent width (Ly) = 70Å known for the BCDs. Although there is no direct observational evidence for a density-bounded H ii region in Pox 186, such possibility is not excluded and may be helpful in understanding the high S/O abundance ratio in this system. It is worth noting that the detection of a weak [O i] 6300 emission line suggests that some amount of clumpy neutral gas is also present in Pox 186.


3.2 The nature and morphology of the extended LSB emission
The nature of the LSB extended emission in Pox 186 is important for understanding the evolutionary status of the galaxy. Doublier et al. (D00 (2000)) and Corbin & Vacca (V02 (2002)) based on photometric data alone have concluded that the extended emission is stellar, ruling out a significant contribution from ionized gas. In this section we analyze the spectroscopic and photometric data for Pox 186 and show that, contrary to the Doublier et al. (D00 (2000)) and Corbin & Vacca (V02 (2002)) suggestions, the emission of the extended component is strongly contaminated by the ionized gas.
We first consider the results of the H photometry of Pox 186 by Gil de Paz et al. (GMP03 (2003)). From their data, the angular diameter of Pox 186 in H is 4″ (or 360 pc in linear scale). Gil de Paz et al. (GMP03 (2003)) have derived an equivalent width (H) = 907Å for the whole galaxy. This value may be considered a lower limit because background galaxies seen in the vicinity of Pox 186 (Fig. 1) contribute to the continuum. Our spectroscopic data suggest that ionized gas emission is present also at larger distances. In Fig. 5 we show the spectra of Pox 186 at distances –4″ and +4″ from the brightest part of the galaxy along the slit at P.A. = 0 (MMT observations). The positive coordinates are to the north. The strongest emission lines are clearly detected in both spectra.
To estimate the contribution of the ionized gas emission to the total light of the galaxy we obtain the distributions along the slit at P.A.=–68 (3.6m observations) of the H and H emission line fluxes and equivalent widths. They are shown in Fig. 6. We also show in the figure the distribution of the continuum adjacent to the H emission line. The H and H emission is detected at distances out to 6″ (or 540 pc) from the center of the galaxy (Fig. 6a). The equivalent widths of the emission lines in the inner region with radius 3″ are very high, EW 2000Å in the case of H emission line. Hence, the contribution of the gaseous continuum near H is 50%; the fraction of gaseous emission is higher if H is included. Note that the equivalent widths of the H and H emission in the case of pure gaseous emission are 1000Å and 4000Å, respectively (Aller Aller84 (1984)). The fraction of the gaseous continuum near the H emission line in Pox 186 is smaller, 30% - 40%. However, the inclusion of strong [O iii] 4959, 5007 emission lines results in a larger fraction of gaseous emission in the band. Hence, we conclude that the extended emission of Pox 186 at radii 3″ (or 270 pc) is mainly produced by the ionized gas. At radii 3″ the measurements of the equivalent widths are uncertain because of low continuum fluxes (Fig. 6a) and likely contributions from background galaxies, although emission lines are clearly detected.
Doublier et al. (D00 (2000)) and Corbin & Vacca (V02 (2002)) discussed the stellar populations in Pox 186 at distances 3″ where the fraction of gaseous emission to the total light is large. Omission of gaseous emission by these authors leads to doubtful conclusions on the properties of stellar populations in Pox 186. The gaseous emission must be first subtracted to obtain reliable results on the properties of the stellar populations in the extended LSB component. For this the detailed determination of the equivalent widths and relative fluxes of the nebular lines is necessary. Additionally, much care should be exercised to take into account the light from the background galaxies which around Pox 186 are numerous (Fig. 1).
The difficulties of the analysis of stellar populations in Pox 186 are illustrated with Fig. 7 where we show the distributions of the surface brightness in and bands and colour in Pox 186 at P.A. = 0 corresponding to the location and width of the slit during the MMT observations. The origin is set to the maximum intensity in . The central part of Pox 186 is very blue with –0.8 (Fig. 7c) and can be explained only if both stellar and gaseous emission are taken into account. The synthetic colour of a 3 Myr old stellar population superposed on ionized gas emission is shown by a filled circle and is in good agreement with the observed colour. By contrast, a pure 3 Myr old stellar emission is by 0.5 mag redder (asterisk in Fig.7c) and is inconsistent with observations. The colour increases with increasing distance along the slit and becomes very red at distances 3″ from the center. At larger distances it gets again bluer. The very red region in Fig.7c at distance between +2″ and +4″ is associated with the background galaxy seen in Fig. 1 to the north of Pox 186. It is likely that the red spike at –3″ in Fig.7c is also associated with a background galaxy.
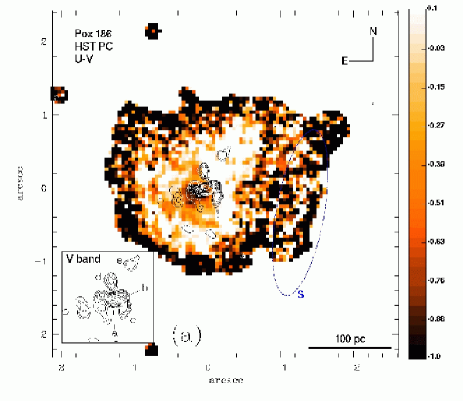
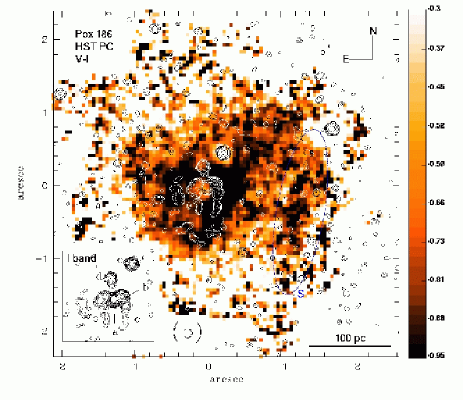
The appreciable contribution of the ionized gas emission in Pox 186 can also be verified from the and colour maps (Fig. 8). In this figure compact sources in the central part of the galaxy are shown by contours, which are computed from and images after applying a modified unsharp-masking technique (Papaderos et al. P98 (1998); Noeske et al. N03 (2003)). Magnified versions of these contour maps with the sources labeled are shown in the lower-left corners of each panel. The ellipses in both panels indicate the location of the curved feature S. This feature has been suggested by Corbin & Vacca (V02 (2002)) to be tidally ejected material in a recent collision between two smaller galaxies.
The central starburst emission splits into a pair of compact clusters a and b with diameters 10 pc in and a combined absolute magnitude, corrected for the local background, of mag. The cluster b is by 0.6 mag bluer in than cluster a, whereas the opposite trend is seen in the (Fig. 8). This is probably due to the growing importance of nebular line emission westwards of cluster a, rather than due to extinction or age effects. This is because the colour in cluster b, –1 mag, is too blue to be accounted for by stellar emission alone.
Regions with red and blue colours in Fig. 8 are 1) spatially correlated and 2) more extended (with diameters 200 pc) than the compact stellar clusters. Such a colour distribution is characteristic not of stellar emission, but of extended ionized gas emission surrounding a more compact ionizing source. This is consistent with the very blue colour of –1 mag inside a radius of 2″ read off Fig. 1 of Doublier et al. (D00 (2000)).

Corbin & Vacca (V02 (2002)) have proposed that Pox 186 is the result of the collision of two smaller galaxies. The available photomeric data does not allow for a decisive check of this hypothesis. Pox 186 possesses an irregular LSB component with no signs of tidal tails, at least down to 25.5 mag arcsec-2. The colours of feature S are consistent with those for nebular gas emission. Although the possibility of intense star formation within a stellar tidal tail cannot be excluded, the overall evidence favours the idea that S is rather a starburst-driven gaseous shell.
| Band | ||||
|---|---|---|---|---|
| mag/ | pc | mag | mag | |
| (1) | (2) | (3) | (4) | (5) |
| 21.041.10 | 9932 | 18.83 | 17.430.03 | |
| 21.260.44 | 12021 | 18.63 | 18.030.02 |
The surface brightness profiles (SBPs) of Pox 186 (Fig. 9) have been computed using method iv described in Papaderos et al. (P02 (2002)) after background sources indicated in Fig. 1 have been removed. Note that because the morphology of Pox 186 is not far from circular symmetry, the equivalent radius of SBPs is approximately equal to the galactocentric distance. This makes possible an easy comparison of the distributions shown in Fig. 9 with those shown in Figs. 6 – 8 of this paper. We decompose SBPs into a) an exponential LSB emission and b) the starburst emission in excess of the latter component. In Columns 2 and 3 of Table 3 we list respectively the central surface brightness and scale length of the LSB component as obtained from linear fits in the radius range 29 37. Col. 4 gives the total magnitude of the LSB component, extrapolated to infinity, and Col. 5 the total magnitude of Pox 186, obtained from SBP integration. Note the red (0) and blue (–0.9) colours in the region with the equivalent radius in the range 03075 (Fig. 9). Such colours are characteristics of dominant ionized gas emission. At larger distances and become, respectively, bluer and redder. Such trend can partly be explained by ionized gas emission, because the ionization parameter in the H ii region decreases outwards and hence the relative fluxes of [O iii] 4959, 5007 emission lines, contributing to the band, are also decreased. In the outermost regions with 3″ further reddening in may be caused by the faint background galaxies seen in Fig. 1. Because of the contribution of ionized gas emission, photometric uncertainties and possible contamination by the background galaxies we do not attempt to study in detail the properties of stellar populations in the outermost regions of Pox 186. Nevertheless, assuming formally that the emission of ionized gas and background objects in the outermost regions is negligible we find that the colour of 0.4 corresponds to ages of 100 Myr and 1 Gyr respectively for an instantaneous burst and continuous star formation (see, e.g., Guseva et al. G01 (2001) for details). However, these age estimates are highly uncertain.
The comparison of and in Table 3 indicates that the starburst emission makes up at least 3/4 of the total luminosity. The exponential scale length of the LSB component was derived to be 100 pc in and 120 pc in . We note, however, that both and may be significantly affected by extended ionized gas emission which, as pointed out in Sect. 3.2, is present even beyond 4″. The fact that the LSB emission shows an exponential slope does not rule out the hypothesis that it is partly due to ionized gas emission: as shown empirically in Papaderos et al. (P02 (2002)), extended H emission in several star-forming dwarf galaxies can also be well fitted by an exponential law in its outermost part, on scales of kpc away from the starburst region. Such arguments suggest that deeper data, corrected for the effect of extended nebular emission and confusion with background sources are clearly needed to settle the question of the nature of stellar populations in Pox 186.
4 Conclusions
We use ground-based spectroscopic and HST photometric observations of the ultracompact blue compact dwarf (BCD) galaxy Pox 186 to study the properties of its bright H ii region and the nature of the extended low-surface-brightness (LSB) component.
Our main results are as follows:
-
1.
The light of the extended component in Pox 186 at radii 3″ (or 270 ps in linear scale) is dominated by ionized gas emission. This conclusion is based on the detection of H and H emission lines with very high equivalent widths. In particular, the equivalent width of H is 2000Å in this region. The strongest emission lines are seen at radii as large as 6″ ( 540 pc in linear scale). However, the faintness of the galaxy at distances 3″ precludes a reliable determination of the equivalent widths. Therefore, conclusions made in some previous studies on the properties of stellar populations in Pox 186 and its evolutionary status appear not to be tenable and need to be critically revised because no correction for the contribution of the ionized gas emission was done.
-
2.
At least 3/4 of the -band emission of Pox 186 originates from the star-forming component. The surface brightness distribution of the extended LSB component can be approximated by an exponential law with a scale length 120 pc. Since its emission is partly gaseous in origin, may be even smaller. Hence, Pox 186 is one of the most compact BCDs known.
-
3.
Values for the oxygen abundance 12 + log(O/H) = 7.76 0.02 and 7.74 0.01 (/15) are derived in the bright H ii region of Pox 186 from spectra obtained, respectively, with the Multiple Mirror Telescope (MMT) and 3.6m European Southern Observatory (ESO) telescope. The Ne/O and Ar/O abundance ratios are close to the mean ratios known for BCDs. On the other hand, the S/O abundance ratio in Pox 186 is derived to be 2 times larger than the mean BCD ratio. We argue, that the sulfur abundance in Pox 186 is normal, but the apparent elevation of the S/O ratio is due to the a) uncertainties in the ionization correction factor for sulfur and b) H ii region in Pox 186 being density-bounded.
-
4.
The helium mass fractions in the H ii region are = 0.2480.009 and = 0.2480.004 for the MMT and 3.6m data, respectively, suggesting high primordial helium abundance.
Acknowledgements.
We thank the referee, Nils Bergvall, for the valuable comments which improved the presentation of the results. N.G.G. and Y.I.I. have been supported by DFG grant 436 UKR 17/22/03, by Swiss SCOPE 7UKPJ62178 grant and by grant No. 02.07/00132 of the Ukrainian fund for fundamental investigations. They are grateful for the hospitality of the Göttingen Observatory. Y.I.I. acknowledges the Göttingen Academy of Sciences for a Gauss professorship. P.P. and K.J.F. acknowledge support by the Volkswagen Foundation under grant No. I/72919.References
- (1) Aller, L. H. 1984, Physics of Thermal Gaseous Nebulae, Dordrecht: Reidel
- (2) Anders, E., & Grevesse, N. 1989, Geochim.Cosmochim.Acta, 53, 197
- (3) Corbin, M. R., & Vacca, W. D. 2002, ApJ, 581, 1039
- (4) Doublier, V., Kunth, D., Courbin, F., & Magain, P. 2000, A&A, 353, 887
- (5) Ferland, G. J. 2002, CLOUDY, Univ. of Kentucky, Dept. of Phys. and Astron. Internal Rep.
- (6) Fricke, K. J., Izotov, Y. I., Papaderos, P., Guseva, N. G., & Thuan, T. X. 2001, AJ, 121, 169
- (7) Gil de Paz, A., Madore, B. F., & Pevunova, O. 2003, ApJS, 147, 29
- (8) Guseva, N. G., Izotov, Y. I., Papaderos, P., et al. 2001, A&A, 378, 756
- (9) Guseva, N. G., Papaderos, P., Izotov, Y. I., et al. 2003, A&A, 407, 105
- (10) Holtzman, J. A., Burrows, C. J., Casertano, S., et al. 1995, PASP, 107, 1065
- (11) Izotov, Y. I., & Thuan, T. X. 1998, ApJ, 500, 188
- (12) Izotov, Y. I., & Thuan, T. X. 1999, ApJ, 511, 639
- (13) Izotov, Y. I., & Thuan, T. X. 2004, ApJ, 602, 200
- (14) Izotov, Y. I., Thuan, T. X., & Lipovetsky, V. A. 1994, ApJ, 435, 647
- (15) Izotov, Y. I., Thuan, T. X., & Lipovetsky, V. A. 1997a, ApJS, 108, 1
- (16) Izotov, Y. I., Lipovetsky, V. A., Chaffee, F. H., et al. 1997b, ApJ, 476, 698
- (17) Izotov, Y. I., Chaffee, F. H., Foltz, C. B., et al. 1999, ApJ, 527, 757
- (18) Izotov, Y. I., Chaffee, F. H., & Green, R. F. 2001, ApJ, 562, 727
- (19) Izotov, Y. I., Noeske, K. G., Guseva, N. G., Papaderos, P., Thuan, T. X., & Fricke, K. J. 2004a, A&A, 415, L27
- (20) Izotov, Y. I., Stasińska, G., Meynet, G., Guseva, N. G., & Thuan, T. X. 2004b, in preparation
- (21) Kobulnicky, H. A., & Skillman, E. D. 1996, ApJ, 471, 211
- (22) Kraan-Korteweg, R. C. 1986, A&AS, 66, 255
- (23) Kunth, D., & Sargent, W. L. W. 1983, ApJ, 273, 81
- (24) Kunth, D., Sargent, W. L. W., & Kowal, C. 1981, A&AS, 44, 229
- (25) Kunth, D., Maurogordato, S., & Vigroux, L. 1988, A&A, 204, 10
- (26) Kunth, D., Leitherer, C., Mas-Hesse, J. M., Östlin, G., & Petrosian, A. 2003, ApJ, 597, 263
- (27) Noeske, K. G., Papaderos, P., Cairós, L. M., & Fricke, K. J. 2003, A&A, 410, 481
- (28) Papaderos, P., Izotov, Y. I., Fricke, K. J., Thuan, T. X., & Guseva, N. G. 1998, A&A, 338, 43
- (29) Papaderos, P., Izotov, Y. I., Thuan, T. X., et al. 2002, A&A, 393, 461
- (30) Pérez-Montero, E., & Díaz, A. I. 2003, MNRAS, 346, 105
- (31) Schaerer, D., & de Koter, A. 1997, A&A, 322, 598
- (32) Schlegel, D. J., Finkbeiner, D. P., & Davis, M. 1998, ApJ, 500, 525
- (33) Stasińska, G. 1990, A&AS, 83, 501
- (34) Stasińska, G., & Izotov, Y. I. 2003, A&A, 397, 71
- (35) Thuan, T. X., & Izotov, Y. I. 1997, ApJ, 489, 623
- (36) Thuan, T. X., Izotov, Y. I., & Lipovetsky, V. A. 1995, ApJ, 445, 108