Deep Hubble Space Telescope/ACS Observations of I Zw 18: a Young Galaxy in Formation111Based on observations obtained with the NASA/ESA Hubble Space Telescope through the Space Telescope Science Institute, which is operated by AURA,Inc. under NASA contract NAS5-26555.
Abstract
We present and photometry of the resolved stars in the most metal-deficient blue compact dwarf galaxy known, I Zw 18 (/50), using Hubble Space Telescope/Advanced Camera for Surveys (ACS) images, the deepest ones ever obtained for this galaxy. The resulting vs. color-magnitude diagram (CMD) reaches limiting magnitudes = = 29 mag. It reveals a young stellar population of blue main-sequence (MS) stars (age 30 Myr) and blue and red supergiants (10 Myr age 100 Myr), but also an older evolved population of asymptotic giant branch (AGB) stars (100 Myr age 500 Myr). We derive a distance to I Zw 18 in the range 12.6 Mpc – 15 Mpc from the brightness of its AGB stars, with preferred values in the higher range. The red giant branch (RGB) stars are conspicuous by their absence, although, for a distance of I Zw 18 15 Mpc, our imaging data go 1 – 2 mag below the tip of the RGB. Thus, the most evolved stars in the galaxy are not older than 500 Myr and I Zw 18 is a bona fide young galaxy. Several star formation episodes can be inferred from the CMDs of the main body and the C component. There have been respectively three and two episodes in these two parts, separated by periods of 100 – 200 Myr. In the main body, the younger MS and massive post-MS stars are distributed over a larger area than the older AGB stars, suggesting that I Zw 18 is still forming from the inside out. In the C component, different star formation episodes are spatially distinct, with stellar population ages decreasing from the northwest to the southeast, also suggesting the ongoing build-up of a young galaxy.
1 Introduction
The question of whether there are young galaxies in the local universe forming stars for the first time is of considerable interest for galaxy formation and cosmological studies. There are several reasons for this. First, Cold Dark Matter models predict that low-mass dwarf galaxies could still be forming at the present epoch because they originate from density fluctuations considerably smaller than those giving rise to the giant ones. Thus the existence of young dwarf galaxies in the local universe would put strong constraints on the primordial density fluctuation spectrum. Second, while much progress has been made in finding large populations of galaxies at high ( 3) redshifts (e.g. Steidel et al., 1996), truly young galaxies in the process of forming remain elusive in the distant universe. The spectra of those far-away galaxies generally indicate the presence of a substantial amount of heavy elements, implying previous star formation and metal enrichment. Thus it is important to have examples of bona fide young galaxies in the local universe because they can be used as laboratories to study star formation and chemical enrichment processes in environments that are sometimes much more pristine than those in known high-redshift galaxies. Moreover, their proximity allows studies of their structure, metal content, and stellar populations with a sensitivity, precision, and spatial resolution that faint distant high-redshift galaxies do not allow. Finally, in the hierarchical model of galaxy formation, large galaxies result from the merging of smaller structures. These building-block galaxies are too faint and small to be studied at high redshifts, while we stand a much better chance of understanding them if we can find local examples.
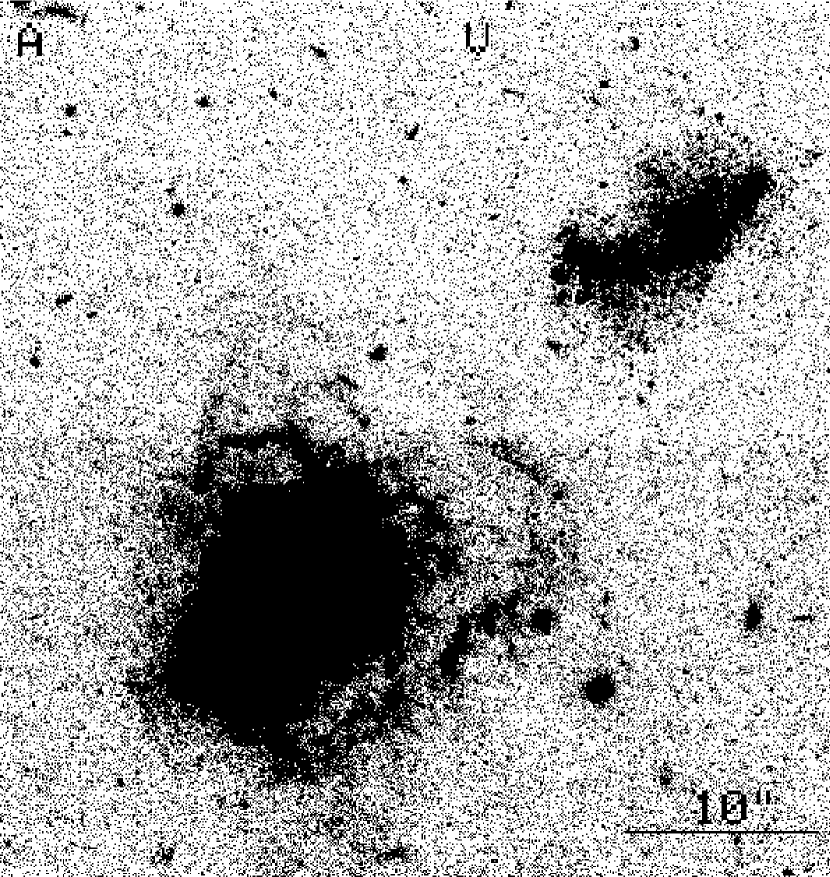
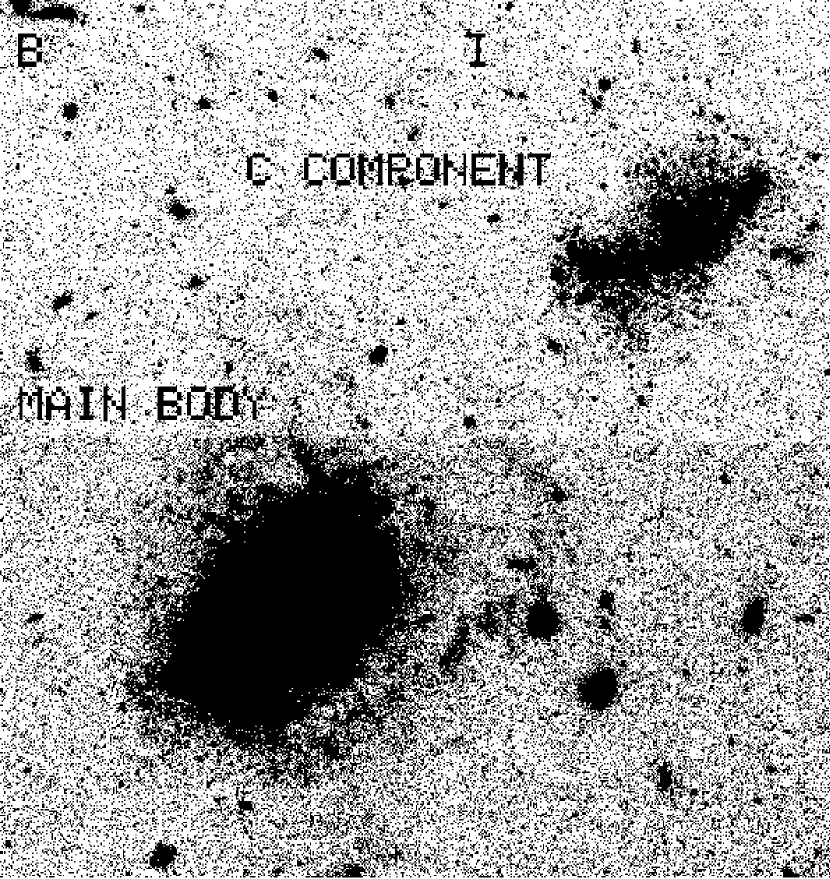
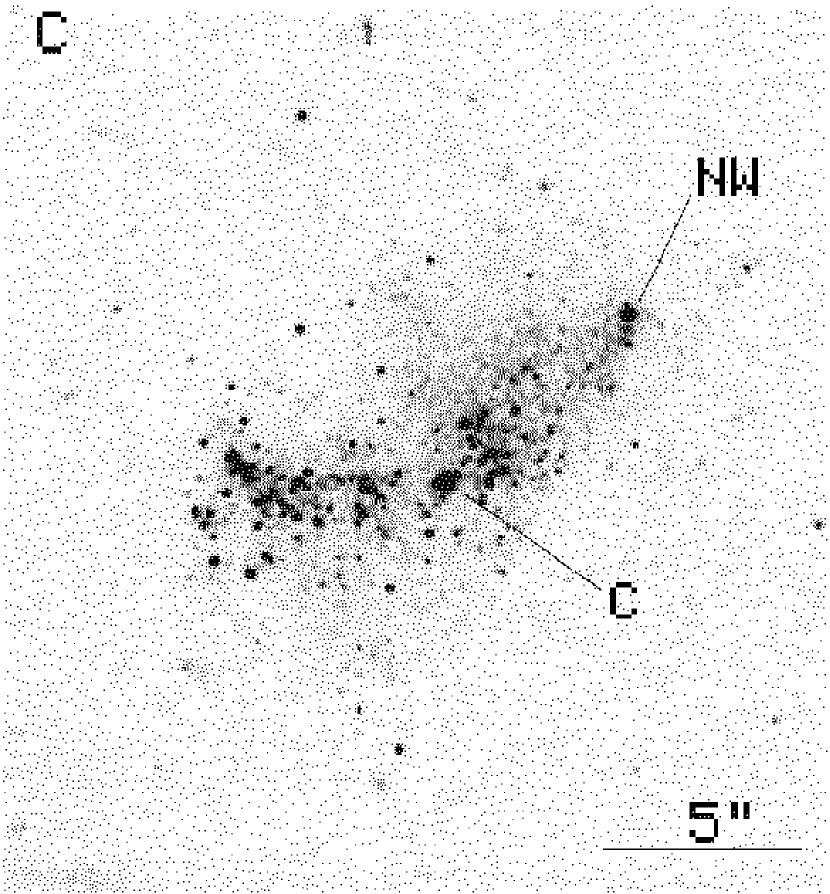
The blue compact dwarf (BCD) galaxy I Zw 18 is one of the best candidates for being a truly young galaxy. Zwicky (1966) described it as a double system of compact galaxies, which are in fact two bright knots of star formation with an angular separation of 58. These two star-forming regions are referred to as the brighter northwest (NW) and fainter southeast (SE) components. They form what we will refer to as the main body (Figure 1). The presence of ionized gas emission (e.g. Hunter & Thronson, 1995) and of Wolf-Rayet stars in the NW component (Izotov et al., 1997; Legrand et al., 1997; Brown et al., 2002) suggest active ongoing star formation in the main body. Later studies by Davidson et al. (1989) and Dufour & Hester (1990) have revealed a more complex optical morphology. They pointed out the existence of a prominent diffuse feature 22″ northwest of the main body, hereafter called the C component (Figure 1), which contains a blue irregular star-forming region. Dufour et al. (1996a), Izotov & Thuan (1998) and van Zee et al. (1998) have shown the C component to have a systemic radial velocity equal to that of the ionized gas in the main body, thus establishing its physical association to I Zw 18. Furthermore, the interferometric H i map of I Zw 18 by van Zee et al. (1998) has shown that the C component is embedded in a common H i envelope with the main body.
I Zw 18 remains the most metal-poor BCD and the lowest metallicity star-forming galaxy known since its discovery by Sargent & Searle (1970). Later spectroscopic observations by Searle & Sargent (1972), Lequeux et al. (1979), French (1980), Kinman & Davidson (1981), Pagel et al. (1992), Skillman & Kennicutt (1993), Izotov & Thuan (1998) and Izotov et al. (1999) have confirmed its low metallicity, with an oxygen abundance of only 1/50 the solar value.
Many studies have focused on the evolutionary state of I Zw 18. Searle & Sargent (1972) and Hunter & Thronson (1995) have suggested that it may be a young galaxy, recently undergoing its first burst of star formation. The latter authors concluded from Hubble Space Telescope (HST)/Wide Field and Planetary Camera 2 (WFPC2) images that the colors of the diffuse unresolved component surrounding the SE and NW regions are consistent with a population of B and early A stars, with no evidence for older stars. From color-magnitude diagram (CMD) studies of the main body based on other HST/WFPC2 images, Dufour et al. (1996b) have found that star formation in I Zw 18 began at least 30 – 50 Myr ago and is still continuing to the present. Aloisi et al. (1999) have discussed the star formation history in I Zw 18 using the same HST/WFPC2 data as Hunter & Thronson (1995) and Dufour et al. (1996b), but going deeper thanks to a more sophisticated treatment of the data. By comparing the observed CMDs and luminosity functions with the synthetic ones, they concluded that there were two episodes of star formation in I Zw 18. The first star formation episode occurred 0.5 – 1 Gyr ago, as evidenced by the presence of asymptotic giant branch (AGB) stars. This age is more than 10 times larger than the one obtained by Dufour et al. (1996b). The more intense second star formation episode took place between 15 and 20 Myr ago. Subsequently, Östlin (2000) has carried out a near-infrared (NIR) CMD study based on HST/Near Infrared Camera and Multi Object Spectrometer (NICMOS) (F110W) and (F160W) images. He concluded that the main body of I Zw 18 is dominated by two populations, a 10 – 20 Myr population of red supergiants (RSG) and a considerably older (0.1 – 5 Gyr) population of AGB stars.
Because of its faintness, the C component has not been studied in as much detail. Its optical spectrum (Izotov & Thuan, 1998; Izotov et al., 2001; van Zee et al., 1998) reveals a blue continuum with weak Balmer absorption features and faint H and H in emission, suggesting that the H ii region is ionized by a population of early B stars. In a vs. CMD analysis of the C component, Dufour et al. (1996b) have found a well-defined stellar upper main-sequence (MS) of blue stars with ages 40 Myr. However, numerous faint red stars are also present, with ages 100 – 300 Myr. Those authors concluded that the C component consists of an older stellar population with an age of several hundred Myr, but that it has experienced more recently a modest starburst in its southeastern half, as evidenced by the presence of blue stars and H emission. Aloisi et al. (1999) have estimated an age for the C component not exceeding 200 Myr.
Using integrated optical and NIR photometric colors derived from ground-based and archival HST images, Papaderos et al. (2002) and Hunt et al. (2003) have shown that the age of I Zw 18 as a whole, including both the main body and the C component, does not exceed 500 Myr. This is in agreement with the upper age limits obtained by Hunter & Thronson (1995), Aloisi et al. (1999) and Dufour et al. (1996b), but in contradiction with the large one of 5 Gyr obtained by Östlin (2000).
Legrand (2000) and Legrand et al. (2000) have proposed an extreme scenario in which star formation in I Zw 18 proceeds, not only in recent short episodic bursts, but also in a continuous fashion at a low level over a long period of many Gyr. This would result in an extended underlying low-surface-brightness (LSB) red stellar component in I Zw 18. However, Izotov et al. (2001) and Papaderos et al. (2002) have shown that the existence of such a component is supported neither by spectroscopic nor photometric measurements of the extended emission around I Zw 18.
It is evident that despite considerable work, the debate on the age of I Zw 18 is still not settled. The evolutionary status of I Zw 18 remains elusive because of several limitations in the preceding work. Previous studies of stellar populations in I Zw 18 based on integrated photometric colors or on spectral synthesis do not provide a unique star formation history. CMD studies constrain better the star formation history, but until now the available HST/WFPC2 images on which these studies are based did not go deep enough below the tip of the red giant branch (TRGB) to reveal whether a faint old ( 1 – 2 Gyr) stellar population of red giant branch (RGB) stars exists in I Zw 18 or not. Evidently deeper HST observations were needed. The installation of the Advanced Camera for Surveys (ACS) on HST in 2003 made those deeper observations possible.
We use here new deep HST/ACS imaging of I Zw 18 in and to go 1 – 2 mag below the TRGB and put more stringent constraints on the state of evolution of the BCD. The observations and data reduction are described in Sect. 2. The lack of a RGB population in the CMD of I Zw 18 is examined in Sect. 3. The distance determination to I Zw 18 is discussed in Sect. 4. CMDs of the stellar populations are studied in Sect. 5. We find that I Zw 18 does not contain stars older than 500 Myr, making it a truly young galaxy. Our results are summarized in Sect. 6.
2 Observations and data reduction
We have obtained HST images of I Zw 18 during the 2003 May 26 – June 6 period in the course of eight visits totaling 25 orbits, with the ACS/Wide Field Camera (WFC) detector through filters F555W and F814W, which we will refer to hereafter as and . The exposure was obtained during five visits totaling 16 orbits and the exposure during three visits with a total of 9 orbits. All observations were obtained with the same orientation of the field of view, with one exposure per orbit, split into two subexposures to permit cosmic ray removal. Drizzling was applied so that separate exposures obtained during one visit were slightly offset with respect to one another to permit better spatial sampling. The total exposure time was 43520s ( 12.1 hours) in and 24300s ( 6.8 hours) in . The galaxy was positioned on the WFC1 frame, with the scale being 005 per pixel.
Preliminary processing of the raw images was done at the Space Telescope Science Institute through the standard pipeline. This resulted in distortion-corrected and drizzled images, six in the band and three in the band, which we used in our subsequent reductions with IRAF222IRAF is the Image Reduction and Analysis Facility distributed by the National Optical Astronomy Observatory, which is operated by the Association of Universities for Research in Astronomy (AURA) under cooperative agreement with the National Science Foundation (NSF).. The separate and images were then combined with a coregistration better than 0.1 pixel and cosmic rays removed.
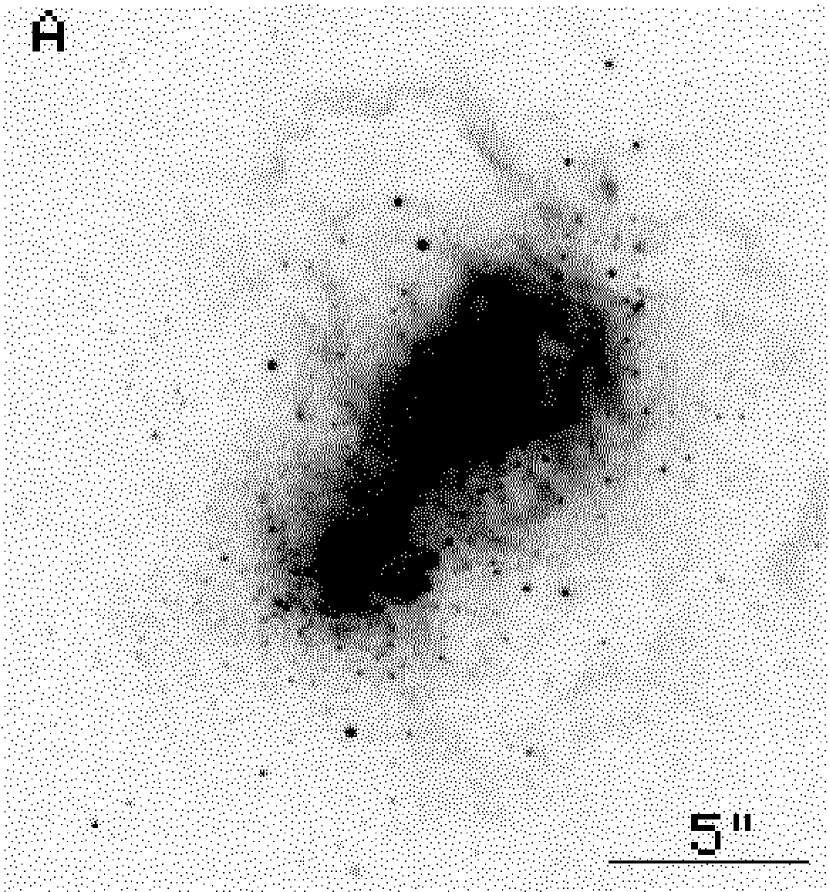
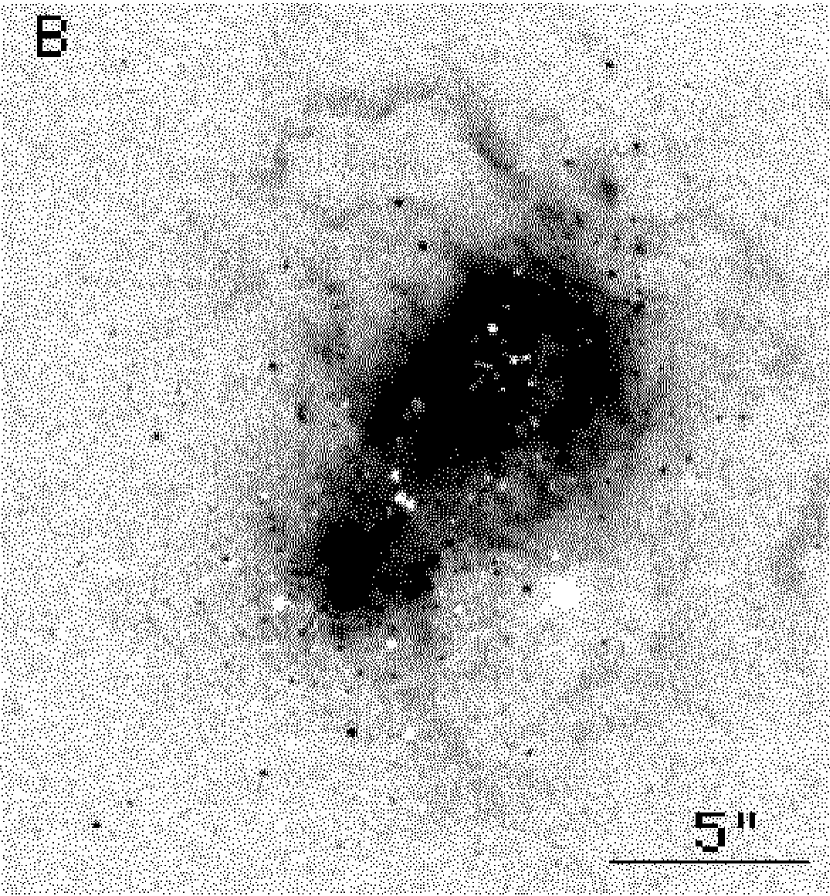
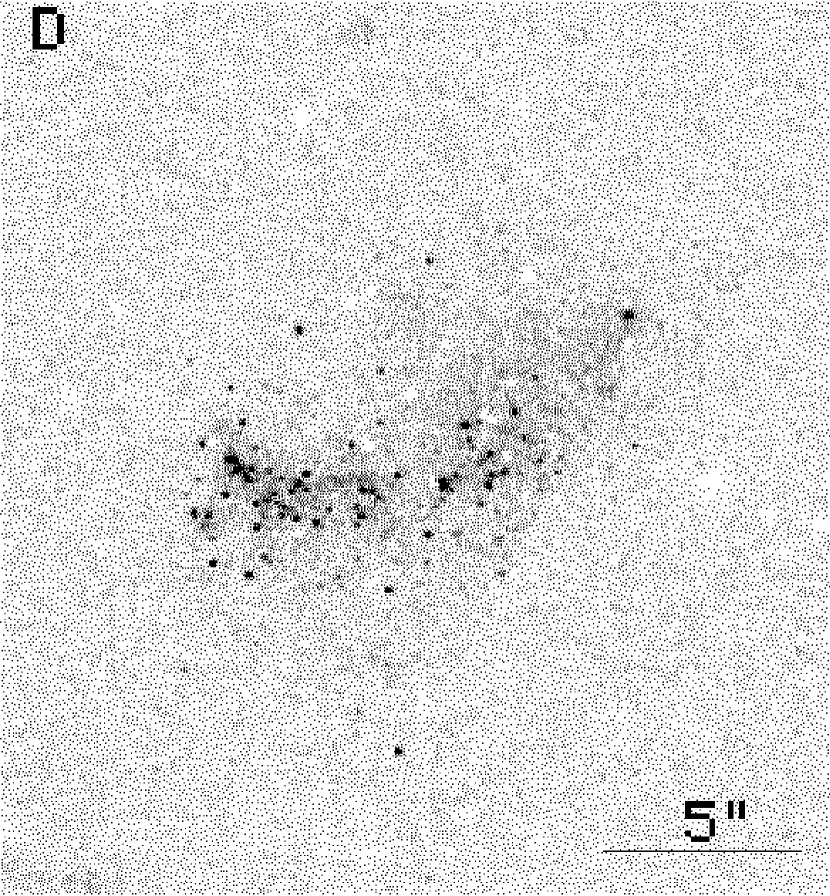
The ACS and images of I Zw 18 are shown in Figures 1a – 1b, rotated so that North is up and East is to the left. The main body and the C component are labeled in Figure 1b. Their enlarged and views are displayed respectively in Figures 2a – 2b and Figures 2c – 2d. The dark regions in the images correspond to blue colors and the white regions to red colors. The extended and filamentary dark regions in the main body (Figure 2b) represent ionized gas emission from supernova shells, while extended white sources are background red galaxies. Note the presence of several blue stars at large distances from the main body, suggesting recent or ongoing star formation in the halo. However, the extended halo of red stars, which is a common feature of many dwarf galaxies observed with the HST (e.g. in NGC 2366, Thuan & Izotov, 2004), is conspicuous by its absence in I Zw 18. No appreciable ionized gas emission is seen in the C component (Figures 2c – 2d) despite the presence of many blue stars.
The superior spatial resolution of the HST/ACS images permits to resolve individual stars and study stellar populations in I Zw 18 by means of CMDs. Thanks to the higher sensitivity of the ACS and longer exposure times, our data is considerably deeper than previous HST observations of I Zw 18 with the WFPC2. We used the DAOPHOT package in IRAF to perform point-spread-function (PSF) fitting photometry in the sky area shown in Figure 1. Thanks to the drizzling procedure, the several bright and relatively isolated stars around the main body and the C component (Figures 2a and 2c) allow us to derive reliable and well sampled stellar PSFs. We obtain full widths at half maximum (FWHM) of the stellar profiles of 2.5 pixels (0125) and 2.8 pixels (0140) respectively for the and images. As for the aperture radius to use for stellar photometry, we experimented with radii between 2 and 4 pixels to search for the best value giving at the same time a high recovery rate of point sources and small aperture corrections to the derived magnitudes. We find that the best compromise is an aperture radius of 3 pixel (015). With smaller radii the aperture corrections are too large (the calibrating aperture radius is 05) and introduce unwanted uncertainties in the photometry. With larger radii the number of recovered stars is sharply reduced, because of the crowding effect which is especially important in the main body. The background level was measured in an annulus with radii 4 and 6 pixels (02 and 03) around each source and subtracted. The zero-points of the photometry are defined as the magnitude of a star which produces a count rate of one electron per second in a given filter and are set so that the star Vega has magnitude 0 at all wavelengths. This gives zero-points of 25.711 mag and 25.487 mag for (F555W filter) and (F814W filter) respectively333See the Web page at the address http://www.stsci.edu/hst/acs/analysis/zeropoints..
Photometric aperture corrections were obtained by a comparison of PSF-fitted magnitudes of 12 bright isolated stars with the magnitudes of the same stars measured with the aperture photometry technique within a 10 pixel (05) aperture. We obtained the corrections (05) – = –0.18 mag and (05) – = –0.23 mag. Correction for charge-transfer efficiency loss has been carried out according to the prescriptions of Riess (2003). We find however, that this effect is negligible (less than 0.01 mag for sources brighter than 29 mag) given the high level of the night sky in our long-exposure images.
To check our photometry, we compare the magnitudes of several bright isolated stars in the main body, measured through a large aperture of 10 pixel radius, with those measured using the same aperture in the WFPC2 images of Hunter & Thronson (1995). We find that our magnitudes are fainter by 0.05 mag in and . To put our results on the same scale as the WFPC2 data, we have applied that small correction to our data. Since no photometric correction to infinite aperture is yet available for the ACS data, we have not considered it. In total, taking into account the aperture corrections and the slight shift between the ACS and WFPC2 magnitude scales, the corrections to our PSF photometry amount to –0.23 mag in and –0.28 mag in .
To minimize the number of false detections, we have adopted the minimum detection level to be 3 above the sky noise and a sharpness in the –1.0 – +1.0 range. Figure 3 shows the distribution of photometric errors as a function of and magnitudes as determined by DAOPHOT. It is seen that errors are about 0.2 mag at = 29 mag and = 28.5 mag. They increase to about 0.4 mag at = 30 mag and = 29.5 mag. Note that at bright magnitudes ( 27 mag), the error distribution is very broad at a given brightness because of the effects of crowding, ionized gas emission and a high background level of the unresolved stellar component in the brightest regions of the main body.
The total numbers of recovered stars are respectively 1599, 3555 and 671 in the image, the image and in both of these images at the same time. We have adopted a matching radius of 1 pixel, although changing that radius within the range 0.5 – 2 pixels does not change appreciably the number of stars in both and frames. That more than half the stars are not matched is likely caused by incompleteness effects and an increasing number of false detections at faint magnitudes. Indeed, the number of the stars with = 26 – 27 mag recovered in both and images is 74% that recovered in the image alone, while the number of the stars with = 29 – 30 mag recovered in both and images is only 5% that recovered in the image alone.
The transformation of instrumental magnitudes to the Johnson-Cousins photometric system as defined by Landolt (1992) was performed according to the prescriptions of Holtzman et al. (1995). The magnitudes and colors of point sources were corrected for Galactic interstellar extinction adopting = 0.106 mag (Schlegel et al., 1998).
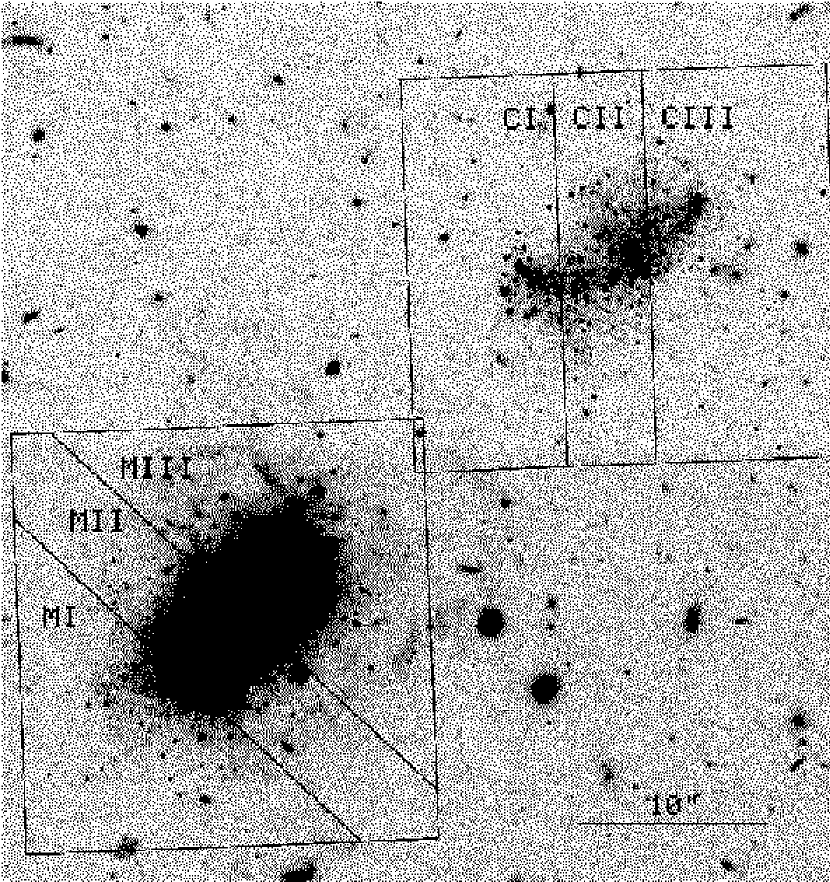
We have carried out a completeness analysis using the DAOPHOT routine ADDSTAR. Since the crowding level is more important in the main body than in the C component, the analysis was done for each component separately, in the regions determined by the rectangles in Figure 4. For each frame we have added artificial stars amounting to 5% the number of real stars detected inside each rectangle. We then performed a new photometric reduction using the same procedure as the one applied to the original frame, and checked how many added stars were recovered. This operation was repeated 10 times for each frame and each magnitude bin and the results were averaged. The completeness factor in each magnitude bin defined as the percentage of recovered artificial stars is shown in Table 1. It can be seen that the completeness is better for the C component because of its lesser crowding: it is about 69% in and 44% in in the 28 – 29 mag range, but drops to 17% and 10% in the 29 – 30 mag range. For the main body, the completeness is about 55% in and 39% in in the 28 – 29 mag range, but drops to 10% and 5% in the 29 – 30 mag range.
3 The lack of a RGB stellar population
3.1 The color-magnitude diagram of I Zw 18
Figure 5 displays the combined vs. CMD for the main body and the C component. The 50% detection limit in both and filters is shown by a dashed straight line. Our CMD is more than two magnitudes deeper than the CMDs obtained earlier for I Zw 18 (Hunter & Thronson, 1995; Dufour et al., 1996b; Aloisi et al., 1999; Östlin, 2000). A well populated MS can be seen at 0 mag, which begins with the brightest stars ( 23.5 mag) and goes all the way down to 28.5 mag. Many bright blue loop (BL) and RSG stars with 0 mag are present in the upper part of the diagram. Two clumps of AGB stars with 25 mag and 26 mag, and with redder than 1.0 mag are detected. There is, however, a conspicuous lack of a RGB stellar population, despite the fact that our data, depending on the adopted distance to I Zw 18, goes 1 – 2 mag fainter than the TRGB. Only a few faint red ( 1.3 mag) sources close to the detectability limit ( 26.6 mag) are present in the combined CMD. They may be false detections because of their faintness in ( 28.5 mag). They may also be real stars with erroneous colors because of the large photometric uncertainties (see their error bars in Figure 5) and/or with colors reddened by dust. Their possible nature will be discussed in Sect. 5.2.3.
We have indicated the expected location of the RGB in the CMD by superposing on the data points the isochrone for the very metal-deficient and old globular cluster M15. Its metallicity [Fe/H] is –2.17 (Da Costa & Armandroff, 1990), lower than the metallicity of the ionized gas in I Zw 18. We have used M15 because it has the lowest metallicity in the Da Costa & Armandroff (1990)’ globular cluster sample, and because its isochrone fits well the RGB of the very metal-deficient BCD UGC 4483 (/23) (Izotov & Thuan, 2002). Isochrones of globular clusters with higher metallicities are too red as compared to the data. The dotted, dashed and solid lines show respectively, from left to right, the location of the M15 isochrone for three distances of I Zw 18: 10 Mpc, 12.6 Mpc and 15 Mpc, corresponding to distance moduli = 30 mag, 30.5 mag and 30.88 mag. The upper extremities of each curve are the locations of the TRGB at these respective distances. It is clear that there is a dearth of sources in the expected region of RGB stars. This absence is not due to a sensitivity effect since it manifests itself at 1 – 2 mag above the 50% completeness line. Only stars detected at levels greater than 3 above the sky noise in both and are shown in Fig. 5. We have also produced a CMD for I Zw 18 where the threshould level is only 1 above the sky noise. Examination of that CMD still reveals a lack of RGB stars in I Zw 18, despite the fact that the CMD goes down now 1 mag deeper (limiting and magnitudes of above 30 mag). The CMD of I Zw 18 is thus unique among all CMDs of galaxies with resolved stellar populations studied so far with the HST. In those galaxies, the RGB stellar population is invariably present and is many times more populated than the AGB stellar population (see e.g. Figure 14 of Izotov & Thuan, 2002, where the CMDs of 11 dwarf irregular and BCD galaxies are presented).
3.2 Comparison with the resampled color-magnitude diagram of UGC 4483
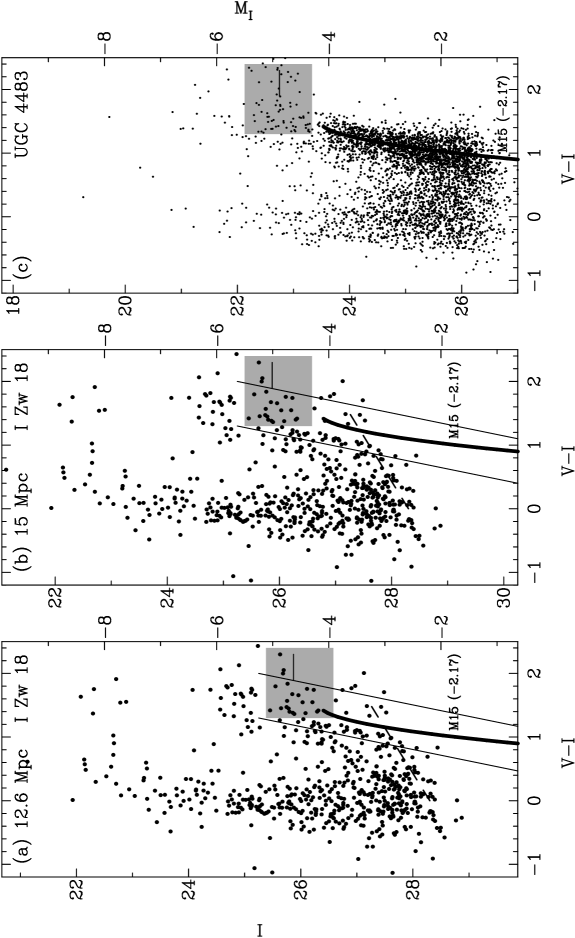
To quantify our conclusions about the absence of a RGB stellar population in I Zw 18, we compare the CMD of I Zw 18 with that of a nearby galaxy with a well-populated RGB, moved from its actual distance to the one of I Zw 18, so that the data for the comparison galaxy have a resolution and a sensitivity comparable to those of the I Zw 18 observations. The cometary blue compact dwarf galaxy UGC 4483 located at the distance of 3.40.2 Mpc is an ideal galaxy for such a comparison. With a metallicity of the ionized gas equal to 1/23 that of the Sun, it is one of the BCDs with a heavy element content closest to that of I Zw 18. It has been resolved into individual stars with HST/WFPC2 observations by Izotov & Thuan (2002). The RGB stellar population in UGC 4483 with (TRGB) 1.3 mag is one of the bluest known among BCDs. Its CMD has been analyzed by Izotov & Thuan (2002) and is given in Fig. 9c. We discuss in the following how to perform the resampling of the data for UGC 4483 when moving it to the larger distance of I Zw 18. We need to take into account the fading of stars, the increasing errors of the stellar apparent magnitudes and the increasing crowding effects.
First, we consider how the fading of a star affects the probability of its detection. Assuming that UGC 4483 is at the distance of I Zw 18 and that it is observed with the ACS with the same exposure times in and as for I Zw 18, then the detection probability of a star in the CMD of Fig. 9c with magnitudes and is
| (1) |
where () and () denote the incompleteness factors of the ACS observations (Table 1), and and are the magnitudes of a star when moved to the distance of I Zw 18. Although the incompleteness factors are different for the main body and the C component, we have used only the incompleteness factors for the latter in our modeling. This is because the contamination by ionized gas emission in UGC 4483 is more similar to that in the C component than in the main body of I Zw 18, where it is considerably higher.
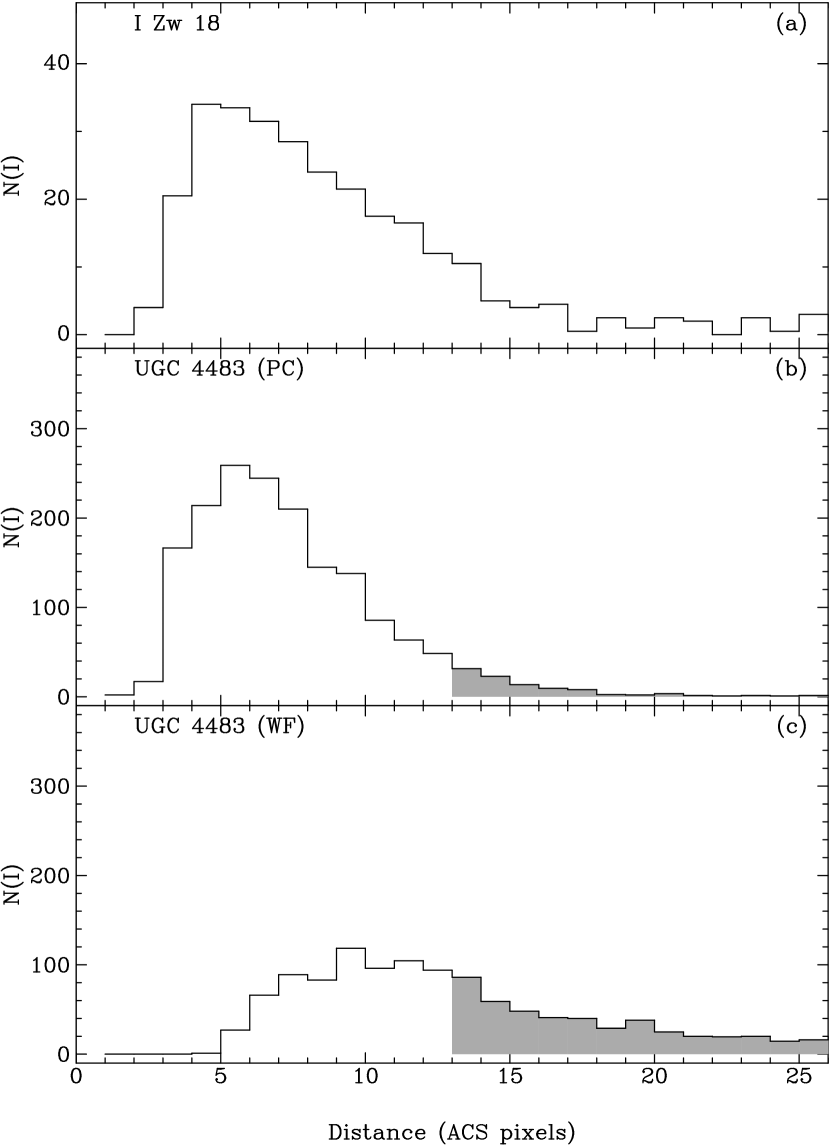
Next we consider the crowding effect: not all stars that are resolved in UGC 4483 at its distance of 3.4 Mpc will be resolved at the distance of I Zw 18. We assume that this effect is independent of apparent magnitude. In Fig. 6 we show the distribution of distances to the nearest companion of each star in I Zw 18 (a) and in UGC 4483 (b and c for the parts of the galaxy imaged respectively by the PC and by the WF2+WF3+WF4 frames, hereafter WF frames). All distances are expressed in ACS pixels. It is seen from Fig. 6a and 6b that both stars in a pair are resolved by the ACS and the PC only if their separation is more than 3 ACS pixels. The lower separation limits of the ACS and the PC are similar because their resolutions are nearly the same. On the other hand, in the WFPC2/WF frames, because of their twice as worse angular resolution, both stars in a pair are recovered only if their separation is more than 6 ACS pixels. Because the linear resolution at a distance of 15 Mpc as compared to one of 3.4 Mpc is 15/3.4 = 4.4 times worse, of the detected stars in UGC 4483, only the ones in pairs with separations 34.4 13 ACS will be resolved at the distance of 15 Mpc. The parts of the distributions occupied by the resolved pairs of stars are shown by shaded regions in Fig. 6b and 6c. They correspond to a fraction of stars of 0.06 for the PC frame and of 0.51 for the WF frames. The remaining pairs with smaller separations are not resolved. We assume that for those, only one of the two stars in a pair is recovered. This corresponds to a fraction of stars in unresolved pairs of 0.94/2 = 0.47 for the PC frame and of 0.49/2 = 0.25 for the WF frames.
However, these fractions can be even smaller if there are stars close to the unresolved pairs. To estimate this effect, we consider the distribution of separations between the unresolved pairs of stars and the next nearest star. We find that only 60% of unresolved pairs have a nearest star with a separation 13 ACS pixels. We calculate the fraction of the stars which is recovered at the distance of 15 Mpc to be: 0.06 + 0.94/20.6 0.34 for the PC frame, and 0.51 + 0.49/20.6 0.66 for the WF frames. In similar manner, we derive = 0.39 (PC) and 0.76 (WF) for the distance of 12.6 Mpc and 0.49 (PC) and 0.87 (WF) for the distance of 10 Mpc. Finally, the total probability to recover a detected star in UGC 4483 at the distance of I Zw 18 is = .
We show in Fig. 7 representative simulated CMDs of UGC 4483 for three possible distances of I Zw 18, 10 Mpc, 12.6 Mpc and 15 Mpc. They are generated from the observed CMD shown in Fig. 9c according to the detection probability for each star. In addition, we have also recalculated the magnitude of each star by taking into account the errors in the magnitude measurements. For a given stellar magnitude, we have adopted a 1 deviation from a fit to the data in Fig. 3 and distributed the errors in a gaussian fashion. The apparent magnitude scale for each panel (left ordinate) has been adjusted so that the absolute magnitude scale (right ordinate) is the same in all panels. In all three panels, we also show the isochrone for the globular cluster M15 by a thick line. The two parallel lines in panels (b) and (c) delineate the location of RGB stars. We conclude from Fig. 7 that the RGB of UGC 4483 is clearly visible at all three distances. Even if the RGB is sparser at the distance of 15 Mpc, it is still clearly there. In all likelihood, the absence of a RGB in I Zw 18 is not the result of a selection effect.
We can quantify the above statement by comparing the observed distribution of the numbers of stars between the two parallel lines (Fig. 7b,c and Fig. 9a,b) as a function of magnitude for I Zw 18 and for UGC 4483 at distances of 12.6 and 15 Mpc. The distributions are shown in Fig. 8. We mark by short vertical lines the locations of the TRGB at the corresponding distances. It seen that in both galaxies the numbers of AGB stars brighter than the TRGB are comparable. However, the numbers of stars fainter than the TRGB are much larger in the recalculated CMDs of UGC 4483 than in the CMD of I Zw 18. A Kolmogorov- Smirnov test shows that, in the 26 – 28.5 mag magnitude range, the observed distribution of stars in I Zw 18 is different at the 99% and 96% levels from those in UGC 4483, for distances of 12.6 Mpc and 15 Mpc respectively. For a distance of 10 Mpc, the difference in the distributions of stars is at the 99.9% level.
We have chosen a broad region between the two parallel lines for the construction of the histograms shown in Fig. 8. The differences between the histograms of UGC 4483 and that of I Zw 18 would be considerably larger if we make that region narrower, and in particular if we exclude from consideration the stars in I Zw 18 that are concentrated at the blue edge of the region 0.2 – 0.3 mag blueward of the M15 isochrone. There are reasons to think that these blue stars may not be RGB stars. Since the metallicity of the stars in I Zw 18 is unlikely to be much lower than the metallicity [Fe/H] = –2.17 of M15, their blue colors are likely due to an age effect. Hence these stars are likely considerably younger than the 10 Gyr old RGB stars in M15. Furthermore, the distributions of stars in this region are very different in I Zw 18 and in UGC 4483. The RGB stars in the CMDs of UGC 4483 are distributed more uniformly and not in a narrow blue edge as seen in I Zw 18.
4 The distance of I Zw 18
There has been some debate about the exact distance of I Zw 18. Values that have been proposed range from 10 Mpc (Hunter & Thronson, 1995; Dufour et al., 1996b; Aloisi et al., 1999) assuming the observed heliocentric radial velocity of the galaxy of 750 km s-1 is a pure Hubble flow velocity and a Hubble constant of 75 km s-1 Mpc-1, to 12.6 Mpc (Östlin, 2000) based on a Virgocentric flow model, to 15 Mpc (Izotov et al., 2001; Izotov & Thuan, 2002) based on photometric and spectroscopic properties of I Zw 18.
With the absence of a RGB stellar population, we cannot use the TRGB as a distance indicator. Other arguments need to be invoked. The redshift distance of I Zw 18 without correction for Virgocentric infall is 10 Mpc. If this distance is correct, then the magnitude of the TRGB would be 26 mag, corresponding to the upper extremity of the dotted line in Figure 5, i.e. it would appear brighter than some AGB stars. This seems unlikely as AGB stars are usually brighter than the TRGB. For example, the AGB stars in the BCD VII Zw 403 which contains numerous RGB stars are 0.5 mag brighter than the TRGB (Lynds et al., 1998; Schulte-Ladbeck et al., 1998). In another BCD, UGC 4483, the AGB stars are brighter than the TRGB by 0.7 mag (Izotov & Thuan, 2002). Thus, we conclude that a distance of 10 Mpc to I Zw 18 is too small.
There is other evidence that goes in the same sense. Östlin (2000), by correcting the radial velocity of I Zw 18 for Virgocentric infall, obtained = 12.6 Mpc. Izotov et al. (2001) and Izotov & Thuan (2002) suggested that I Zw 18 should be as distant as 15 Mpc. Thus, Izotov et al. (2001) found that the ionized gas emission seen in the southeastern and central parts of the C component can only be produced by stars with ages less than 15 Myr or with masses 10 – 15 . At a distance of 10 Mpc, the absolute luminosities of the brightest stars in the CMD of the C component would not be large enough for such massive stars (e.g. Aloisi et al., 1999). Furthermore, Izotov & Thuan (2002) have compared the CMDs of 11 galaxies (five BCD and irregular galaxies outside the Local Group and six Local Group irregular galaxies) observed with the HST and found that the absolute magnitudes of the brightest stars in the main body of I Zw 18 would be systematically fainter than those in these galaxies if I Zw 18 is at 10 Mpc, which is not plausible. Increasing the distance of I Zw 18 to 12.6 Mpc still does not match the observations. The youngest bright stars in the CMD of the C component would still have too low absolute luminosities and too large ages ( 25 – 30 Myr) to account for the ionized gas in the C component.
We estimate the distance to I Zw 18 by comparing the absolute magnitudes of the AGB stars in I Zw 18 with those in other BCDs. In Figure 9 we compare the CMDs of I Zw 18 (Figures 9a and 9b) and the BCD UGC 4483 (Figure 9c). We consider two distances for I Zw 18, 12.6 Mpc (Figure 9a) as proposed by Östlin (2000) and 15 Mpc as proposed by Izotov et al. (2001) and Izotov & Thuan (2002) (Figure 9b). As in Fig. 7, the scales of apparent magnitudes (left ordinate in each panel) are adjusted so that the absolute magnitude scale (right ordinate in each panel) is the same in all panels. The thick solid line is the isochrone of the globular cluster M15, the dashed line in Figures 9a – 9b shows the 50% completeness limit. Two clumps of AGB stars with 25 mag and 26 mag are seen in the CMD of I Zw 18. For each CMD, we have derived the mean magnitudes of the AGB stars in the shaded regions. In the case of I Zw 18, this corresponds to the fainter clump. The short horizontal lines in Fig. 9 indicate the mean absolute magnitude of AGB stars thus obtained.
The absence of RGB stars implies that the AGB stars of the fainter clump in I Zw 18 should be at least as bright in absolute magnitude as those in UGC 4483, since they are descendants of more massive stars. However, at the distance of 12.6 Mpc (Figure 9a) the AGB stars in I Zw 18 are fainter by 0.25 mag than those in UGC 4483 (Figure 9c). Their absolute magnitudes are similar to those of older AGB stars in the BCD VII Zw 403 (Lynds et al., 1998; Schulte-Ladbeck et al., 1998). If we increase the distance of I Zw 18 to 15 Mpc, then the AGB stars in I Zw 18 are 0.13 mag brighter, a much more satisfactory state of affair (Figures 9b and 9c). In fact, the AGB stars in I Zw 18 and in UGC 4483 have the same absolute magnitudes if the distance to I Zw 18 is 14.1 Mpc, corresponding to a distance modulus of 30.75 mag. Poor statistics of the AGB stars in the CMD of I Zw 18 and uncertainties in their real absolute magnitudes preclude a more precise determination of the distance to the BCD. All we can say is that it is somewhere between 12.6 Mpc and 15 Mpc, with the most likely value being in the upper range.
5 Stellar populations
5.1 Color-magnitude diagrams
Our ACS data are considerably deeper than all previous imaging of I Zw 18, obtained with the WFPC2 or NICMOS. For comparison, the faintest red stars with 25 mag and 1 mag in the CMD of Aloisi et al. (1999) (their Figure 7b) correspond to the brightest AGB stars in our CMD (Figure 5). Likewise, the faintest red stars with –7.5 mag (at the distance of 12.6 Mpc) detected by Östlin (2000) correspond to the same brightest AGB stars in our data. These AGB stars are 2.5 mag brighter than the TRGB absolute magnitude of –5 mag in the band (Ferraro et al., 2000; Valenti et al., 2004). Furthermore, the ACS observations of the C component have two times better spatial resolution as compared to the previous WFPC2 observations (005 instead 01). Thus, there is no doubt that our deep images allow to study much fainter stellar populations and put more stringent constraints on the evolutionary state of I Zw 18.
We have already discussed in section 3 the absence of a RGB stellar population in I Zw 18. We now examine the stellar populations that are present. The CMDs for the main body and C component are shown in Figures 10a and 10b, respectively. The distance of 15 Mpc to I Zw 18 is adopted hereafter. Overplotted on the data are Geneva theoretical isochrones (solid lines) of single stellar populations for a heavy element mass fraction = 0.0004 (Lejeune & Schaerer, 2001), which corresponds to the metallicity of the ionized gas in I Zw 18. Each isochrone is labeled by the logarithm of the age in years. We choose to use Geneva instead of Padova isochrones (Girardi et al., 2000) because the latter are not able to reproduce the isochrone of the globular cluster M2 with a similar metallicity, [Fe/H] = –1.58 (Izotov & Thuan, 2002), while the agreement is better with Geneva isochrones.
5.1.1 The main body
Several star formation episodes in the main body can be inferred from the CMD in Figure 10a and from other observational data. The ongoing star formation with age 4 Myr is evidenced by the ionized gas emission (Figures 2a – 2b) and the presence of WR stars in the NW component (Izotov et al., 1997; Legrand et al., 1997), located in two compact clusters (Brown et al., 2002). The brightest post-MS star in the CMD with an absolute magnitude –9.7 mag and an age of 5 – 6 Myr is also part of the present burst. Numerous supergiants with –8 mag indicate that intense star formation occured 10 – 15 Myr ago. There is evidence for two older star formation events in the CMD. A first star formation episode occurred 200 Myr ago as indicated by the bright AGB stars with –6 mag. A second star formation happened 300 – 500 Myr ago, which is responsible for the oldest stars in the main body, the AGB stars with –5 mag. These age estimates are in agreement with the previous CMD analyses by Hunter & Thronson (1995), Dufour et al. (1996b) and Aloisi et al. (1999), although those authors discussed only one previous star formation episode, because their data did not go as deep as ours and the 300 – 500 Myr old AGB stars were not seen. Most importantly, no old AGB stars with ages 1 Gyr are seen, contrary to the assertion of Östlin (2000) on the basis of his HST/NICMOS CMD. The presence of such old AGB stars would have required numerous RGB stars which are not present in our CMD.
5.1.2 The C component
We turn next to the stellar populations in the C component. Here, there is no substantial ongoing massive star formation as intense ionized gas emission is not seen. This is corroborated by the upper part of the CMD, which is nearly devoid of bright stars (Figure 10b). The lone bright source and the brightest one in the CMD, at 22 mag (shown by a large filled circle in Figure 10b and labeled “C” in Figure 2c and Figure 10b), is in fact not a single star but represents the central cluster discussed by Dufour et al. (1996b). It is partially resolved in our images with a FWHM 015, corresponding to a linear size of 10 pc. There is a second resolved cluster (also shown in Figure 10b by a large filled circle and labeled “NW” in Figure 2c and Figure 10b) with a FWHM 021, corresponding to a linear size of 15 pc. It was also noted by Dufour et al. (1996b).
Two star formation episodes can be deduced from the CMD. The most recent one happened 15 – 20 Myr ago while the older one took place 200 – 300 Myr ago. There is an indication that the C component is slightly younger than the main body because its oldest AGB stars are slightly brighter on average (by 0.2 mag). Our age estimates for the C component are also in agreement with those of Dufour et al. (1996b) and Aloisi et al. (1999) based on the HST/WFPC2 data.
5.1.3 Individual regions
In Figure 11 we show CMDs for the different regions in the main body and in the C component as delimited in Figure 4. Ongoing and recent past star formation in the main body is mainly localized in the MII region associated with the SE component, and in the MIII region associated with the NW component. This is evidenced by the presence of numerous bright MS (age 10 Myr) and BL+RSG (10 Myr age 100 Myr) stars in both CMDs (Figures 11b – 11c). Some AGB stars are also present in region MII. On the other hand, only a few RSG stars are seen in the CMD of the southernmost region MI. The population of AGB stars is more numerous there, indicating older star formation (age 100 Myr) (Figure 11a).
In the CMD of the southernmost region CI of the C component (Figure 11d) only stellar populations with ages 100 Myr are present. The age of the youngest stars in this region is 15 – 20 Myr as evidenced by the brightest post-MS stars ( –8 mag) in the CMD and the presence of weak H and H emission lines in its spectrum (e.g., Izotov et al., 2001). In the central region CII (Figure 11e), older stars with ages 200 – 300 Myr are present. There is a population of younger stars, with ages 30 Myr as deduced from the –6.4 mag of the brightest post-MS stars. Although they are not resolved, the youngest stars (age 15 Myr) are likely present in the central cluster, as evidenced by the presence of ionized gas emission there (Dufour et al., 1996b; Izotov et al., 2001). Region CIII is the oldest (age 300 Myr) region in the C component (Figure 11f). There is no recent star formation here since no bright MS star is seen. The AGB stars are fainter than those in region CII, also suggesting a larger age. Probably, the youngest object in region CIII is the NW stellar cluster. However, the absence of ionized gas emission around this cluster (Dufour et al., 1996b) and its relatively red 0.35 mag (Figure 11f) implies that its age is 100 Myr.
5.1.4 The age of I Zw 18
All previous CMD studies of I Zw 18 did not go deep enough to allow setting an upper limit to its age. Our new deep ACS images permit us to do so. For a distance of I Zw 18 in the range between 12.6 Mpc and 15 Mpc, no RGB stars are seen in our CMDs, and the age upper limit can be set to 1 – 2 Gyr. However, the real age for I Zw 18 is likely smaller as only stars with ages 500 Myr are present (Figures 10 and 11). This age upper limit of 500 Myr is in excellent agreement with the age estimates obtained by Papaderos et al. (2002) and Hunt et al. (2003) by examining the integrated optical and near-infrared colors of I Zw 18.
While we favor a distance of I Zw 18 in the upper range of the 12.6 Mpc – 15 Mpc interval, our conclusions will be reenforced if the smaller distance of 12.6 Mpc is adopted for the BCD. In this case, it would be easier to detect faint RGB stars since the TRGB’s apparent magnitude would be up to 0.38 mag brighter (compare Figures 9a and 9b with the simulated CMDs for UGC 4483 in Figures 7b and 7c). The ages of the oldest stellar populations will increase at most by a few hundred Myr. However, we have argued in section 4 that such a small distance would not be in agreement with photometric and spectroscopic observations of I Zw 18.
5.2 Spatial distributions
The spatial distributions of stars with different ages in I Zw 18 can give useful information on its star formation history. To carry out the study, we divide the stars in the CMD in Figure 5 into three categories: 1) MS stars with –0.05 mag, 2) BL stars with –0.05 mag 0.4 mag and RSG stars with 24 mag and 0.4 mag, and 3) AGB stars with 26.4 mag 24 mag and 0.8 mag. We have also included in the last category the progenitors of the AGB stars located in the lower right corner of the CMD with 26.4 mag 27.5 mag and 0.6 mag 1.2 mag. The boundaries of the regions in the CMD of I Zw 18 where these stars are located are shown in Figure 5.
The spatial distributions of different types of stars are displayed by in Figures 12a – 12d. The open circles indicate the locations of the NW and SE components in the main body and the central star cluster in the C component. The spatial distribution of all stars irrespective of type is shown in Figure 12a. It is seen that the vast majority of the stars are located in the main body and in the C component. The few scattered points outside I Zw 18 are probably false detections.
5.2.1 The main body
In the main body, the MS and BL+RSG stars (Figures 12b – 12c) are distributed uniformly, suggesting that ongoing and recent past star formation took place over the whole body. On the other hand, the AGB stars are mainly located in the southeastern part (Figure 12d). This was noted earlier by Aloisi et al. (1999) and Izotov & Thuan (2002) based on WFPC2 images. The absence of AGB stars in the northwestern region may be caused in part by a more severe crowding and a larger contribution of ionized gas emission in the image (Figures 2a – 2b). This may make DAOPHOT miss more of the AGB stars since they are fainter in than the MS and BL+RSG stars. However, we believe that some of the effect is real. The most striking feature is that the older AGB stars are not more spread out spatially than the younger stars, a fact already noted by Izotov & Thuan (2002). Such a distribution is drastically different from the situation in other galaxies where the old AGB and RGB stars are distributed over a considerably larger area as compared to younger stars, due to diffusion and relaxation processes of stellar ensembles. If anything, the reverse appears to be true here: the MS and BL+RSG stars are distributed over a larger area around the main body as compared to the AGB stars. This suggests that star formation in the past responsible for the AGB stars was more concentrated in the main body, while recent star formation responsible for the MS and BL+RSG stars is more spread out. Evidently, I Zw 18 is a galaxy in the process of forming from the inside out.
The absence of a halo of AGB stars and of their progenitors around I Zw 18, despite an easier detectability at large distances because of less crowding, is in direct contradiction with the scenario of Legrand (2000) and Legrand et al. (2000). These authors have proposed that continuous low-mass star formation has proceeded in I Zw 18 on cosmological time scales in a large area around the main body. They predict the existence of a red extended underlying stellar component which Kunth & Östlin (2000) claim to have detected from their optical and near-infrared surface photometry, but which was not confirmed by independent photometry by Papaderos et al. (2002) and Hunt et al. (2003). In fact, the spatial distributions in Figure 12 suggest that the AGB stars in the main body are relatively young and have had no time to migrate to large distances (cf. Izotov & Thuan, 2002).
5.2.2 The C component
In the C component, the spatial distributions of the different types of stars are very different from those in the main body. The MS stars are seen primarily in the southeastern part and are nearly absent in the northwestern part (Figure 12b). The BL+RSG stars are also mainly distributed in the southeastern part, however their location is offset as compared to the MS stars: the MS stars are mostly aligned in the East - West direction while the BL+RSG stars are mainly distributed in the southeast - northwest direction. On the other hand, AGB stars are located principally in the northwestern part. Some of these stars are also present to the south of the central cluster. It appears that the two major episodes of star formation in the C component have occurred in spatially different regions. This is characteristic of the mode of star formation in BCDs where the centers of star formation move about in a stochastic manner. This also implies that, as for the main body, the formation of the C component is still proceeding. It started in the northwestern part 200 – 300 Myr ago, lasting for a relatively short period, and continues now in the southeastern part. That MS stars are not seen in the northwestern part does not mean that such stars are not present there. They are simply too faint to be detected because the MS turn-off for a 200 – 300 Myr old stellar population is –1 mag (e.g. Girardi et al., 2000) or 30 mag, below the detectability limit. The absence of MS stars also means that no detectable star formation has occurred during the last 200 Myr in the northwestern part. One possible exception is the NW cluster with the age 100 Myr. On the other hand, the absence of AGB stars in the southeastern region, where MS stars reside, suggests that this region is younger, with an age 100 Myr. A similar age estimate was made by Izotov et al. (2001) from a spectroscopic study.
5.2.3 Faint red stars
Finally, we consider the spatial distribution and nature of the few faintest ( 26.6 mag) and reddest ( 1.3 mag) sources in the CMD of Figure 5. They are shown by crosses in Figure 12d. A few of these sources are scattered in the field and are likely false detections. Two other are in the C component, while the remaining six are in the southeastern part of the main body. Their colors are redder than those of globular cluster stars in M15. The location of some of these sources in the CMD of the main body to the right of the 10 Gyr Geneva theoretical isochrone with = 0.0004 (Figure 10a) implies that they are older than the Universe, which is absurd. The situation is worse when Padova isochrones are used. Thus, we conclude that the red colors of the faint sources are not due to their large ages, but to some other reason. Their very red colors may be explained in part by large photometric uncertainties, which at these faint magnitudes, can reach 0.5 mag (see the error bars in Figure 5). Furthermore, these sources may be reddened by dust known to be present in the main body, with a maximum extinction 0.5 mag in the southeastern part (Cannon et al., 2002). However, this value is derived over large areas, and the extinction can be clumpy and significantly higher on small scales. It is seen from Figure 5 that correction for interstellar reddening with 1 mag will move all red faint sources in the CMD region where stars with ages 500 Myr reside. In any case, the faintness of these sources and the unknown distribution of extinction on small scales in the main body and in the C component precludes a more reliable explanation of their nature.
5.3 Surface-brightness and color distributions
Another way to study the properties of stellar populations is to consider their integrated characteristics as given by the surface brightness and color profiles in different regions of the galaxy. The advantage of this approach is that it includes both resolved and unresolved stars. The disadvantage is that populations with different ages contribute to the integrated light and assumptions have to be made on the star formation history to derive the age distribution of stars.
In Figure 13, we show the (a) and (b) surface-brightness and (c) color distributions averaged over a 7″ wide strip along the position angle –47° connecting the main body and the C component. The origin is taken to be at the center of the NW component of the main body. Surface brightnesses and colors have been transformed to the standard photometric system according to the prescriptions of Holtzman et al. (1995) and have been corrected for Galactic extinction with = 0.106 mag (Schlegel et al., 1998). The NW and SE components of the main body and the central cluster in the C component are labeled in each panel. The bluest color –0.5 mag is in a region 3″ northwest of the NW component. The equivalent width of the H emission line in this region exceeds 1000Å (Izotov et al., 2001) and hence the blue color is due to ionized gas emission. Other regions in the main body with as blue as –0.3 - –0.4 mag are also strongly contaminated by ionized gas emission. The only region in the main body free of ionized gas emission is the southernmost one (region MI) which, with 0.3 – 0.4 mag, is the reddest part in I Zw 18. In the C component, the contribution of ionized gas emission is negligible (Izotov et al., 2001) and the bluest color 0 mag in the southeastern part (region CI) really reflects that of a young stellar population. The reddest color 0.2 – 0.3 mag is in the northwestern part of the C component. It is slightly bluer than the color of the reddest region in the main body, suggesting that the C component may be slightly younger than the main body. The surface brightness profiles also show the absence of an extended LSB component, with a precipitous drop of 6 mag from the NW component to the edge of the galaxy over a distance 10″ or 750 pc.
To model the colors of the reddest regions in I Zw 18, we use spectral energy distributions of single stellar populations with a heavy element mass fraction = 0.0004, calculated with the PEGASE.2 code of Fioc & Rocca-Volmerange (1997). Because Geneva stellar evolutionary models (Lejeune & Schaerer, 2001) do not include AGB stars, the Padova models (Girardi et al., 2000)444http://pleiadi.pd.astro.it. are used. The Salpeter initial mass function (IMF) with a slope = –2.35, and lower and upper stellar mass limits of 0.1 and 120 respectively are adopted. The models predict that the color of an instantaneous burst with age between 200 and 500 Myr is 0.5 mag, or 0.1 – 0.2 mag redder than the observed reddest color. Only for an instantaneous burst with age 150 Myr, several 100 Myr smaller than the CMD-derived ages, are the modeled colors consistent with the observed ones. We have also considered the case of continuous star formation. If star formation has occurred at a constant rate continuously during the period 50 – 160 Myr ago, then the color is 0.35 mag, in agreement with the observed value. But the upper age limit is again significantly lower than the CMD-derived ages. We can increase the upper age limit for continuous star formation to make it consistent with the CMD-derived value of 500 Myr, but to reproduce 0.35 mag, we must at the same time decrease the lower age limit to 10 Myr. In this case young massive stars should be present in the reddest regions of I Zw 18, and they are not seen.
A possible cause for the color discrepancy may be that the metallicity of stars in I Zw 18 is not equal to the metallicity of the ionized gas as assumed, but lower. We have checked into this possibility with models that are four times as metal-poor ( = 0.0001). does become bluer, but the blueing is not sufficient. For instantaneous bursts with ages in the range 200 – 500 Myr, 0.46 mag, still too red as compared to the observed value. We have also varied the parameters of the IMF for a single stellar population with a heavy element mass fraction = 0.0004. Making the slope flatter or steeper with in the range –2 - –3 and increasing the lower mass limit from 0.1 to 1 does not result in a significantly bluer color. The colors are in the range 0.45 – 0.50 mag for instantaneous bursts with ages in the range 200 – 500 Myr. We conclude from the previous considerations that, despite the uncertainties of the models and the fact that they cannot reproduce precisely the observed reddest colors in I Zw 18, they do predict young ages which are in the ballpark of CMD-derived ages.
6 Summary
We present a photometric study of the resolved stellar populations in I Zw 18, the most metal-deficient blue compact dwarf (BCD) galaxy known. The analysis of the color-magnitude diagram (CMD) of I Zw 18, based on Hubble Space Telescope/Advanced Camera for Surveys and images, the deepest ever obtained for the BCD, have led us to the following conclusions:
1. The CMD of I Zw 18 is populated by stars with different ages including the youngest hydrogen core burning main-sequence (MS) stars (age 30 Myr), evolved massive stars with helium core burning [blue loop (BL) stars and red supergiants (RSG)] with ages between 10 Myr and 100 Myr, and asymptotic giant branch (AGB) helium shell burning stars with ages between 100 Myr and 500 Myr. However, I Zw 18 is the first galaxy with resolved stellar populations where no red giant branch (RGB) stars are seen, although our data go 1 – 2 mag deeper than the tip of the RGB for a distance of I Zw 18 in the range 12.6 Mpc – 15 Mpc (see conclusion 2). The oldest stars located mainly in the southeastern part of the main body and the northwestern part of the C component have an age not exceeding 500 Myr. Thus I Zw 18 is a bona fide young galaxy.
2. Since no RGB stars are seen, we cannot use the brightness of the tip of the RGB to derive the distance to I Zw 18. Instead, we compare the brightness of the AGB stars in I Zw 18 with those in the very metal-deficient BCD UGC 4483 with a heavy element abundance of /23 to derive a distance in the range 12.6 Mpc – 15 Mpc, with the most likely value in the upper range.
3. Several star formation episodes in I Zw 18 can be inferred from its CMD. However star formation proceeds differently in the main body and in the C component. In the main body, three star formation episodes are indicated, separated by periods of 100 – 200 Myr. Examination of the spatial distribution of the stellar populations suggests that the star formation process is still gradually building up the main body from the inside out as the young MS and BL+RSG stars occupy larger areas as compared to the older AGB stars. In the C component, two star formation episodes are inferred separated by a period of 200 Myr. These separate star formation episodes occurred in spatially different regions, reflecting the stochastic mode of star formation in BCDs. The southeastern region of the C component is a few hundred Myr younger than the northwestern region. Both in the main body and in the C component, the spatial distributions of the stellar populations in I Zw 18 strongly suggest that the galaxy is still in the process of forming.
References
- Aloisi et al. (1999) Aloisi, A., Tosi, M., & Greggio, L. 1999, AJ, 118, 302
- Brown et al. (2002) Brown, T. M., Heap, S. R., Hubeny, I., Lanz, T., & Lindler, D. 2002, ApJ, 579, L75
- Cannon et al. (2002) Cannon, J. M., Skillman, E. D., Garnett, D. R., & Dufour, R. J. 2002, ApJ, 565, 931
- Da Costa & Armandroff (1990) Da Costa, G. S., & Armandroff, T. E. 1990, AJ, 100, 162
- Davidson et al. (1989) Davidson, K., Kinman, T. D., & Friedman, S. D. 1989, AJ, 97, 1591
- Dufour & Hester (1990) Dufour, R. J., & Hester, J. J. 1990, ApJ, 350, 149
- Dufour et al. (1996a) Dufour, R. J., Esteban, C., & Castañeda, H. O. 1996a, ApJ, 471, L87
- Dufour et al. (1996b) Dufour, R. J., Garnett, D. R., Skillman, E. D., & Shields, G. A. 1996b, in ASP Conference Series 98, From Stars to Galaxies, ed. C. Leitherer, U. Fritze-v.Alvensleben, & J. Huchra (San Francisco: ASP), 358
- Ferraro et al. (2000) Ferraro, F. R., Montegriffo, P., Origlia, L., & Fusi Pecci, F. 2000, AJ, 119, 1282
- Fioc & Rocca-Volmerange (1997) Fioc, M., & Rocca-Volmerange, B. 1997, A&A, 326, 950
- French (1980) French, H. B. 1980, ApJ, 240, 41
- Girardi et al. (2000) Girardi, L., Bressan, A., Bertelli, G., & Chiosi, C. 2000, A&AS, 141, 371
- Holtzman et al. (1995) Holtzman, J. A., Burrows, C. J., Casertano, S., Hester, J. J., Trauger, J. T., Watson, A. M., & Worthey, G. 1995, PASP, 107, 1065
- Hunt et al. (2003) Hunt, L. K., Thuan, T. X., & Izotov, Y. I. 2003, ApJ, 588, 281
- Hunter & Thronson (1995) Hunter, D. A., & Thronson, H. A., Jr. 1995, ApJ, 452, 238
- Izotov & Thuan (1998) Izotov, Y. I., & Thuan, T. X. 1998, ApJ, 497, 227
- Izotov & Thuan (2002) Izotov, Y. I., & Thuan, T. X. 2002, ApJ, 567, 875
- Izotov et al. (1997) Izotov, Y. I., Foltz, C. B., Green, R. F., Guseva, N. G., & Thuan, T. X. 1997, ApJ, 487, L37
- Izotov et al. (1999) Izotov, Y. I., Chaffee, F. H., Foltz, C. B., Green, R. F., Guseva, N. G., & Thuan, T. X. 1999, ApJ, 527, 757
- Izotov et al. (2001) Izotov, Y. I., Chaffee, F. H., Foltz, C. B., Thuan, T. X., Green, R. F., Papaderos, P., Fricke, K. J., & Guseva, N. G. 2001, ApJ, 560, 222
- Kinman & Davidson (1981) Kinman, T. D., & Davidson, K. 1981, ApJ, 243, 147
- Kunth & Östlin (2000) Kunth, D., & Östlin, G. 2000, A&A Rev., 10, 1
- Landolt (1992) Landolt, A. U. 1992, AJ, 104, 336
- Legrand (2000) Legrand, F. 2000, A&A, 354, 504
- Legrand et al. (1997) Legrand, F., Kunth, D., Roy, J.-R., Mas-Hesse, J. M., & Walsh, J. R. 1997, A&A, 326, L17
- Legrand et al. (2000) Legrand, F., Kunth, D., Roy, J. R., Mas-Hesse, J. M., & Walsh, J. R., 2000, A&A, 355, 891
- Lejeune & Schaerer (2001) Lejeune, T., & Schaerer, D. 2001, A&A, 366, 538
- Lequeux et al. (1979) Lequeux, J., Peimbert, M., Rayo, J. F., Serrano, A., & Torres-Peimbert, S. 1979, A&A, 80, 155
- Lynds et al. (1998) Lynds, R., Tolstoy, E., O’Neil, E. J., Jr., & Hunter, D. A. 1998, AJ, 116, 146
- Östlin (2000) Östlin, G. 2000, ApJ, 535, L99
- Pagel et al. (1992) Pagel, B. E. J., Simonson, E. A., Terlevich, R. J., & Edmunds, M. G. 1992, MNRAS, 255, 325
- Papaderos et al. (2002) Papaderos, P., Izotov, Y. I., Thuan, T. X., Noeske, K. G., Fricke, K. J., Guseva, N. G., & Green, R. F. 2002, A&A, 393, 461
- Riess (2003) Riess, A. 2003, Instrument Science Report ACS 2003-009, 30p.
- Sargent & Searle (1970) Sargent, W. L. W., & Searle, L. 1970, ApJ, 162, 155
- Schlegel et al. (1998) Schlegel, D. J., Finkbeiner, D. P., & Davis, M. 1998, ApJ, 500, 525
- Schulte-Ladbeck et al. (1998) Schulte-Ladbeck, R. E., Crone, M. M., & Hopp, U. 1998, ApJ, 493, L23
- Searle & Sargent (1972) Searle, L., & Sargent, W. L. W. 1972, ApJ, 173, 25
- Skillman & Kennicutt (1993) Skillman, E. D., & Kennicutt, R. C., Jr. 1993, ApJ, 411, 655
- Steidel et al. (1996) Steidel, C. C., Giavalisco, M., Pettini, M., Dickinson, M., & Adelberger, K. L. 1996, ApJ, 462, 17
- Thuan & Izotov (2004) Thuan, T. X., & Izotov, Y. I. 2004, ApJ, submitted
- Valenti et al. (2004) Valenti, E., Ferraro, F. R., & Origlia, L. 2004, MNRAS, in press; preprint astro-ph/0403563
- van Zee et al. (1998) van Zee, L., Westpfahl, D., Haynes, M., & Salzer, J. 1998, AJ, 115, 1000
- Zwicky (1966) Zwicky, F. 1966, ApJ, 143, 192
| Magnitude | Main body | C component | |||
|---|---|---|---|---|---|
| F555W | F814W | F555W | F814W | ||
| 22 – 23 | 100.0 | 100.0 | 100.0 | 100.0 | |
| 23 – 24 | 97.0 4.9 | 99.9 1.7 | 100.0 | 100.0 | |
| 24 – 25 | 91.7 5.3 | 96.1 3.1 | 100.0 | 98.2 1.7 | |
| 25 – 26 | 90.6 7.7 | 89.7 2.3 | 97.4 3.0 | 98.2 1.7 | |
| 26 – 27 | 85.1 8.7 | 85.7 6.5 | 95.4 4.4 | 94.5 2.8 | |
| 27 – 28 | 78.9 8.5 | 70.7 10.4 | 92.9 9.2 | 80.4 4.2 | |
| 28 – 29 | 55.3 15.7 | 39.0 6.3 | 69.4 9.9 | 44.2 10.1 | |
| 29 – 30 | 10.4 7.7 | 5.4 7.1 | 16.5 9.4 | 9.8 8.4 | |
| 30 – 31 | 0.6 2.5 | 0.6 3.0 | |||