Accelerated planetesimal growth in self-gravitating protoplanetary discs
Abstract
In this paper we consider the evolution of small planetesimals (radii metres) in marginally stable, self-gravitating protoplanetary discs. The drag force between the disc gas and the embedded planetesimals generally causes the planetesimals to drift inwards through the disc at a rate that depends on the particle size. In a marginally stable, self-gravitating disc, however, the planetesimals are significantly influenced by the non-axisymmetric spiral structures resulting from the growth of the gravitational instability. The drag force now causes the planetesimals to drift towards the peaks of the spiral arms where the density and pressure are highest. For small particles, that are strongly coupled to the disc gas, and for large particles, that have essentially decoupled from the disc gas, the effect is not particularly significant. Intermediate sized particles, which would generally have the largest radial drift rates, do, however, become significantly concentrated at the peaks of the spiral arms. These high density regions may persist for, of order, an orbital period and may attain densities comparable to that of the disc gas. Although at the end of the simulation only % of the planetesimal particles lie in regions of enhanced density, during the course of the simulation at least % of the planetesimal particles have at some stage been in a such a region. We find that the concentration of particles in the spiral arms results in an increased collision rate, an effect that could significantly accelerate planetesimal growth. The density enhancements may also be sufficient for the growth of planetesimals through direct gravitational collapse. The interaction between small planetesimals and self-gravitating spiral structures may therefore play an important role in the formation of large planetesimals that will ultimately coagulate to form terrestrial planets or the cores of gas/ice giant planets.
keywords:
accretion discs — stars:pre-main-sequence — planetary systems: protoplanetary discs — planetary systems: formation1 Introduction
The formation of both terrestrial planets and the cores of gas/ice giant planets is thought to occur through the collisional accumulation of planetesimals (Safronov, 1972; Wetherill, 1990; Weidenschilling & Cuzzi, 1993). In the case of gas giant planets, a gaseous envelope is accreted once the core has become sufficiently massive (Lissauer, 1993; Pollack et al., 1996). Since this must occur while there is still enough gas in the circumstellar disc, and since observations (Haisch et al., 2001) suggest that most stars lose their gaseous discs within years, it is generally accepted that gas giant planets have to form within years.
The standard core accretion models of giant planet formation (Pollack et al., 1996; Bodenheimer et al., 2000) suggest formation times that could easily exceed disc lifetimes. However, this long formation timescale problem might be solved in light of the results of recent numerical simulations of the evolution of planetary cores embedded in turbulent accretion discs (Nelson & Papaloizou, 2004). These simulations show that cores may actually undergo a random walk through the disc, leading to the suggestion that core migration may significantly accelerate gas giant formation (Rice & Armitage, 2003; Alibert et al., 2004), a possibility initially recognised by Hourigan & Ward (1984).
An additional difficulty in the standard core accretion model is the growth of kilometre sized planetesimals from, initially, micron sized dust grains. Within a few scaleheights of the disc midplane, the pressure gradient in the circumstellar disc tends, for standard disc geometries, to be negative and causes the gas to orbit with sub-Keplerian velocities. The dust, which is not affected by the gas pressure gradient, and the gas therefore orbit with different velocities and the resulting drag force causes the dust grains to drift inwards at a rate that depends on their size (Weidenschilling, 1977; Takeuchi & Lin, 2002). For small sizes, the dust grains are essentially coupled to the disc gas and the radial drift velocity is consequently small. For large sizes, the grains are decoupled from the gas, move in nearly Keplerian orbits, and again have small radial drift velocities. Particles with intermediate sizes can, however, have large inward radial velocities. Although the exact size range depends on the circumstellar disc properties, the maximum radial velocity may easily exceed and is normally thought to occur for objects with sizes between 1cm and 1m (Weidenschilling, 1977).
Although the differential radial velocity is a crucial part of the grain growth, since larger objects grow by sweeping up smaller objects (e.g., Safronov 1972; Weidenschilling & Cuzzi 1993), if the maximum radial velocity is too high these objects may drift inwards before they can become large enough to decouple from the disc gas. Together with the inward radial drift, the larger grains may also settle towards the midplane (Goldreich & Ward, 1973; Garaud et al., 2004), producing a thin, dense dust layer (note, however, that the presence of turbulence in the disc can prevent the dust settling, see Stone et al. 1996). This layer may become self-gravitating and, if sufficiently unstable, could produce kilometre sized objects directly via gravitational collapse (Goldreich & Ward, 1973). This, however, requires extremely small random dust velocities ( cm/s), which may be difficult to achieve (Weidenschilling & Cuzzi, 1993; Cuzzi et al., 1993). Even if such small random velocities are possible, if objects are to grow via gravitational collapse, any increase in the random velocities has to be lost very rapidly (Gammie, 2001; Rice et al., 2003a).
An alternative mechanism for the formation of gas giant planets, that does not require the initial growth of a core, is that the gas itself may become unstable, producing gravitationally bound gaseous protoplanets (Boss, 1998, 2000). This again requires that the gas be cold and that it remain ‘almost isothermal’ (Pickett et al., 1998, 2000) or, equivalently, that any cooling mechanism is extremely efficient (Gammie, 2001; Rice et al., 2003a; Johnson & Gammie, 2003). Furthermore, some simulations of fragmenting protoplanetary discs suggest that, at best, this mechanism may be able to produce only the most massive ( Jupiter masses) gas giant planets (Rice et al., 2003b).
We study here the influence of the development of gravitationally unstable spiral modes on the planet formation mechanism via core accretion (see also Haghighipour & Boss, 2003a). Although it is possible that the conditions required for disc fragmentation may never be met (Pickett et al., 2000), it is quite likely that protostellar discs are self-gravitating in their early stages (e.g., Lin & Pringle, 1990; Lodato & Bertin, 2001). If so, the disc then becomes susceptible to the growth of non-axisymmetric spiral structures which can transport angular momentum very efficiently (e.g., Lodato & Rice, 2004). In the presence of such spiral structures, the gas pressure gradient, which can be large, changes from positive on one side of the structure to negative on the other, resulting in both super- and sub-Keplerian gas velocities. The gas drag force then causes dust grains to drift both radially inwards and outwards, depending on whether the local gas velocity is super-Keplerian or sub-Keplerian (Haghighipour & Boss, 2003a, b). The net effect is that the dust drifts towards the density maxima, where the pressure gradient is zero (Haghighipour & Boss, 2003a). A similar effect would occur in the presence of any coherent and long-lived density enhancement. Previous work (Godon & Livio, 2000; Klahr & Bodenheimer, 2003) has considered how vorticies may influence embedded particles. The formation of such vorticies is, however, still a matter of some debate.
In this paper we present the results of three-dimensional, global simulations of self-gravitating accretion discs in which we include both gas and dust, coupled via a drag force (Whipple, 1972; Weidenschilling, 1977). The gaseous disc is maintained in a state of marginal gravitational instability, achieved by letting the disc cool down (through a simple parametrisation of the cooling function; Gammie 2001 and Rice et al. 2003a). In this way a quasi-steady spiral structure develops in the disc and is maintained during several dynamical time-scales. We are therefore able to follow the process of concentration of the planetesimals in the spiral arms. We have performed several simulations, considering planetesimals of different sizes. We find that, for a given size range, the planetesimals are indeed able to reach high concentrations, in some regions attaining densities comparable to the gas. This could significantly enhance the coagulation of planetesimals into larger bodies, by increasing the planetesimal collision rates and/or by making the planetesimal sub-disc become gravitationally unstable (Youdin & Shu, 2002; Youdin & Chiang, 2004).
This paper is organised as follows. In Section 2 we summarize the basic features of the coupled dynamics of a two component (gas and planetesimals) disc, including a description of the relevant drag forces. In Section 3 we describe the simulation code that we have used and the numerical setup. In Section 4 we describe our results. In Section 5 we draw our conclusions.
2 Gas-planetesimal disc dynamics
We consider a system comprising two interpenetrating discs: a “gas” disc, that is evolved using the standard hydrodynamical equations of motion, and a “planetesimal” disc, that is considered as a collection of test particles evolved under the influence of gravitational and drag forces alone. Both the “gas” disc and the “planetesimal” disc rotate around a central protostar of mass , which we take to be equal to . The term “planetesimal” is generally used to refer to particles that have decoupled from the disc gas. Although the particles we consider here are still coupled to the gas, we use this term because, as we will discuss later, the particles we consider are clearly too large to be regarded as dust grains.
In order to illustrate the basic dynamical ingredients of our model, and to introduce the relevant physical quantities, let us consider first the simple case of a smooth, axisymmetric, non self-gravitating disc. We define the Keplerian velocity, , around the star at a distance by
| (1) |
The gas disc is characterized by a surface density profile , a temperature profile and a pressure profile . The gas sound speed is defined as
| (2) |
where is the gas volume density. Let and be the velocities of the gas and of the planetesimals, respectively. In centrifugal equilibrium the azimuthal component of the gas velocity is given by
| (3) |
where , is a measure of the importance of thermal effects in the disc. For most disc models, the density decreases with radius, so that and is generally sub-Keplerian. If the gas disc is in vertical hydrostatic equilibrium, its aspect ratio is given by
| (4) |
The planetesimals, on the other hand, are not affected by pressure forces and, in centrifugal equilibrium therefore orbit at the Keplerian velocity . Let be the relative velocity between the gas and the planetesimals. We assume that the gas and the planetesimals are coupled through a drag force, as described by Weidenschilling (1977) and Whipple (1972). The drag force is given by
| (5) |
where , , is the mean radius of the planetesimals and is the drag coefficient, given by
| (6) |
The drag regime where is generally called the Epstein regime, whereas the other three regimes define the Stokes drag. In the previous expression, is the Reynolds number, defined below in Eq. (9) and is the mean free path of the gas particles. Assuming the gas to be made mainly of molecular hydrogen, this is given by
| (7) |
where in the last expression the gas density is evaluated in cgs units, is the mass of the hydrogen molecule, and is its cross section
| (8) |
where is the mean radius of the hydrogen molecule (see Supulver & Lin 2000).
The Reynolds number is given by
| (9) |
where is the gas viscosity. For collisional viscosity, we have
| (10) |
We can therefore write
| (11) |
For the disc properties and particle sizes that we will consider here, the Mach number rarely exceeds unity and the Reynolds number generally falls in the range . Only in the inner regions of the disc, where is largest, does the Mach number exceed unity and the Reynolds number exceed .
Another important quantity is the “stopping time” , where
| (12) |
Here , is the mass of the planetesimals and is the internal density of the planetesimals (Throughout the paper, we take g/cm3). With the previous definitions, we have
| (13) |
where is the local dynamical timescale. The smaller , the more strongly the planetesimals are coupled to the gas. It is well known (Weidenschilling, 1977) that the gas-planetesimal interaction through the drag force causes the planetesimals to migrate in the direction of increasing pressure (i.e., inward, for a smooth, axisymmetric disc). The migration rate depends on the particle size and there is a range of particles sizes (the extent of which depends on the gas disc properties) that are characterized by a relatively large radial drift.
Consider, as an illustration, the average structure of one of the gas discs obtained from the numerical simulations of self-gravitating discs by Lodato & Rice (2004). On average, these discs are characterized by a power-law surface density profile, , and by an approximately flat profile, with a value of order unity, of the axisymmetric gravitational stability parameter (Toomre, 1964)
| (14) |
In the previous expression is the epicyclic frequency, that, for the nearly Keplerian discs considered here, is roughly equal to the orbital frequency , to order . The disc extends from au to au. The total disc mass is . The profile of essentially determines the pressure structure in the disc. We have then that , , and .


We can therefore estimate the radial drift velocity of planetesimals in such a disc, using standard techniques (Weidenschilling, 1977). The results are shown in Fig. 1, where the left panel shows the radial drift velocity in units of the local Keplerian velocity. Equivalently, defining the drift timescale , we have , so that the left panel of Fig. 1 also shows a measure of the drift timescale compared to the dynamical timescale. In the right panel of Fig. 1 we also show in yrs. It can be seen that for the assumed average gas disc properties, the largest radial drift would occur for planetesimals with sizes in the range between 10 and 100 cm. It should however be kept in mind that these results refer to the azimuthally averaged structure of the disc. Actually, the self-gravitating gas disc is characterized by a spiral structure, with alternating regions of high and low gas densities (see Fig. 2 below). Equation (3) then readily shows that the gas velocity changes from sub-Keplerian through super-Keplerian, when moving across one arm of the spiral structure. The drag force causes the planetesimals to drift towards regions of higher pressure (and hence of higher density), so we expect that the planetesimals tend to concentrate very fast around the maxima of the gas density (see also Haghighipour & Boss 2003a). The results described above then suggest, for the disc we are considering here, that this effect is maximal for planetesimals with sizes between 10 and 100 cm.
The expected drift timescale, in such structured discs, is going to be smaller than in a smooth disc. In fact, in a smooth, power-law disc the pressure gradient , while in a disc with a spiral structure (characterized by a typical scale ) the pressure gradient is of order . The increased pressure gradient decreases the drift timescale by a factor . The drift timescale is decreased by further factor because the planetesimals have to move only a distance of order to reach the density maxima. We therefore expect a significant concentration of the planetesimals around the gas density maxima to take place over a timescale a factor smaller than that displayed in Fig. 1, becoming therefore comparable with the dynamical timescale in the most favourable cases. By inspection of the right panel of Fig. 1, we also obtain that for particles with sizes between and cm, we need only run our simulation for about yrs in order to follow the effect of radial drift on the planetesimal sub-disc.
3 Numerical simulations
3.1 Smoothed particle hydrodynamics
The three-dimensional gaseous disc used in these simulations is modelled using smoothed particle hydrodynamics (SPH), a Lagrangian hydrodynamics code (see Benz 1990; Monaghan 1992). The gas disc consists of 250,000 SPH particles, each of which has a mass and an internal energy (temperature). Each particle also has a smoothing length that is allowed to vary with time to ensure that the number of neighbours (SPH particles within 2 smoothing lengths) remains . These neighbouring particles are used to determine the density which, together with the internal energy, is used to compute the pressure. The central star is modelled as a point mass onto which gas particles may accrete if they approach to within the sink radius (e.g., Bate et al. 1995), here taken to be 0.25 au. Both the central point mass and the gas particles use a tree to determine gravitational forces, and to determine the gas particle neighbours.
The small planetesimals are modelled using an additional type of particle. These particles are, as far as the gas simulation is concerned, massless (i.e., in these simulations we neglect the self-gravity of the planetesimal disc and the back reaction of the drag force on the gas). They experience only gravitational forces (from the central star and from the disc gas) and are coupled to the disc gas via a drag force. As discussed in Section 2 the drag force depends on the particle size, the local gas density, and on the local gas velocity. To determine the drag force coefficient also requires the gas sound speed which is calculated using the local gas internal energy. The gravitational force on these test particles is computed by including them in the tree. This also determines their nearest gas neighbours. To ensure that the number of gas neighbours remains , the test particles also have a smoothing length that is allowed to vary with time. These neighbouring particles are then used to calculate the gas density, velocity, and internal energy at the location of each test particle using the standard SPH formalism (see Monaghan 1992). The exact value of the drag force is then determined by specifying the planetesimal size. In each simulation performed here, we use 125,000 test particles to represent a planetesimal disc which we assume contains particles of a single size.
An additional saving in computational time is made by using individual particle time-steps (Bate et al., 1995) with the time-steps for each particle limited by the Courant condition and by a force condition (Monaghan, 1992). As will be discussed in more detail in the following sections, the gas disc is assumed, in the absence of any cooling mechanism, to have an adiabatic equation of state with an adiabatic index of . The gas disc is initially evolved, in the absence of test particles, by imposing a cooling term which is chosen such that the disc ultimately settles into a quasi-steady, self-gravitating state. The test particles are then added and the simulation is evolved for an additional outer rotation period.
3.2 Self-gravitating gas disc simulations
In this work we use the results of the numerical simulations by Lodato & Rice (2004) of the dynamics of self-gravitating gas discs as an input for our two-component gas-planetesimals disc simulations.
It is well known that the onset of gravitational instabilities in the disc is determined by the value of the parameter , defined in Eq. (14). If is smaller than a threshold value of order unity, the disc quickly develops a spiral structure on the dynamical timescale. The presence of the spiral influences strongly the thermal evolution of the disc, in that it provides a source of effective heating. Since is proportional to the thermal speed , in the absence of any cooling would rapidly become relatively large and the spiral structure would vanish. However, if some cooling is present, a self-regulated state can be achieved where the heating provided by the spiral structure balances the external cooling, leading to a long-lasting spiral.
These processes have been recently explored numerically by Lodato & Rice (2004) (see also Gammie 2001), who have performed global, three-dimensional simulations of the evolution of self-gravitating discs. They imposed a cooling of the form:
| (15) |
where is the internal energy of the gas and the cooling timescale is taken to be simply proportional to the dynamical timescale, . For very rapid cooling timescales () the self-gravitating disc undergoes fragmentation (Gammie, 2001; Rice et al., 2003a). In this work we have taken , giving a cooling time that should not, and indeed does not, lead to fragmention.
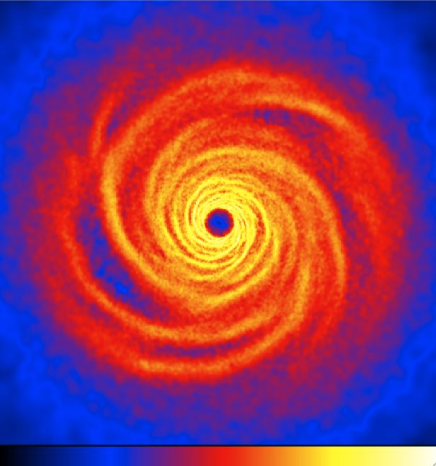
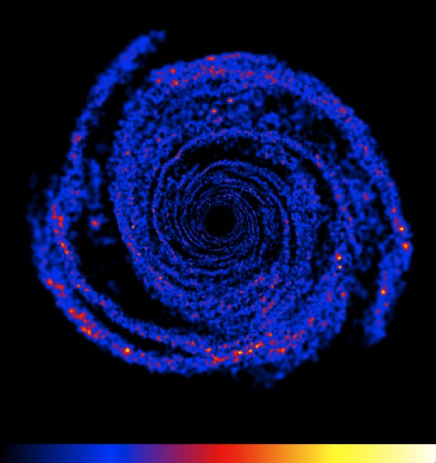
The simulations by Lodato & Rice (2004) indeed show the effectiveness of the self-regulation process. The disc extends from au to au, and is characterized initially by a surface density profile and a temperature profile . The exact surface density is determined by specifying a total disc mass, and the temperature is determined by specifying that the Toomre parameter has an initial value of at the outer edge of the disc. The temperature profile, however, is rapidly modified by the competing heating and cooling processes operating in the disc, as discussed above. At the end of the simulations a self-regulated state is achieved with an almost constant profile of , with a value close to unity. The spiral structure obtained in this way is a quasi-steady feature lasting for at least several thermal timescales (i.e., at least until the end of the simulations). Fig. 2 shows the final disc structure for a disc whose total mass is . The image shows the logarithm of , with a colour scale covering .
The spiral structure transports angular momentum in the disc and therefore promotes the accretion process. This leads also, in some cases, to a steepening of the surface density profile. This process however occurs on the much longer ‘viscous’ timescale, so that the final profile of is only slightly modified with respect to the initial one (see Lodato & Rice 2004).
3.3 Numerical setup
We initially evolve the gas disc in the absence of any test particles, as described in the previous Section. After orbital periods at the outer edge of the disc (i.e., after yrs), a quasi-steady, self-regulated state is reached. We then introduce the planetesimals and evolve the simulation as described above in Section 3.1 for roughly one more outer orbital period (i.e., yrs).


In order to cover a wide range of planetesimal sizes we have considered separately planetesimal sizes of 50 cm and 1000 cm. Based on the results of Section 2, we expect the 50 cm sized planetesimal to have the largest radial drift. For smaller planetesimal sizes (e.g, 1 cm) we expect the acceleration due to the drag force to be very large, resulting in extremely long computation times. However, for such small planetesimals, we expect the drag to be so large that their structure will closely match that of the gas. In addition to the 50 and the 1000 cm cases, we have also performed one simulation in which no drag force was included, so as to provide a direct measure of the effect of gas drag on the evolution of the planetesimals.
The planetesimal disc initially extends from au to au. The surface density profile of the planetesimals was taken to be proportional to . Since we neglect the planetesimals’ self-gravity and the back reaction of the drag force on the gas, the actual value of the planetesimal disc surface density does not influence the results of the simulations (the planetesimal SPH particles are just a “tracer” of the evolution of the solid bodies in the gas disc). However, in order to present illustration values in the analysis of our results, we will assume that the initial ratio of the planetesimal to gas surface densities is in all cases.
Initially all the planetesimals are located in the plane. However, during the simulation, the random motions induced by the gravitational instabilities rapidly stir the planetesimal disc up, so that eventually it acquires a finite thickness slightly smaller than the gas disc thickness .
4 Results
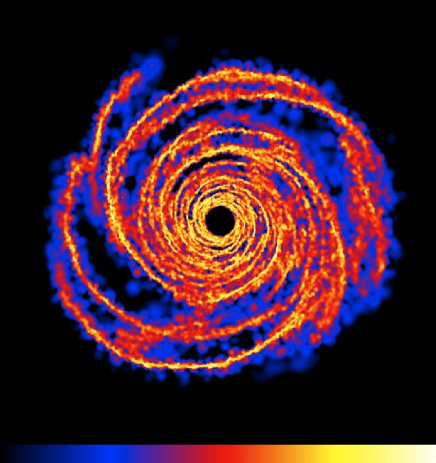
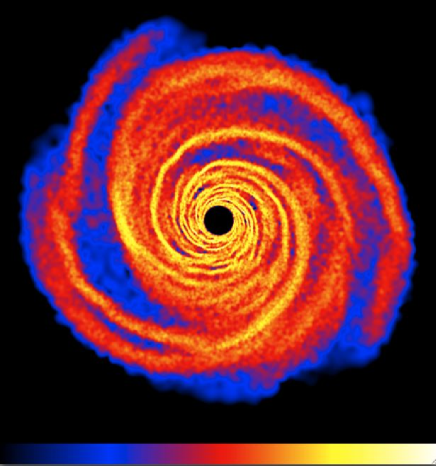
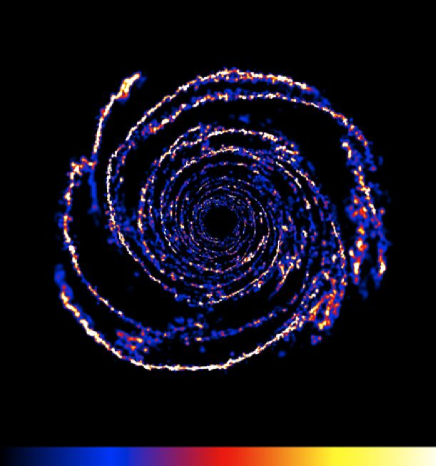
Fig. 3 shows the surface density structure of the planetesimal discs, one outer orbital time after the introduction of the planetesimals in the simulations (i.e., after yrs). At this stage, most of the disc has evolved for several dynamical timescales, so that any initial transient features have disappeared. The figure refers to the cases where the planetesimal sizes were cm (left panels) and cm (right panels). The upper panels show the logarithm of the surface density (in order to have a direct comparison with Fig. 2, the surface densities have been multiplied by and the same colour scale has been used). The bottom panels show the ratio of the planetesimal and gas surface densities. The colour scales in the latter plots are exactly the same for the two different planetesimal sizes and covers the range .
These plots clearly show how the planetesimal evolution changes with changing planetesimal size. As expected, the 50 cm planetesimals are strongly influenced by the gas drag and display a spiral pattern with very thin spiral arms, indicating that the planetesimals are concentrated at the bottom of the potential. The effect is reduced in the 1000 cm case, where the spiral structure in the planetesimal disc is similar to that of the gas disc, indicating that the planetesimals are pushed into the spirals mainly because of the gravitational field (note that since the planetesimals have no pressure support, we expect the spiral arms to be slightly thinner even if no drag force is introduced). A similar structure, with relatively broad spiral arms, was indeed also seen in the simulation with no drag force.
The bottom panels in Fig. 3 show how the concentration of planetesimals is modified by the combined effect of gas drag and gravity. If the gas and planetesimals respond in the same way to the gravitational instabilities, the density ratio would be uniform through the disc, so that any non-uniformity in the bottom panels is a direct measure of the concentration effect on the planetesimals caused by the combination of gas gravity and drag force. Clearly, the 50 cm planetesimal reach a much higher concentration compared to the 1000 cm case. At the end of the simulation has increased by a factor for the 1000 cm case, while in the 50 cm case the maximum increase can be as high as , in some regions therefore reaching surface densities comparable to that of the gas.
Fig. 4 shows a histogram of the distribution of planetesimal volume densities, , for both the 50 cm and 1000 cm particles (left panel), and a histogram of the distribution of gas volume densities, , scaled down by two orders of magnitude for a direct comparison with the planetesimal density (right panel), at the end of the simulations. In both panels is the total number of particles of the type being considered. The planetesimal volume densities were determined by assuming, as mentioned earlier, that the initial planetesimal to gas surface density ratio was . The distribution for the 50 cm planetesimals (solid line - left panel) shows a tail at high densities extending to more than an order of magnitude above the 1000 cm planetesimals (dotted line - left panel). The distribution of gas volume densities (right panel) is also similar to that of the 1000 cm particles, again illustrating that the 1000 cm particles are more strongly influenced by the gravitational potential than by the drag force. The concentration of planetesimals is further illustrated in Fig. 5 which shows the distribution of the ratio of the planetesimal volume density to the gas volume density. This shows that the volume density of the 50 cm planetesimals (solid line) may increase to a value similar to the gas density. The volume density ratio for the 1000 cm particles (dotted line), on the other hand, barely exceeds and in most regions has a value below . Given an “unperturbed” density ratio of 0.01, this means that the volume density of the 1000 cm particles is almost never enhanced by more than a factor of 10. These results confirm our expectations that for the planetesimals with the largest expected radial drift, the combined effect of gas drag and spiral structure induced by self-gravity leads to a significant concentration of the planetesimals along the spiral arms.


Fig. 6 shows how the volume density, as seen by a representative planetesimal located at au, varies with time. The left and the right panels display the results for the 50 cm and the 1000 cm cases, respectively. The solid line shows the planetesimal volume density, while the dotted line shows the corresponding gas volume density. The differences between the two cases are striking also in this case. The planetesimal density for the 1000 cm particles essentially follows closely the gas density, with relatively small variations, and oscillates between high and low values as the planetesimal goes in and out of the regions of enhanced gas density (the spiral arms). In the 50 cm case, the planetesimal density reaches extremely high values becoming comparable to the gas density when the planetesimal moves into a spiral arm. The planetesimal density can also remain high for as long as yrs, comparable to the dynamical timescale at 8 au.
To summarize, Fig. 5 shows that at a given time a significant fraction of the 50 cm planetesimals have a large concentration (say, ). On the other hand, Fig. 6 shows that a given particle spends only a fraction of the total simulation at high . This suggest that the total fraction of planetesimals which at some stage during the run have a large is actually larger than the corresponding fraction taken at a given time. To estimate this effect we have computed the maximum value of attained by the planetesimals during the whole simulation (in order to reduce computational time, we have performed this analysis only for a subset of the total number of planetesimal SPH particles). The dotted line in Fig. 7 shows the cumulative distribution of at a given time (i.e., the cumulative distribution corresponding to the solid line of Fig. 5), while the solid line shows the cumulative distribution of the maximum , computed as described above. This figure clearly shows that, while at any given time during the simulation the fraction of planetesimals with (i.e., enhanced by more than a factor 10) is %, the fraction of planetesimal that at some stage during the simulation attains the same value of is significantly higher, %.
5 Discussion and conclusions
The concentration of planetesimal, due to the combined effect of gas drag and gravity, that we find in our simulations can have a significant effect on the process of coagulation of planetesimal into larger bodies. This can occur either by increasing the planetesimal collision rate and/or by making the planetesimal sub-disc gravitationally unstable.


The collision rate of planetesimals is proportional to , where is the planetesimal number density and is their velocity dispersion. Since in our case the Safronov number is always much smaller than unity, we can neglect the effect of gravitational focusing. In order to assess the effect of gas drag on the collision rate, we have first computed the azimuthally averaged value of from the simulation with no drag force, , as a function of radius. We have then computed, for every planetesimal SPH particle in both the 50 cm case and the 1000 cm case, the ratio , where the average value is computed at the same radial location in the disc. If the gas drag had no effect on the collision rate, the distribution of would be strongly peaked around unity. Fig. 8 shows the distribution of that we have obtained in the three cases (no drag force: dashed line; 1000 cm size: dotted line; 50 cm size: solid line). As expected, the distribution for the no-drag simulation is strongly peaked around unity. Fluctuations of not related to the gas drag result only in an increase of the collision rate by no more than a factor . In contrast, the introduction of the gas drag leads to a broader distribution of collision rates, especially for the 50 cm case where the distribution has a tail extending more than two orders of magnitude above the average value. As discussed earlier, the fraction of particles concentrated in the spiral arms at a given time is smaller than the fraction of particles that, during the course of the whole simulation, are at some stage concentrated in the spiral arms. Since the enhancement in collision rate is due to the enhanced density resulting from the concentration of the planetesimals in the spiral arms, the number of particles over the entire simulation time that at some stage are in a region of enhanced collision rate will also be greater than the number at a single time. Depending on how well particles of this size stick together during collisions, this enhanced collision rate could play an important role in the growth of larger planetesimals.


A planetesimal surface density enhancement of a factor may also be sufficient to make the planetesimal sub-disc gravitationally unstable (e.g., Youdin & Shu 2002). This is exactly the range of concentrations that we achieve in 50 cm simulation. However, since we have neglected the planetesimal self-gravity, we are not able to obtain a gravitational instability in the planetesimal disc in our simulations (for a more detailed study of the stability of a two component self-gravitating disc, see Bertin & Romeo (1988)). In order to assess the importance of the planetesimal self-gravity we have performed two separate tests.
We have first computed the quantity
| (16) |
where is the radius of a region that has a local planetesimal density of . This quantity is a measure of the relative effects of local gravitational collapse for the planetesimals versus tidal disruption. Fig. 9 shows the distribution of in the 50 cm case (solid line) and in the 1000 cm case (dotted line). In the 50 cm case reaches much higher values than in the 1000 cm case, becoming as large as 1. This suggest that the density enhancements in the 50 cm simulation may be gravitationally significant and that the planetesimal disc could become gravitationally unstable.
As a separate measure, we have also computed the Jeans mass,
| (17) |
at the location of every planetesimal particle. If, at any location, the minimum resolvable mass (the mass, , contained within 2 smoothing lengths) exceeds the local Jeans mass, then the planetesimals’ self-gravity has to play a role. The distribution of is shown in the right panel of Fig. 9. In the 50 cm case, the distribution is shifted towards higher values and is much broader than in the 1000 cm case. For the most massive clumps, the ratio can become comparable to or even larger than unity, indicating that the gravitational instability would play a significant role in these regions.
Note that since the vertical scale height of the planetesimal disc is comparable to the scaleheight of the gas disc, the high densities achieved in our simulation using 50 cm particles is only due to radial and azimuthal compressions rather than by the vertical settling of the planetesimals in the midplane. Therefore, unlike in the standard picture for gravitational instability (Goldreich & Ward, 1973; Youdin & Shu, 2002), our results should not be affected by additional turbulence generated by the vertical shear between the gas and the dust.
To summarize, in this work we have shown how the interaction between a self-gravitating gaseous protoplanetary disc and embedded planetesimals plays an important role in accelerating planetesimal growth. However, there are a number of important effects that we have neglected in this first approach to the problem. (i) The planetesimals have been essentially modelled as test particles, ignoring both the back reaction of the planetesimals on the gas and the planetesimal self-gravity. In regions where the planetesimal density is enhanced (becoming in some regions comparable to the gas density) both effects may be very important. (ii) In each simulation the planetesimals are assumed to be of a single size and the volume density is computed by assuming that the initial surface density ratio is . In reality there will be a range of planetesimal sizes (e.g., Mathis et al. 1977; Mizuno et al. 1988; note, however, that these studies consider grain sizes much smaller than those considered here) and only those with sizes, in this case, between and cm (see Fig. 1) will be significantly influenced by the self-gravitating structures in the gas disc. During the evolution of the protoplanetary nebula there might well be some stage where most of the planetesimal mass is contained within a relatively small range of sizes, so that our assumptions may not be unrealistic. When this size range includes the size for which the drift induced by the drag is significant, we can expect a significant increase in collision rate and an enhanced tendency toward gravitational collapse. To address the details of these processes we would need to consider many other effects (such as the sticking properties of planetesimals) which are beyond the scope of the present paper. (iii) In this work we have considered, as an illustration, the self-gravitating structure resulting from a relatively massive gas disc (with a mass ). However, a well defined spiral structure is also present in significantly less massive discs (Lodato & Rice, 2004). It would then be interesting to check the dependence of some of the details of the results described here (such as what is the relevant size range for the planetesimals that display the strongest response to the spiral structure) on the specific choice of the gas disc properties.
We plan in the future to include some of the effects described above, such as the backreaction of the planetesimals on the disc gas, the effect of planetesimal self-gravity, and we plan to consider various disc masses. However, it seems clear that if protoplanetary discs experience a self-gravitating phase, the resulting disc structures could well play an important role in planetesimal evolution and growth and could ultimately influence the growth of terrestrial planets and the cores of gas/ice giant planets. Also, since a protoplanetary disc is most likely to become gravitationally unstable early in the star formation process, we might expect substantial processing of the dust prior to the optically visible Classical T Tauri phase.
Acknowledgements
The simulations reported in this paper made use of the UK Astrophysical Fluids Facility (UKAFF). WKMR acknowledges support from a UKAFF Fellowship. GL acknowledges support from the EU Research Training Network Young Stellar Clusters. JEP acknowledges support from the STScI visitor program. PJA acknowledges support from the National Science Foundation under grant AST 0407040, and from NASA under grant NAG5-13207 issued through the Office of Space Science. We thank Cathie Clarke and Steve Lubow for interesting discussions.
References
- Alibert et al. (2004) Alibert Y., Mordasini C., Benz W., 2004, A&A, L25, 417
- Bate et al. (1995) Bate M. R., Bonnell I. A., Price N. M., 1995, MNRAS, 277, 362
- Benz (1990) Benz W., 1990, in Buchler J., ed., The Numerical Modeling of Nonlinear Stellar Pulsations Kluwer, Dordrecht
- Bertin & Romeo (1988) Bertin G., Romeo A. B., 1988, A&A, 195, 105
- Bodenheimer et al. (2000) Bodenheimer P., O. H., J.J. L., 2000, Icarus, 143, 2
- Boss (1998) Boss A. P., 1998, Nature, 393, 141
- Boss (2000) Boss A. P., 2000, ApJ, 536, L101
- Cuzzi et al. (1993) Cuzzi J., Dobrovolski A. R., Champney J. M., 1993, Icarus, 106, 102
- Gammie (2001) Gammie C. F., 2001, ApJ, 553, 174
- Garaud et al. (2004) Garaud P., Barriére-Fouchet L., Lin D. N. C., 2004, ApJ, 603, 292
- Godon & Livio ( 2000) Godon P., Livio M., 2000, ApJ, 537, 396
- Goldreich & Ward (1973) Goldreich P., Ward W. R., 1973, ApJ, 183, 105
- Haghighipour & Boss (2003a) Haghighipour N., Boss A. P., 2003a, ApJ, 583, 996
- Haghighipour & Boss (2003b) Haghighipour N., Boss A. P., 2003b, ApJ, 598, 1301
- Haisch et al. (2001) Haisch K., Lada E., Lada C., 2001, ApJ, 552, L153
- Hourigan & Ward (1984) Hourigan K., Ward W. R., 1984, Icarus, 60, 29
- Johnson & Gammie (2003) Johnson B. M., Gammie C. F., 2003, ApJ, 597, 131
- Klahr & Bodenheimer (2003) Klahr H., Bodenheimer P., 2003, in Fridlund M., Henning T., eds, ESA Spec. Pub. SP-539, DARWIN/TPF and the Search for Extrasolar Terrestrial PLanets, Heidelberg, p. 481
- Lin & Pringle (1990) Lin D. N. C., Pringle J. E., 1990, ApJ, 358, 515
- Lissauer (1993) Lissauer J. J., 1993, ARA&A, 31, 129
- Lodato & Bertin (2001) Lodato G., Bertin G., 2001, A&A, 375, 455
- Lodato & Rice (2004) Lodato G., Rice W. K. M., 2004, MNRAS, 351, 630
- Mathis et al. (1977) Mathis J. S., Rumpl W., Nordsieck K. H., 1977, ApJ, 217, 425
- Mizuno et al. (1988) Mizuno H., Markiewicz W. J., Voelk H. J., 1988, A&A, 195, 183
- Monaghan (1992) Monaghan J. J., 1992, ARA&A, 30, 543
- Nelson & Papaloizou (2004) Nelson R. P., Papaloizou J. C. B., 2004, MNRAS, 350, 849
- Pickett et al. (1998) Pickett B. K., et al., 1998, ApJ, 504, 468
- Pickett et al. (2000) Pickett B. K., et al., 2000, ApJ, 529, 1034
- Pollack et al. (1996) Pollack J. B., et al., 1996, Icarus, 124, 62
- Rice & Armitage (2003) Rice W. K. M., Armitage P. J., 2003, ApJ, 598, L55
- Rice et al. (2003a) Rice W. K. M., Armitage P. J., Bate M. R., Bonnell I. A., 2003a, MNRAS, 338, 227
- Rice et al. (2003b) Rice W. K. M., Armitage P. J., Bate M. R., Bonnell I. A., Jeffers S. V., Vine S. G., 2003b, MNRAS, 346, L36
- Safronov (1972) Safronov V. S., 1972, Evolution of the protoplanetary cloud and formation of the earth and the planets. Jerusalem
- Stone et al. (1996) Stone J. M., Hawley J. F., Gammie C. F., Balbus S. A., 1996, ApJ, 463, 656
- Supulver & Lin (2000) Supulver K. D., Lin D. N. C., 2000, Icarus, 146, 525
- Takeuchi & Lin (2002) Takeuchi T., Lin D. N. C., 2002, ApJ, 581, 1344
- Toomre (1964) Toomre A., 1964, ApJ, 139, 1217
- Weidenschilling (1977) Weidenschilling S., 1977, MNRAS, 180, 57
- Weidenschilling & Cuzzi (1993) Weidenschilling S. J., Cuzzi J. N., 1993, in Levy E. H., Lunine J. I., eds, Protostars and Planets III University of Arizona Press, Tucson
- Wetherill (1990) Wetherill G., 1990, ARE&PS, 18, 205
- Whipple (1972) Whipple F. L., 1972, in Elvius A., ed., From Plasma to Planets Wiley, London
- Youdin & Chiang (2004) Youdin A. N., Chiang E. I., 2004, ApJ, 601, 1109
- Youdin & Shu (2002) Youdin A. N., Shu F. H., 2002, ApJ, 580, 494