Spectroscopic monitoring of the transition phase in nova V4745 Sgr††thanks: Based on data obtained at the Mount Stromlo and Siding Spring Observatories, Australia and the Wise Observatory, Israel
We present a spectroscopic monitoring of the transient nova V4745 Sagittarii (Nova Sgr 2003 #1) covering ten months after the discovery. During this period the light curve showed well expressed transient phase in the form of six rebrightenings, and the presented dataset is one of the best spectroscopic coverages of a classical nova during the transition phase. Low- and medium-resolution spectra revealed that the majority of spectral lines switched back to strong P-Cyg profiles during the mini-outbursts, similar to the spectra just after the major eruption. We interpret the observed phenomena as evidence for “echo-outbursts” resulting in episodes of secondary mass-ejections and propose that the transition phase in classical novae is driven by repetitive instabilities of the hydrogen shell burning on the surface of the white dwarf. From the available light curve data we estimate the absolute magnitude of the system of about . All spectrophotometric pieces of evidence point toward a very low () interstellar reddening, leading to a rough distance estimate of V4745 Sgr ().
Key Words.:
stars: novae, cataclysmic variables – stars: individual: V4745 Sgre-mail: csakb@physx.u-szeged.hu
1 Introduction
V4745 Sgr (Nova Sgr 2003 #1; , , equinox J2000.0) was discovered independently by Brown and Yamamoto (2003) on T-Max 400 films on Apr. 25 and 26 at . Nothing was visible to 105 at this location on Yamamoto’s patrol films taken during 2000 Apr. 28–2003 Apr. 5. Spectroscopic confirmation was given by optical and infrared spectroscopy (Ashok & Banerjee 2003). The first optical spectrum showed it was a nova of the “Fe II” class in the classification system of Williams (1992), with strong Balmer lines having P-Cyg profile. After rapid fading it rebrightened again within a few days, and the emission lines of the Balmer series and strong Fe II emission lines at 4176 and 4233 Å showed complex P-Cyg profiles (Kiss & Jacob 2003).
In Fig. 1 we show the light curve of the nova based on visual, photographic and CCD observations collected by the VSNET group (Kato et al. 2004b), which includes several pre-discovery observations, too. From this curve we estimate that the visual maximum occurred at 74 on 2003 Apr. 18.4 UT. The uncertainty of the maximum brightness is at least 05 and 05 in time, due to the poor observational coverage. The shape of the light curve – the maximum brightness, a rapid decline, followed by rebrightenings which are superimposed on the general fading – is very similar to nova V443 Sct (Anupama et al. 1992), and other novae with transient type light curves.
There are two major types of transient effects in the classical nova light curves during decline: the light curve can either show a deep minimum (like in DQ Her) interpreted by the formation of an optically thick dust envelope around the binary system, or slow, oscillation-like features of ambiguous origin (e.g., V603 Aql, V1494 Aql, DK Lac, GK Per, V373 Sct, V443 Sct, etc). For simplicity, throughout the paper we only refer to the latter as the transition phase.
Several models for the oscillations during the transition phase have been proposed, e.g., steady-state super-Eddington winds (Shaviv 2001), oscillations of the common envelope, or the hot white dwarf (see Retter 2002, for a recent summary), but there are still not enough observational studies to give a firm explanation of this phenomenon. Very recently, Retter (2002) proposed a new solution invoking a possible connection between the transition phase and intermediate polars.
The little observational data during the transition phase and the presence of several competing models motivated this work. Here we present a spectroscopic monitoring of V4745 Sgr, which resulted in one of the best covered transient phases. We detected remarkable spectral variations, which shed new light on the possible physical mechanism driving the light curve “oscillations”. The main goal of this paper is to present our spectroscopic analysis based on observations taken at and around three of the rebrightenings between t=26 to 182 d (t refers to the number of days passed since the optical maximum). In addition, important physical parameters of the system were also estimated.
2 Observations
| t | date | range | im. scale | telescope | |
|---|---|---|---|---|---|
| /px | |||||
| 26 | 2003 | May 13 | 3500–4450 | 0.55 | SSO 2.3 |
| 6360–7000 | 0.55 | ||||
| 28 | — | May 15 | —”— | 0.55 | SSO 2.3 |
| 31 | — | May 18 | —”— | 0.55 | SSO 2.3 |
| 34 | — | May 21 | —”— | 0.55 | SSO 2.3 |
| 75 | — | Jul 1 | 4000–7800 | 3.75 | WO 1.0 |
| 83 | — | Jul 9 | —”— | 3.75 | WO 1.0 |
| 105 | — | Jul 30 | —”— | 3.75 | WO 1.0 |
| 111 | — | Aug 6 | —”— | 3.75 | WO 1.0 |
| 131 | — | Aug 26 | —”— | 3.75 | WO 1.0 |
| 159 | — | Sep 23 | —”— | 3.75 | WO 1.0 |
| 173 | — | Oct 7 | 4000–4980 | 0.55 | SSO 2.3 |
| 6150–7150 | 0.55 | ||||
| 174 | — | Oct 8 | —”— | 0.55 | SSO 2.3 |
| 175 | — | Oct 9 | —”— | 0.55 | SSO 2.3 |
| 182 | — | Oct 16 | —”— | 0.55 | SSO 2.3 |
| 296 | 2004 | Feb 9 | 5980–7008 | 0.55 | SSO 2.3 |

The observations were carried out in two locations, on 15 nights between May 13, 2003 and Feb. 9, 2004. Medium-resolution spectra (the image scale was 0.55 px-1) were taken with the Double Beam Spectrograph (Rodgers et al. 1988), mounted in the Nasmyth focus of the 2.3-m Advanced Technology Telescope at Siding Spring Observatory (SSO), Australia.
Low-resolution spectra (image scale: 3.75 px-1) were taken using the Faint Object Spectrograph and Camera attached to the 1.0-m telescope of the Wise Observatory (WO), Israel. The observations details are given in Table 1, while the epochs of observations are marked in Fig. 1 with arrows.
All spectra were reduced with standard IRAF111IRAF is distributed by the National Optical Astronomy Observatories, which are operated by the Association of Universities for Research in Astronomy, Inc., under cooperative agreement with the National Science Foundation. tasks, including bias and flat field corrections, aperture extraction and wavelength calibration. The exposure times varied between 120 and 900 seconds, depending on the actual wavelength range and the brightness of emission features.
The SSO spectra were not flux calibrated – except for two nights in October – due to observing conditions, while the WO spectra were calibrated, using some general flux calibrators observed at the observatory back to April, so that the flux-level uncertainty can exceed 10%. Nevertheless, the overall spectroscopic appearance is hardly affected by this uncertainty.
3 Description of the spectra

The first set of spectra was obtained in the time interval from 26 to 34 days after the maximum brightness, during the second rebrightening and the following fading. The blue spectra, covering 3500 Å to 4450 Å, are characterized by strong emissions of the hydrogen Balmer series and Fe II lines, all with P-Cyg profiles. The radial velocities of the absorption features are approximately , , and km s-1 (the bottom curve in Fig. 2). These absorption features are also present in the other Balmer and Fe II emission lines (see Fig. 3a).


We obtained spectra simultaneously in the red region, centered approximately on the H line. The line profiles are plotted in Fig. 3b. Similar absorption features at the same velocities can be seen in the H emission line. The relatively smooth line shape evolved into a broad and complex emission profile. We can identify strong, redshifted emission features in spectra taken at and 34 days, at velocities , and km s-1. These emissions are probably the symmetric pairs of the blue-shifted absorption profiles. The presence of P-Cyg profiles suggests that the rebrightening of the nova was accompanied with mass-ejection. The ejection was not isotropic as implied by the appearance of complex absorption–emission pairs.
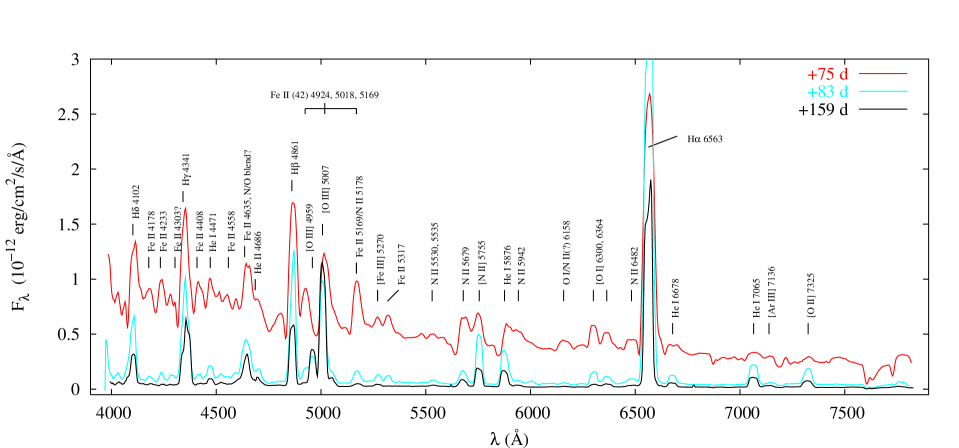
During the following four months we collected low-resolution spectra at the WO. A sample of these spectra is plotted in Fig. 4. We can identify the Balmer series from H to H, He I and He II, forbidden and permitted O I/II/III and N II lines and a couple of Fe II emissions. Note the presence of the nebular lines (forbidden oxygen, nitrogen and iron) two and half months after the maximum brightness. On July 1 (), the nova was six days after its fourth rebrightening, and we can identify P-Cyg profiles at the blue wings of the brighter emission lines again at km s-1 (the upper curve in Fig. 4). In addition, the continuum is significantly brighter and bluer than in the other phases. At , the continuum at the visual photometric band was 5–6 times brighter than later, at t=83 d. This behaviour is consistent with the 2 mag brightening of the system in the visual band (see Fig. 1).
The next observing run was between Oct. 7 and 16, at the SSO. We obtained spectra on three consecutive nights, just before the sixth rebrightening, and on one night that was almost at the maximum brightness of this minor outburst. The spectra of the blue region are presented in Fig. 3c, while the variation of the H line is plotted in Fig. 3d. The changing emission line profiles (most strikingly in the Fe II/N/O blend around 4635 ) and the sudden appearance of broad emission wings at t=175 d showed that a major change of the system was developing. Two days after this observation, the sixth rebrightening was detected by visual observers. The top curves in panels c and d in Fig. 3 show the outburst features on Oct. 16 (t=182 d). The FWHM of the Balmer lines increased from 2000 km s-1 to 3000 km s-1 and strong P-Cyg profiles were developed. We can identify absorption features of the H profile at and km s-1 and a relatively strong [Fe II] emission line at 4245 . The presence of [Fe II] lines is very rare in nova spectra, and we know only several similar cases, for example CP Pup (Weaver 1944) and V1494 Aql (Iijima & Esenoglu 2003).
The last observation was made on Feb. 9, 2004 (t=296 d) at the SSO. The H line profile is presented in Fig. 6. The FWHM of the line decreased to approximately 2000 km s-1, and the emission structure evolved to remarkable triple symmetry. This structure can be explained with rings of enhanced brightness in the ejected shell (Gill & O’Brien 1999). We can easily identify two pairs of emissions (at –830, 160 and –220, 690 km s-1), which probably sign the presence of two tropical rings (indicated with straight lines). We also marked the third, very weak pair with dotted lines (–580, 460 km s-1). This pair is likely indicate an equatorial ring.


4 Physical parameters and the light curve
4.1 Absolute magnitude in maximum
The light curve of V4745 Sgr (Fig. 1) indicates that the nova reached maximum brightness on April 18.4 UT (JD ) with . P.M. Kilmartin reported a possible precursor of the nova on a red DSS image at mag and position end figures , (in Brown et al. 2003). Assuming this value, the amplitude of the outburst reached 10 mags. We have derived the parameters and using a smooth curve fitted to the light curve excluding those parts which were affected by the minor outbursts. Of the resulting parameters, days, days (formal errors), seems to be more sensitive to the exact location of secondary maxima. The light curve is quite fuzzy in the first 30 days, thus the given parameters probably have much larger uncertainty than what is implied by the formal errors of the polynomial fits. Nevertheless, both decline rates indicate that V4745 Sgr was a moderately fast nova.
The visual absolute magnitude in maximum was estimated with three maximum magnitude versus rate of decline (MMRD) relations using (Della Valle & Livio 1995; Capaccioli et al. 1989; Cohen 1985) and two other relations utilizing (Schmidt 1957; de Vaucouleurs 1978). The given resulted in 875, 879 and 844 for , respectively, while yielded two other values close to 77. The 1 mag difference clearly shows the limitations of the MMRD relations in complex cases such as the present one. Without any other meaningful constraint on the luminosity, we adopt the formal average of these values, which is . This leads to an uncorrected distance modulus .
4.2 Interstellar reddening and distance
Despite the large uncertainty of the MMRD-based absolute magnitude, determining the interstellar reddening is crucial when calculating distance limits. Here we present various empirical pieces of evidence for a very low reddening toward V4745 Sgr.
Broad band colour measurements by Gilmore and Kilmartin (in Brown et al. 2003; Gilmore 2003; Gilmore et al. 2003; Gilmore & Kilmartin 2003) gave at , at , at and at . The colour of novae tends to be around maximum with a dispersion of 016, but two magnitudes below the maximum the colour dispersion decreases, therefore the relation can be used (Warner 1995). The comparison of the given values indicates negligible photometric reddening.
A common spectroscopic method makes use of interstellar absorption lines, which do correlate with the reddening (see, e.g., Kiss et al. 2001, and references therein). Unfortunately, the highly sensitive (Munari & Zwitter 1997) Na I D doublet was observed only in the low-resolution spectra, which had too low resolution for distinguishing narrow interstellar components (if there were any). We have checked all medium-resolution spectra for diffuse interstellar bands (DIBs) from the list of Jenniskens & Désert (1994), but found none. Therefore, the lack of interstellar lines also suggests small reddening.
Another possibility is given by the comparison of the observed and theoretical flux ratios of recombination lines. In our spectra the observed ratio for Balmer lines , which is not far from the dereddened ratios for V443 Sct (see Fig. 6 in Anupama et al. 1992). Although this is only a hint for low reddening, it is consistent with the previous results.
By chance there are two globular clusters, M 70 and NGC 6652, within 1–1.5 degrees of the nova. Both clusters have very low reddening supporting our findings. For NGC 6652, located NW of V4745 Sgr, , while for M 70, located 13 NE of the star, was determined (Dutra & Bica 2000). It appears that despite its low galactic latitude (), V4745 Sgr is located in a low-reddening zone of the Milky Way. The galactic reddening map by Schlegel et al. (1998) infers an upper limit of for the position of the nova.
In summary, if there is any reddening toward V4745 Sgr, it must be in the order of a few hundredths of a magnitude. Consequently, the distance modulus places the nova between 10 to 19 kpc (assuming zero reddening) or 9 to 17 kpc (assuming ) from the Sun. However, the upper limit would imply 3.5 kpc distance from the galactic plane, which is too large for a classical nova. For that reason we prefer smaller distances that would place the nova in the galactic Bulge, just like the very similar transient nova V443 Sct (Anupama et al. 1992).
4.3 The light curve
Further interesting details are provided by the light curve. At first glance, it is apparent that the rebrightenings follow a systematic pattern in the sense that the recurrence time is steadily increasing. To characterize it quantitatively, we have determined all epochs of maxima by fitting low-order polynomials to the selected parts of the light curve and plotted the consecutive recurrence times versus time. As can be seen in Fig. 7, the time interval between successive maxima increases monotonically in time. The diagram shows a quasi-linear trend that is very similar to those of the transient novae GK Per and DK Lac in Figs. 1-2 in Bianchini et al. (1992). Whatever the explanation for this trend is, it shall be accountable for the gradual increase of the recurrence time.

5 Spectroscopic variations and the nature of rebrightenings
5.1 A comparison with V1494 Aql
A comparable spectroscopic coverage of the transition phase was presented by Iijima & Esenoglu (2003) for the fast nova V1494 Aql. Its transition stage started a month after the maximum brightness (Kiss & Thomson 2000), and the mini-outburst amplitudes were only compared to the amplitudes of V4745 Sgr (Fig. 1). Iijima & Esenoglu (2003) reported that high velocity broad emission components appeared in the blue and red sides of H and H lines near the light maximum of a minor outburst. They identified these emissions as the trace of high velocity jets. Similar high velocity jets at H I and He II have been also observed in supersoft X-ray transients (SXTs) (Becker et al. 1998; Crampton et al. 1996). We were unable to identify similar, symmetric emission features in the emission lines of V4745 Sgr, because all of these regions are blended with emissions of other elements (see in Fig. 5).
The main difference between the spectra of V1494 Aql and V4745 Sgr is the absence of P-Cyg profiles in V1494 Aql during minor outbursts. It is possible that this difference is due to the inclination difference between the two systems. V1494 Aql is an eclipsing binary which shows fadings with deep minima (Kato et al. 2004a, and references therein), so that the inclination of the binary system should be close to 90∘. In this case, the jets are directed approximately perpendicularly to the line of sight (if the jets are perpendicular to the orbital plane, which, however, can be a very crude approximation), and we cannot observe the absorbing ejecta (which forms P-Cyg profiles) due to the geometry of the system. On the other hand, for wide range of the unknown inclination of V4745 Sgr, the hypothetical jet may be directed toward us, so we can observe P-Cyg profiles on the blue wings of emission lines, and emissions on the red sides of lines – as we can see in Fig 3b.
X-ray observations of Drake et al. (2003) also point towards a possible connection between the transition phase, jets and the SXTs. The detection of supersoft X-rays for V1494 Aql in August 2000, just after the transition phase, suggests that hydrogen shell burning was still going on the surface of the white dwarf. This fact indicates that hydrogen shell burning took place before, during and after the transition phase, so that it looks plausible to connect different but simultaneous phenomena associated with the nova outburst. However, not every SXT-like nova shows transition phase. One such example is V4743 Sgr, which evolved into the SXT phase in March 2003 (Ness et al. 2003), six months after its outburst, but its visual lightcurve beared no transient phenomena. Unfortunately, we are not aware of any published X-ray observations of V4745 Sgr and further comparison based on X-ray data is not possible – but highly desirable.
5.2 A comparison with previous models
How well do our observations fit the various theoretical models developed for explaining the transition phase? Retter (2002) listed five models offered to the quasi-periodic oscillations during the transition phase: i) oscillations of the common envelope that surrounds the binary system; ii) dwarf-nova outbursts; iii) formation of dust blobs that move in and out of line of sight to the nova; iv) oscillations in the wind; v) stellar oscillations of the hot white dwarf. Retter (2002) invoked the effects of the accretion disc recovery in intermediate polars as an alternative explanation for the oscillations in the transition phase. As was argued by Retter (2002), the explanation by oscillations of the common envelope can be easily rejected as that phase lasts less than 1-2 days. Dwarf nova outbursts can be also ruled out because the accretion discs in very young post-novae are thermally stable (Retter & Naylor 2000; Schreiber et al. 2000).
Shaviv (2001) presented a theory of steady-state super-Eddington winds, which explains the transition phase by the unstable behaviour of the wind in a certain stage after the outburst. However, it is apparent from Figs. 3c and 4 that the spectrum of V4745 Sgr switched back and forth between being early-type nova spectrum and nebular one. A few spectral features (e.g. [OIII] 4959,5007, the broad ‘4640 emission’ blend on the one hand and the Balmer lines, on the other hand) behave very similarly to those of Nova LMC 1998 No. 2 (Sekiguchi et al. 1989), with one important difference: in V4745 Sgr we observed strong P-Cyg profiles with principal-like absorption systems after some period of time (in the mezzanine between the minor outbursts), after the nebular phase has already developed! In our opinion, these switches contradict the assumption of a steady-state wind, and consequently, the applicability of the model by Shaviv (2001).
Retter (2002) pointed out that several transient novae have been classified as intermediate polars (IPs) (i.e. the white dwarf has a moderate magnetic field and thus spins around its axis with a period shorter than the orbital period) and suggested that there might be a link between transient novae and IPs. He proposed that the accretion discs in IPs are fully destroyed in the nova outburst (contrary to other systems, for which observational pieces of evidence for early presence of the disc were found – e.g. Leibowitz et al. 1992, Retter et al. 1997, 1998). The re-establishment of the disc and the subsequent interaction with the magnetosphere of the primary white dwarf can be violent process that may form strong winds in the inner part of the disc. Retter (2002) suggested the oscillations in transition phase could be due to a beating of the rotation of the new accretion disc and the white dwarf magnetic field. The spectroscopic changes in V4745 Sgr support the presence of a violent process, but exclude the possibility of rebrightenings caused by a purely photometric effect. That is why eclipses by dust blobs can also be safely excluded.
Schenker (1999) performed a pulsation instability analysis of envelopes of classical novae and found unstable region that corresponds to the decay phase of novae. This instability is called “strange-mode” (or simply s-mode). Schenker (1999) concluded that static envelope structures with steadily burning white dwarfs are highly unstable to radial pulsations over a wide range of physical parameters. Although the calculated (linear) periods for s-modes are in the order of hours rather than tens of days, the quasi-static treatment in Schenker (1999) limits the direct application to the early stages, which lie in highly non-linear regimes. However, the fast growth rates and emerging photospheric motion in his calculations indicated that such instabilities are likely leading to mass loss (Schenker 2004, personal communication).
Very recently, Cassatella et al. (2004) presented a spectroscopic study of the expanding envelope of V1974 Cyg (a regular fast nova with no transition phase) based on IUE high-resolution spectra. Interestingly, they found evidence for two distinct shell ejections, of which the second one was ejected with a higher velocity, containing significantly less material. Cassatella et al. suggested that the second ejection was a reaction to the first one as follows. After the ejection of the main shell, the envelope is out of balance and will try to restore equilibrium, but if this does not happen immediately (e.g. due to some kind of overshooting), a second, less massive shell might be ejected. Cassatella et al. also pointed out the similarity to the large eruptions of luminous blue variables, where the main eruption is followed by a second one (Humphreys et al. 1999). We might also suggest that similar repetitive processes may have happened in V4745 Sgr, too. The contraction and expansion of the white dwarf envelope would follow the Kelvin-Helmholtz timescale, which can range from several to several tens of days, depending on the thermal energy of the envelope and the luminosity of the given system Hachisu & Kato (2003), being roughly in the same order of magnitude as the timescale of the rebrightenings in V4745 Sgr. Since neither the envelope energy nor the luminosity is known accurately, at this stage we can only point out the possible similarity with the hypothetic scenario in Cassatella et al. (2004).
6 Conclusions
The main conclusions of this paper can be summarized as follows:
-
•
We obtained low- and medium-resolution optical spectra between t=+26 and +296 d, which revealed remarkable spectroscopic changes associated with the secondary rebrightenings. During the optical maxima, the spectrum resembled that of a nova in a very early stage with broad P-Cyg profiles and principal-like absorptions. Between maxima, nebular emissions developed and the spectrum was more evolved. The expansion velocities inferred from the P-Cyg profiles during the minor outbursts follow a monotonic increase.
-
•
We estimated the absolute magnitude in maximum with various MMRD relations. Since the rebrightenings distorted the smooth decline, the decline rates are not well defined, so that the applicability of the MMRD relations is quite limited.
-
•
All spectrophotometric reddening indicators (broadband colours, interstellar absorption lines, DIBs, emission line flux ratios) suggest the interstellar reddening to be negligible ( mag). The nova lies approximately between 9 and 19 kpc, preferably closer to the lower limit (possibly in the Bulge).
-
•
We compared our observational pieces of evidence with those of another recent transient nova, V1494 Aql and various models of the transition phase that can be found in the literature. We did not detect jet emissions like those found in V1494 Aql, which may be due to the different geometry of the system. Of the available models, radial (s-mode) oscillations in the white dwarf envelope seem to be the best explanation, although existing calculations cannot be applied directly to the present case.
Acknowledgements.
This research was supported by the Hungarian OTKA Grants #T034615 and #T042509; the FKFP Grant 0010/2001 and the Australian Research Council. We are grateful to the TACs of the Mount Stromlo and Siding Spring Observatories for allocating telescope time used for this study. We are also grateful to Peter Wood for one extra night on the 2.3 m telescope at SSO, which happened to coincide with the last observed minor outburst. We would like to express our thanks to the referee, Prof. Izumi Hachisu, for his helpful comments.. The NASA ADS Abstract Service and the SIMBAD Astronomical Database was used to access data and references. The computer service of the VSNET group is also acknowledged.References
- Anupama et al. (1992) Anupama, G. C., Duerbeck, H. W., Prabhu, T. P., & Jain, S. K. 1992, A&A, 263, 87
- Ashok & Banerjee (2003) Ashok, N. M. & Banerjee, D. P. K. 2003, in IAUC No. 8132, 1
- Becker et al. (1998) Becker, C. M., Remillard, R. A., Rappaport, S. A., & McClintock, J. E. 1998, ApJ, 506, 880
- Bianchini et al. (1992) Bianchini, A., Friedjung, M., & Brinkmann, W. 1992, A&A, 257, 599
- Brown et al. (2003) Brown, J., Yamamoto, M., Nakano, S., et al. 2003, in IAUC No. 8123, 1
- Capaccioli et al. (1989) Capaccioli, M., Della Valle, M., D‘Onofrio, M., & Rosino, L. 1989, AJ, 97, 1622
- Cassatella et al. (2004) Cassatella, A., Lamers, H. J. G. L. M., Rossi, C., Altamore, A., & González-Riestra, R. 2004, A&A, 420, 571
- Cohen (1985) Cohen, J. G. 1985, ApJ, 292, 90
- Crampton et al. (1996) Crampton, D., Hutchings, J. B., Cowley, A. P., et al. 1996, ApJ, 456, 320
- de Vaucouleurs (1978) de Vaucouleurs, G. 1978, ApJ, 223, 351
- Della Valle & Livio (1995) Della Valle, M. & Livio, M. 1995, ApJ, 452, 704
- Drake et al. (2003) Drake, J. J., Wagner, R. M., Starrfield, S., et al. 2003, ApJ, 584, 448
- Dutra & Bica (2000) Dutra, C. M. & Bica, E. 2000, A&A, 359, 347
- Gill & O’Brien (1999) Gill, C. D. & O’Brien, T. J. 1999, MNRAS, 307, 677
- Gilmore (2003) Gilmore, A. C. 2003, in IAUC No. 8127, 2
- Gilmore & Kilmartin (2003) Gilmore, A. C. & Kilmartin, P. M. 2003, in IAUC No. 8160, 4
- Gilmore et al. (2003) Gilmore, A. C., Kilmartin, P. M., Liller, W., & West, J. D. 2003, in IAUC No. 8132, 3
- Hachisu & Kato (2003) Hachisu, I. & Kato, M. 2003, ApJ, 590, 445
- Humphreys et al. (1999) Humphreys, R. M., Davidson, K., & Smith, N. 1999, PASP, 111, 1124
- Iijima & Esenoglu (2003) Iijima, T. & Esenoglu, H. H. 2003, A&A, 404, 997
- Jenniskens & Désert (1994) Jenniskens, P. & Désert, F.-X. 1994, A&AS, 106, 39
- Kato et al. (2004a) Kato, T., Ishioka, R., Uemura, M., & Starkey, D. R. Krajci, T. 2004a, PASJ, 56, S125
- Kato et al. (2004b) Kato, T., Uemura, M., Ishioka, R., et al. 2004b, PASJ, 56, S1
- Kiss & Jacob (2003) Kiss, L. L. & Jacob, A. 2003, in IAUC No. 8132, 1
- Kiss & Thomson (2000) Kiss, L. L. & Thomson, J. R. 2000, A&A, 355, L9
- Kiss et al. (2001) Kiss, L. L., Thomson, J. R., Ogloza, W., Fűrész, G., & Sziládi, K. 2001, A&A, 366, 858
- Leibowitz et al. (1992) Leibowitz, E. M., Mendelson, H., Mashal, E., Prialnik, D., & Seitter, W. C. 1992, ApJ, 385, L49
- Munari & Zwitter (1997) Munari, U. & Zwitter, T. 1997, A&A, 318, 269
- Ness et al. (2003) Ness, J.-U., Starrfield, S., Burwitz, V., et al. 2003, ApJ, 594, L127
- Retter (2002) Retter, A. 2002, in AIP Conf. Proc. 637: Classical Nova Explosions, ed. M. Hernanz & J. Jose, 279, astro-ph/0208144
- Retter et al. (1998) Retter, A., Leibowitz, E. M., & Kovo-Kariti, O. 1998, MNRAS, 293, 145
- Retter et al. (1997) Retter, A., Leibowitz, E. M., & Ofek, E. O. 1997, MNRAS, 286, 745
- Retter & Naylor (2000) Retter, A. & Naylor, T. 2000, MNRAS, 319, 510
- Rodgers et al. (1988) Rodgers, A. W., Conroy, P., & Bloxham, G. 1988, PASP, 100, 626
- Schenker (1999) Schenker, K. 1999, PhD thesis, Basel University
- Schlegel et al. (1998) Schlegel, D. J., Finkbeiner, D. P., & Davis, M. 1998, ApJ, 500, 525
- Schmidt (1957) Schmidt, T. 1957, Zeitschrift für Astrophysics, 41, 182
- Schreiber et al. (2000) Schreiber, M. R., Gänsicke, B. T., & Cannizzo, J. K. 2000, A&A, 362, 268
- Sekiguchi et al. (1989) Sekiguchi, K., Kilkenny, D., Winkler, H., & Doyle, J. G. 1989, MNRAS, 241, 827
- Shaviv (2001) Shaviv, N. J. 2001, MNRAS, 326, 126
- Warner (1995) Warner, B. 1995, Catalysmic Variable Stars (Cambridge University Press, Cambridge)
- Weaver (1944) Weaver, H. F. 1944, ApJ, 99, 280
- Williams (1992) Williams, R. E. 1992, AJ, 104, 72