Abstract
Bars drive the dynamical evolution of disk galaxies by redistributing mass and angular momentum, and they are ubiquitous in present-day spirals. Early studies of the Hubble Deep Field reported a dramatic decline in the rest-frame optical bar fraction to below 5% at redshifts 0.7, implying that disks at these epochs are fundamentally different from present-day spirals. The GEMS bar project, based on 8,300 galaxies with -based morphologies and accurate redshifts over the range 0.2–1.1, aims at constraining the evolution and impact of bars over the last 8 Gyr. We present early results indicating that remains constant at 30% over 0.2–1.1, corresponding to lookback times of 2.5–8 Gyr. The bars detected at 0.6 are primarily strong with ellipticities of 0.4–0.8. Remarkably, the bar fraction and range of bar sizes observed at 0.6, appear to be comparable to the values measured in the local Universe for bars of corresponding strengths. Implications for bar evolution models are discussed.
keywords:
Galaxy Evolution,, Bars, Dynamics, Galaxy Surveys[Evolution and Impact of Bars over the last 8 Gyr:
Early Results from GEMS]
Evolution and Impact of Bars over the
Last Eight Billion Years: Early Results from GEMS
1 Open issues in bar-driven galaxy evolution
Large-scale bars are ubiquitous in present-day spirals, with reported optical bar fractions of 30 % for both strong and weak bars (e.g., Eskridge et al. 2002aa, hereafter ES02; 3). Such bars can drive the dynamical evolution of disk galaxies by redistributing mass and angular momentum. In particular, they are believed to efficiently drive gas from the outer disk of galaxies into the inner kpc via gravitational torques. There is mounting observational evidence for bar-driven gas inflow. Observations of cold or ionized gas velocity fields show evidence for shocks and non-circular motions along the large-scale stellar bar (e.g., Regan, Vogel, & Teuben 1997). Barred galaxies show shallower metallicity gradients across their galactic disks than unbarred ones (Martin & Roy 1994). CO(=1–0) interferometric surveys show that, on average, the molecular gas central concentration in the inner kpc is higher in barred than in unbarred galaxies (Sakamoto et al. 1999). Once gas reaches the central regions of bars and builds up large densities comparable to the Toomre critical density for the onset of gravitational instabilities, intense starbursts are triggered (Jogee et al. 2004a). The frequency of large-scale stellar bars is in fact significantly higher in starburst galaxies than in normal galaxies (Hawarden et al. 96; Hunt & Malkan 99), while the question of whether Seyferts have an excess of large-scale bars remains under investigation (Regan et al. 1997; Knapen et al. 2000; Laurikainen et al. 2004). Although bars in the local Universe are fairly well studied, several fundamental aspects of bar-driven galaxy evolution remain open:
-
•
When and how did bars form? Are they a recent (z0.7) phenomenon or were they abundant 10 Gyr ago? Two conflicting results have been reported to date. Abraham et al. (1999) claim a dramatic decline in the rest-frame optical bar fraction () at 0.7, based on WFPC2 images of a small sample of 50 moderately inclined spirals in the Hubble Deep Field (HDF). They find drops from 24% at 0.2–0.6 to below 5% at 0.7. A second study (Sheth et al. 2003), based on NICMOS images of the HDF, report an observed bar fraction of 5% at 0.7–1.1. Out of 95 galaxies in this redshift interval, they find four large bars with a mean semi-major axis of 12 kpc (). Since NICMOS has a large effective PSF, this study fails to detect smaller bars which, at least locally, constitutes the majority of bars (see 3). The authors argue that their observed bar fraction of 5% at 0.7 is at least comparable to the local fraction of large (12 kpc) bars, and thus, by extrapolation, the overall optical bar fraction over all bar sizes (1.5-15 kpc) probably does not decline at 0.7. This conclusion suffers from small number statistics and relies heavily on the extrapolation over bar sizes.
-
•
Are bars long-lived or do they dissolve and reform over a Hubble time? Early studies (e.g., Hasan & Norman 1990; Norman, Sellwood, & Hasan 1996) proposed that once a large central mass concentration (CMC) builds up in the inner 100 pc of a galaxy, for instance via bar-driven gas inflow, it will destroy or weaken the bar by inducing chaotic orbits and reducing bar-supporting orbits. Subsequently, Athanassoula (2002) found that in simulations with live halos, bars are more difficult to destroy due to resonant angular momentum exchange. Shen & Sellwood (2004) find that in purely stellar -body simulations, the bar is quite robust to CMCs. Furthermore, after a bar is destroyed by a CMC, the disk left behind is dynamically hot, and does not readily reform a new bar unless it is cooled significantly. Recently, Bournaud & Combes (2002) proposed that bars are destroyed primarily due to the reciprocal torques of gas on the stars in the bar (rather than by the CMC per se). In their models, bars can dissolve and reform recurrently over timescales 3–4 Gyr, provided the galaxy accretes sufficient cold gas over a Hubble time.
-
•
Bar-driven evolutionary scenarios purport that bars may transform late-type spirals into intermediate types (e.g., Scd to Sbc) via gas inflows which build pseudo-bulges, and via bending instabilities (e.g., Sellwood 1993) or vertical ILRs (e.g., Combes et al. 1990) which drive stars to large scale height into a bulge-like configuration. At intermediate redshifts, Katz & Weinberg (2002) suggest bars can solve the dark matter halo cusp-core controversy. While there is a wealth of circumstantial evidence (see review by Kormendy & Kennicutt 2004) consistent with bar-driven secular evolution, no systematic tests of this picture have been made either at local or intermediate redshifts.
Using 8,300 galaxies with superb images and accurate redshifts over 0.2–1.1 (corresponding to lookback times of 2.5–8 Gyr) from the Galaxy Evolution from Morphologies and SEDs (GEMS;Rix et al. 2004; 2) survey, we have started a comprehensive study of the properties (fractions, sizes, strengths) of bars as a function of redshift, and host galaxy properties. The GEMS bar project will constrain how bars evolve and impact the structural evolution of galaxies over the last 8 Gyr, with the eventual goal of resolving some of the above open issues. We describe here our methodology, early results, and upcoming highlights. These findings are described in more detail in Jogee et al. 2004b. We assume a flat cosmology with and a Hubble constant = 70 km s-1 Mpc-1 throughout this paper.
2 Imaging and Characterization Bars out to 1
![[Uncaptioned image]](/html/astro-ph/0408267/assets/x1.png)
a Identification and characterization of bars at intermediate redshifts – The left panel shows the GEMS image of a galaxy at 0.5 (lookback time 5 Gyr) with a bar, prominent spiral arms, and a disk. The right panel show the same image with an overlay of the fitted isophotes. The latter clearly trace the bar, spirals, and outer disk.
captions,lettered
![[Uncaptioned image]](/html/astro-ph/0408267/assets/x2.png)
b Identification and characterization of bars at intermediate redshifts – The radial plots of the surface brightness (top), ellipticity (middle), and PA (bottom) generated by the isophotal fits in the previous figure are shown. The bar with a semi-major axis causes to rise smoothly to a maximum, while the PA has a plateau over the region dominated by the orbits. At larger , beyond the bar end, drops sharply. The spiral arms lead to a twist in PA and varying , and subsequently, the disk dominates.
captions,lettered
GEMS (Rix et al. 2004) is a two-color (F606W and F850LP) imaging survey with the Advanced Camera for Surveys (ACS) of a large-area (800 arcmin2 or ) field centered on the Deep Field South (CDF-S). The limiting 5 depth for compact sources is mAB(F606W)=28.3 and mAB(F850LP)=27.1. ACS imaging from the GOODS project (Giavalisco et al. 2004) is used in the central quarter field. GEMS provides morphologies for galaxies in the redshift range 0.2–1.1 where SEDs and accurate redshifts (/(1 + ) 0.02) down to = 24 exist from the COMBO-17 project (Wolf et al. 2003). The dataset are further enhanced by panchromatic , , and ground-based observations covering the X-rays to the far-IR and radio.
The GEMS ACS dataset offer many advantages for studying bars, compared to earlier WFPC2/NIC3 imaging surveys. The dataset provide a factor of 100 improvement in number statistics, an effective ACS PSF which is 2–3 times better than the WFCP2 and NIC3 PSFs, and redder wavelength coverage and sensitivity via the ACS F850LP filter/CCD combination. The superior PSF allows us to probe bars down to small sizes ( or 1 kpc; see 3). Finally, the large area ( HDF area) coverage reduces the effect of cosmic variance.
We identify and characterize bars out to 1.1 by performing isophotal analyses of the F606W (-band) and F850LP (-band) images using an automated iterative version of of the IRAF STSDAS “ellipse” routine. Isophotal fits are a good guide to the underlying orbital structure of a galaxy and provide a robust way of identifying and characterizing bars (e.g., Wozniak et al. 1995; Jogee et al. 2002). A bar is identified by its characteristic signature in the radial profiles of ellipticity (), surface brightness, and position angle (PA), as illustrated in Figs. 1a and 1b. The ellipticity is required to rise smoothly to a global maximum above 0.25 while the PA has a plateau over the region dominated by the orbits, followed by a drop 0.1 in as the bar-to-disk transition occurs. The ellipticity, PA, and semi-major axis for both the bar and outer disk can be identified from these profiles, thereby allowing the profiles to be subsequently deprojected to derive the intrinsic bar strength and size. We also use the disk ellipticity and inferred inclination to reject all galaxies with , since morphological classification is unreliable in highly inclined galaxies.
3 Early Results and Future Highlights
We use two approaches to characterize the optical bar fraction . The first is to identify bars in the reddest observed band (F850LP) at all redshifts, with the idea that redder wavelengths are less impacted by extinction, and consequently better trace the old stellar potential. The disadvantage of this method is that different, increasingly bluer rest-frame bands are then traced in the two redshift bins of interest (0.240.65 and 0.651.1) as illustrated in Table 1a. A complementary approach, illustrated in Table 1b, is to use both F606W and F850LP images in order to work in a fixed rest-frame band (/) and avoid significant bandpass shifting.
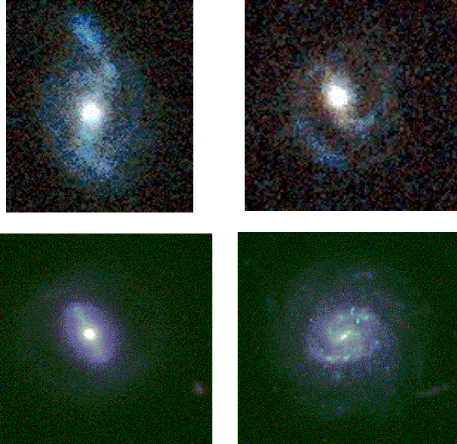
We present early results based on a subsample of 600 galaxies distributed in the overlap area of GEMS and GOODS. Figure 2 illustrates examples of intermediate redshift galaxies with bars and spiral arms in this sample. While being only a small fraction of the total GEMS dataset, this sample is 3–6 times larger than previous WFPC2 and NIC3 samples used to study bars in the HDF. An inclination cutoff of and a magnitude cutoff of mag are imposed in order to ensure accurate photometric redshifts, spectral typing, and reliable morphological analyses. Galaxies were assigned E/S0 and (spiral+ starburst) types based on comparing their rest frame colors and absolute magnitudes with template SEDs from Kinney et al (1996) and Coleman, Wu, & Weedman (1980). We imposed an absolute magnitude cutoff of -19. The rest-frame optical bar fraction in a given redshift bin was taken as (/), where is the number of bars detected, and is the number of spirals and starbursts. An alternative approach involves using the single fit Sersic index to identify disk galaxies as the main contributor to . Our exciting result, based on the first method, are highlighted below:
-
•
We find that the rest-frame optical bar fraction remains constant at 30% over 0.2–1.1 or lookback times of 2.5–9 Gyr. In particular, we do not find evidence of a dramatic decline in to below 5% at . This result holds whether we choose to use the reddest observed band (F850LP) in both redshift bins (Table 1a), or choose to work in the same fixed rest-frame band (Table 1b). To further test the robustness of the results, we repeated the analyses treating the spiral and starburst types separately, and found no change. We also performed an extra-consistency check by using the F606W images over the 0.651.1 interval to estimate the bar fraction () in the rest-frame UV. Strong bars are not expected to be delineated by recent massive SF as the strong shocks on their leading edges are not conducive to SF. As expected, the estimated is much lower (5%) than . The results on , therefore, seem quite robust. Analyses of a smaller sample of ACS images of the tadpole field is leading to similar conclusions (Elmegreen et al. 2004)
\sidebyside\letteredcaptiona Optical bar fraction in the reddest available filter (F850LP) \sphlineRedshift 0.240.65 0.651.1 \sphlineFilter F850LP F850LP \sphlineRest-frame / / \sphlineBar Fraction 33% 34% \sphline \letteredcaptionb Optical bar fraction in a fixed rest-frame () \sphlineRedshift 0.240.65 0.651.1 \sphlineFilter F606W F850LP \sphlineRest-frame / / \sphlineBar Fraction 25% 34% \sphline
-
•
What kind of bars are we detecting at ? The bars at 0.6–1.3 have semi-major axes – and 1.6–14 kpc, and it is noteworthy that the majority of these bars have below and 5 kpc, and would consequently be hard to detect without the superb resolution of ACS. The bars have rest-frame -band ellipticities in the range 0.4–0.8 and the majority have (Fig. 3). The detected bars are thus strong bars. The fact that we not identify weak (0.25 0.4) bars at 0.6–1.1 (Fig. 3) could lend itself to several interpretations. One possibility is that bars at 1 were on average stronger than local ones (e.g., Bournaud & Combes 2002). Another possibility is that cosmological dimming, loss of spatial resolution, and the potentially heavy impact of dust and SF at increasing redshifts make it harder to detect such weak bars. In order to quantify these effects we are artificially redshifting local galaxies out to 1.1 in rest-frame -band, assuming the current cosmology du jour, and folding in the ACS and GEMS survey parameters. Weak short bars are indeed hard to detect, but the exact effect of their non-detectability on the overall fraction is not yet fully quantified.
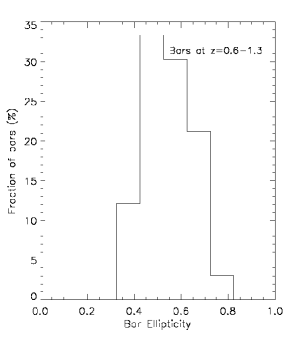
Figure 2: Bars strengths – The distribution of bar strengths (ellipticities ) in the rest-frame / is shown for bars at 0.6–1.1, over lookback times of 6–8 Gyr. -
•
How do the bars at compare to local ones? Since carefully defined, large volume-limited samples of barred galaxies for comparison at do not yet exist, we choose to compare the bars to the local Ohio State University (OSU) sample of bright galaxies (Table 2; ES02) It is remarkable to note that strong ( =0.4–0.8) bars which were in place 6–8 Gyr ago, and those at current epochs, have a similar rest-frame optical bar fraction (Table 1b and 2) and a similar bar size distribution (Fig. 4). The simplest naive interpretation of these results is that bars are long-lived over timescales 6 Gyr, and possibly over a Hubble time. However, we withhold any definite conclusions until we have compared the normalized bar sizes (i.e., the ratio of bar size to disk size) at these two epochs, and until we have increased our sample sufficiently so that the data can be binned over 1 Gyr interval over the last 9 Gyr.
Table 1: Local bar fractions in the optical () and near-IR () based on the OSU sample Strong Weak Strong+Weak No Bars Bars Bars Bars in -band using RC3 bar strength a 37% 34% 67% 33% in -band using bar ellipticity b 33% 28% 61% 39% in -band using bar ellipticityc 49% 21% 70% 30% {tablenotes}Notes to table — The local bar fractions in this table are based on the OSU sample, after excluding all galaxies with inclination 60 ∘. The bar fractions shown here are from ES02 who use the RC3 classes of SB, SAB, and SA for “strong bars” , “weak bars”, and “no bars”; The bar fractions shown here assume a -band bar ellipticity 0.4 to define strong bars, and 0.25 0.4 for weak bars; The bar fractions shown here assume an -band bar ellipticity 0.4 to define strong bars.
\inxxcaptions,table
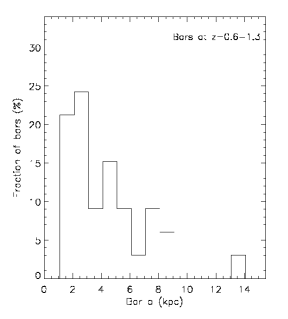
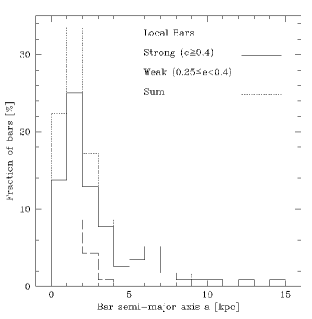
Figure 3: Distribution of bars sizes 6–8 Gyr ago compared to the present epoch – The distribution of bar semi-major axes in rest-frame / is shown for bars at 0.6–1.1 (lookback times of 6–8 Gyr) in the GEMS survey. Note that most bars have 5 kpc ( at 0.9) and would be difficult to detect without the exquisite resolution of ACS. Ditto, but for local bars in the OSU sample after excluding inclined galaxies with . The distribution is shown for strong ( 0.4; solid line) and weak (0.25 0.4; hashed line) local bars. The strong local bars are directly comparable to the bars detected at 0.6–1.1, as the latter have ellipticities 0.4. There is a striking similarity in the size distribution of strong bars at the present epoch and 6–9 Gyr ago. -
•
Concluding remarks: In recent years, a fundamental puzzle was whether the bar fraction shows a dramatic decline at 0.6. Mounting evidence (Jogee et al. 2004b, Elmegreen et al. 2004, Sheth et al. 2003) now suggests this is not the case. The emphasis should now be to push investigations beyond mere estimates of bar fractions. The next challenge is to distinguish between the two main bar evolution scenarios: long-lived bars over a Hubble time versus models of recurrent destruction/reformation of bars (e.g., Bournaud & Combes 2002). In order to attack this problem, we plan a systematic comparison of the properties of bars (strength, normalized sizes) and host galaxies (central mass concentration, /, masses), over each Gyr interval out to lookback times of 9 Gyr. Another important area to explore is the relationship of bars to starburst and AGN activity out to 1, since the cosmic density of both types of activity show a dramatic increase from =0 to 1. The combination of GEMS ACS imaging, observations, and inflowing data makes these timely issues to address, and hold the promise of exciting science ahead.
Acknowledgements.
SJ acknowledges support from the National Aeronautics and Space Administration (NASA) under LTSA Grant NAG5-13063 issued through the Office of Space Science, and thanks Paul Eskridge for kindly providing images and parameters for galaxies in the OSU survey.1
References
- [1] Abraham, R. G., Merrifield, M. R., Ellis, R. S., Tanvir, N. R., & Brinchmann, J. 1999, MNRAS, 308, 569
- [] Athanassoula, E. 2002, ApJL, 569, L83
- [2] Bournaud, F. & Combes, F. 2002, A&A, 392, 83
- [3] Coleman, G. D., Wu, C.-C., Weedman, D. W. 1980, ApJS, 43, 393
- [4] Elmegreen, B. G., et al. 2004, ApJ, submitted
- [5] Eskridge, P. B., et al. 2002, ApJS, 143, 73
- [6] Giavalisco, M., et al. 2004, ApJL, 600, L93
- [7] Hasan, H. & Norman, C. 1990, ApJ, 361, 69
- [8] Hawarden, T. G., et al. 1986, MNRAS, 221, 41
- [9] Hunt, L. K. & Malkan, M. A. 1999, ApJ, 516, 660
- [10] Jogee, S., Knapen, J. H., Laine, S., Shlosman, I., Scoville, N. Z., & Englmaier, P. 2002, ApJL, 570, L55
- [11] Jogee, S., Scoville, N. Z., & Kenney, J. 2004a, ApJ, in press
- [12] Jogee, S., Barazza, F., Rix, H.-W., et al. 2004b, ApJL, submitted
- [13] Kinney, A.L., Calzetti, D., Bohlin, R.C., McQuade, K., Storchi-Bergmann, T., Schmitt, H.R. 1996, ApJ, 467, 38
- [14] Knapen, J. H., Shlosman, I., & Peletier, R. F. 2000, ApJ, 529, 93
- [15] Kormendy, J. & Kennicutt, R. C. 2004, ARAA, submitted.
- [16] Kinney, A.L., Calzetti, D., Bohlin, R.C., McQuade, K., Storchi-Bergmann, T., Schmitt, H.R. 1996, ApJ, 467, 38
- [17] Laurikainen, E., Salo, H., & Rautiainen, P. 2002, MNRAS, 331, 880
- [18] Martin, P. & Roy, J. 1994, ApJ, 424, 599
- [19] Norman, C. A., Sellwood, J. A., & Hasan, H. 1996, ApJ, 462, 114
- [20] Regan, M. W., Vogel, S. N., & Teuben, P. J. 1997, ApJL, 482, L143
- [21] Rix, H., et al. 2004, ApJS, 152, 163
- [22] Sakamoto, K., Okumura, S. K., Ishizuki, S., & Scoville, N. Z. 1999, ApJ, 525, 691
- [23] Shen, J. & Sellwood, J. A. 2004, ApJ, 604, 614
- [24] Sheth, K., Regan, M. W., Scoville, N. Z., & Strubbe, L. E. 2003, ApJL, 592, L13
- [25] Weinberg, M. D. & Katz, N. 2002, ApJ, 580, 627
- [26] Wolf, C., Meisenheimer, K., Rix, H.-W., Borch, A., Dye, S., & Kleinheinrich, M. 2003a, A&A, 401, 73
- [27] Wozniak, H., Friedli, D., Martinet, L., Martin, P., & Bratschi, P. 1995, A&A Suppl., 111, 115