Precise Localization of the Soft Gamma Repeater SGR 162741 and the Anomalous X-ray Pulsar AXP 1E1841045 with Chandra
Abstract
We present precise localizations of AXP 1E1841045 and SGR 162741 with Chandra. We obtained new infrared observations of SGR 162741 and reanalyzed archival observations of AXP 1E1841045 in order to refine their positions and search for infrared counterparts. A faint source is detected inside the error circle of AXP 1E1841045. In the case of SGR 162741, several sources are located within the error radius of the X-ray position and we discuss the likelihood of one of them being the counterpart. We compare the properties of our candidates to those of other known AXP and SGR counterparts. We find that the counterpart candidates for SGR 162741 and SGR 180620 would have to be intrinsically much brighter than AXPs to have detectable counterparts with the observational limits currently available for these sources. To confirm the reported counterpart of SGR 180620, we obtained new IR observations during the July 2003 burst activation of the source. No brightening of the suggested counterpart is detected, implying that the counterpart of SGR 180620 remains yet to be identified.
1 Introduction
Soft Gamma Repeaters (SGRs) are sources of brief intense outbursts of low-energy -rays. Three of the four known SGRs were discovered in 1979 (e.g. Mazets, Golenetskij, & Guryan 1979; Mazets et al. 1979). The fourth, SGR 162741, was discovered in 1998 (Kouveliotou et al., 1998b); a possible fifth source, SGR 180123, has not yet been confirmed (Cline et al., 2000). SGRs were recognized as a class of high-energy transients, distinct from the “classical” -ray bursts (GRBs) in 1987, on the basis of their burst recurring episodes, relatively soft -ray spectra, and very short burst durations (typically s). All SGRs are sources of persistent low-energy X-ray emission, with luminosities in the erg s-1 range, although SGR burst peak luminosities reach super-Eddington values between and erg -1 (see Kouveliotou 2004 for a review of the properties of SGRs).
The cumulative SGR properties point towards young neutron stars as the sources of their outburst emission, an idea which arose early with the detection of cycles of 8 s periodic hard X-ray flux oscillations following the March 5, 1979 event from SGR 052666 (Mazets et al., 1979). The subsequent discovery of periodic pulsations in the steady X-ray flux of SGRs 180620 and 190014, at and 5.16 s, respectively, confirmed the neutron star nature of these sources (Kouveliotou et al. 1998a; Guidorzi et al. 2001; Hurley et al. 1999b). Moreover, the measurement of the secular increase of these periods (Kouveliotou et al. 1998a, 1999), on a very short time scale years, argues that the rapid spin-down observed for both SGRs is caused by angular momentum loss from a highly magnetized ( Gauss) neutron star, a ‘magnetar’. The magnetar model was developed in the early 1990’s by R. Duncan and C. Thompson (Duncan & Thompson 1992; Thompson & Duncan 1995, 1996).
There is another rare subset of neutron star sources, the Anomalous X-Ray Pulsars (AXPs), with properties very similar to SGRs, except for their bursting activity, which had not until recently been detected. However, detections of SGR like burst emission from AXPs (Kaspi et al. 2003, Gavril et al. 2003) now indicate that these objects might previously have been observed simply at different phases of an SGR life cycle. There are 6 AXPs known to date. The sky distribution of SGRs (three on the Galactic Plane, the fourth in the Large Magellanic Cloud) and AXPs (5 in the Galactic plane and one in the Small Magellanic Cloud) also indicates that magnetars may be a young source population. Further, recent observations of SGR 052666, 180620, and have revealed a cluster of massive stars several arcseconds away from each SGR source, pointing to a potential massive star progenitor for SGRs (Fuchs et al. 1999; Vrba et al. 2000; Corbel & Eikenberry 2003; Klose et al. 2004). This embryonic association could be strengthened with deep IR observations of additional precise source positions.
SGR 162741 was discovered with BATSE on CGRO on 15 June 1998 (Kouveliotou et al., 1998b); the source emitted over 100 bursts until early August 1998 (Woods et al., 1999). No further burst emission has been observed up to date (March 2004). Shortly after its discovery, an IPN/RXTE/BATSE error box was constructed which crossed the Galactic Plane (Smith, Bradt, & Levine, 1999). This was later refined to a 1.8 degree by 16 arcsecond IPN error box (Hurley et al., 1999a). A search through the SNR catalog of Whiteoak & Green (1996) revealed a single SNR consistent with the IPN error box, G 337.00.1. A BeppoSAX Narrow Field Instrument (NFI) observation of the SNR region resulted in the discovery of the X-ray counterpart to the source, SAX J1635.84736, at and (J2000) with an error circle of radius 1′ (95% confidence level) (Woods et al., 1999).
AXP 1E1841045 was detected with the Einstein HRI as an X-ray point source at the center of the supernova remnant Kes 73 (Kriss, Becker, Helfand, & Canizares, 1985). A refined position of the central source was derived using ROSAT HRI data (Helfand, Becker, Hawkins, & White, 1994). Subsequent observations of this source with ASCA revealed pulsed X-ray emission with a spin period, and period derivative of s and s-1, respectively (Vasisht & Gotthelf, 1997). The equivalent dipolar magnetic field and pulsar spin–down age corresponding to these values are G and yrs, which together with its spectral properties, classified the source as an AXP. Kes 73 is a shell-type radio SNR with no evidence of a plerionic core; its kinematic distance has been determined to be between 6 and 7.5 kpc, using H I absorption data with the VLA (Sanbonmatsu & Helfand, 1992). Although the SNR had been observed with ROSAT, ASCA, and BeppoSAX (Helfand, Becker, Hawkins, & White 1994; Vasisht & Gotthelf 1997; Gotthelf et al. 2002), the AXP was not located with sufficient accuracy to allow the determination of a reliable optical or IR counterpart.
We report here refined source locations for SGR 162741 and AXP 1E1841045 with an accuracy of and , respectively, obtained with the Chandra X-Ray Observatory (CXO). In Section 3 we describe our search for an infrared (IR) counterpart of the sources and in Section 5 we compare and discuss our results to the existing detections and limits of other magnetar infrared and optical observations in the literature.
2 Observations
2.1 X-rays
2.1.1 SGR 162741
We observed SGR 162741 with CXO on 2001 September 30 (ObsId 1981) for 48.9 ksec and on 2003 March 24 (ObsId 3877) for 25.7 ksec using the Advanced CCD Imaging Spectrometer (ACIS). The observations and majority of the data reduction are discussed in detail in Kouveliotou et al. (2003). CIAO v2.3 and CALDB v2.21 were used in all data analysis and processing tasks. Since the second observation was taken in Very Faint Mode, we were able to utilize the 55 pixel event island to further reduce the ACIS quiescent background (using acis_process_events). To avoid detection of spurious faint sources, we removed residual charge from cosmic ray events and corrected for the flaw in the serial readout in CCD ACIS-S4 using acis_detect_afterglow and destreak. Finally, we removed the pixel randomization which was applied during standard processing.
To improve the source position accuracy we removed systematic shifts in the coordinate systems of the two event lists by shifting their aspect solutions until they were consistent with each other, as described below. We first applied the recommended aspect offsets222http://cxc.harvard.edu/cal/ASPECT/ for each observation, we then created two images ( keV), and used wavdetect to identify all X-ray sources within 2.2′ of SGR 162741 in each image. We found 5 sources at the same position (within ) in each image, which we used to calculate a mean shift between the two observations of ″ and . The shift was then applied to the second observation data using dmtcalc and reproject_events. Finally, we merged the images with dmmerge. Following this process we were able to derive source positions with ACIS-S with an error radius of ″ (90% uncertainty)2.
2.1.2 AXP 1E1841045
A 29.6 ksec ACIS observation of AXP 1E1841045 was retrieved from the Chandra archive (ObsId 729) and processed in a similar manner to the observations of SGR 162741. The search for point sources in this data set is hindered by the presence of the X-ray bright supernova remnant Kes 73. After application of the recommended aspect offsets, the position of the central source was determined via a two-dimensional Gaussian fit. The central portion of the data is piled up, but this should not adversely affect the determination of the centroid. Since we want to improve the overall astrometric accuracy through comparison between X-ray and IR source positions (see Section 3), we also searched for additional fainter point sources between keV excluding a circular region of 2′ radius centered on the AXP to avoid the SNR Kes 73 contribution. This resulted in 26 sources within a 2′-6′ annulus, choosing a S/N threshold of 2.6.
2.2 Infrared
2.2.1 SGR 162741
Infrared imaging of the field of SGR 162741 was obtained on 2001 March 6 with the CTIO 1.5m telescope and OSIRIS and again on 2001 March 17 with the CTIO 4m telescope and OSIRIS. The number of images acquired, exposure times and coadds are listed in Table 1. The pixel scale and field of view (FOV) are 0.461″ pixel-1, 266″ 266″ and 0.161″ pixel-1, 93″93″ for the 1.5m and 4m observations, respectively. Both sets of data were reduced in the same manner using IRAF. First, we created a median filtered sky image for each photometric band. This normalized sky was subsequently scaled to the median sky value of each individual frame and subtracted. Flatfielding was achieved with dome flats. Finally, the images in each filter were shifted and added, resulting in one combined image per filter for both the 1.5 and 4m data.
PSF fitting photometry was performed on all of the combined frames with DAOPHOT II (Stetson, 1992). Since we did not obtain standard star observations on the nights of the observations, we derived photometric solutions for our data utilizing the 2MASS All Sky Data Release333http://www.ipac.caltech.edu/2mass/ (Skrutskie, 2001) magnitudes for the stars in our field. This proved somewhat difficult due to the limited spatial resolution of the 2MASS data in these crowded fields and the fact that most of the bright sources with the best photometric measurements in 2MASS are saturated in our images, particularly those obtained on the 4m telescope. The systematic error from the photometric transformation is 0.08 mag for the 4m and 0.06 mag for the 1.5m data. Limiting magnitudes for source detection are 18.0, 18.0, 17.0 for the 1.5m data and 21.5, 19.5, 20.0 for the 4m data.
We derived an astrometric solution for both the 1.5m and 4m frames through comparison to the corresponding 2MASS images and utilizing the IRAF task “ccmap”. A total of 75 matched stars were used for the 1.5m images, with a residual in the fit of 0.06″ in each coordinate. For the 4m images, a total of 43 matched stars (due to the smaller FOV) resulted in fit residuals of 0.06″ in each coordinate.
2.2.2 AXP 1E1841045
IR data of the field of AXP 1E1841045 were retrieved from the ESO archive. Two sets of observations with NTT/SOFI are listed in the archive, 69.D.0339 and 63.H-0511. We present here only data from 69.D.0339 (see Table 1 for details) since the observations from 63.H-0511 have already been discussed in detail by Mereghetti et al. (2001). SOFI was used in large field mode with a pixel scale of 0.290″ pixel-1 and a FOV of 5′ 5′. The seeing was 0.8″. The data were reduced in an analogous manner to those of SGR 162741. An astrometric solution was again derived through comparison with 2MASS images, matching 107 stars with a residual fit of 0.06″ in each coordinate. We also calculated standardized magnitudes through comparison to 2MASS. Since we only have band data, color terms have been neglected in the transformation. The systematic error from the fit is 0.05 mag. Our calibrated magnitudes for the stars listed in Mereghetti et al. (2001) are provided in Table 2. Unfortunately, Mereghetti et al. (2001) do not provide uncertainties for their magnitudes, so a comparison of the photometric results is difficult. Assuming comparable photometric errors to those in our data set, most star measurements agree within the combined uncertainties. A few stars however, deviate substantially. We consider a difference of mag between the two measurements to be significant and all of the relevant stars are marked with a * in Table 2. In order to investigate these discrepancies, we reanalyzed the band data set used by Mereghetti et al. (2001). We performed PSF fitting photometry and calculated standardized magnitudes through comparison to 2MASS, neglecting any color terms. The resulting measurements are also listed in Table 2. In most cases, these redetermined magnitudes agree well with our measurements based on data set 69.D.0339 (within the uncertainties). Star U is affected by a bad pixel in the Mereghetti data set. The data for star 14, 16, 17, and 22 confirm our results. Some of the very faint sources did not converge in our PSF fitting procedure (V, 21, 23). Note, however, that we determine for the bright star immediately to the east of star 21, in good agreement with the magnitude listed by Mereghetti et al. (2001). Hence the discrepancy in the photometry for star 21 is simply due to the consideration of different sources.
3 Astrometry
3.1 SGR 162741
To further improve the SGR 162741 source position accuracy, we searched our combined image of both CXO observations for X-ray sources using the source-finding method described in Swartz et al. (2003). We detected a total of 76 X-ray sources, accepting as detections a signal to noise ratio of 2.6. To determine any systematic offsets between our X-ray and IR astrometric frames, we searched the 2MASS All Sky Catalog for positional matches to these 76 X-ray sources within a radius of 2″ around each source. We found 34 matches, but only considered the 24 sources within 6′ centered on SGR 162741 for our offset calculation, to avoid positional uncertainties introduced by the distortion of the off–center X-ray point spread function (PSF). The positions of these 24 X-ray sources and the offsets from their corresponding 2MASS counterparts are provided in Table 3. For completeness, we also list the positions of all 76 detected X-ray sources in Table 4 along with any 2MASS counterparts, as well as photometric data from 2MASS or our 1.5m and 4m images. Table 4 is provided in its entirety only in the electronic version of the Journal. After rejection of the largest outliers in the measured offsets (), we derive an average offset of 0.364″() and ″() for the remaining 19 sources. We also used the same matched set of positions to compute a full geometric image transformation (including shifts, scaling and rotation) between the X-ray and IR images. The resulting best positions for SGR 162741 are 16:35:51.828 47:35:23.35 (average shift) and 16:35:51.844 47:35:23.31 (full transformation) in J2000 coordinates with a 1 error of 0.2″ in each coordinate. Both positions lie well within the IPN error box for SGR 162741 (Hurley et al., 1999a) and are also consistent with the positions of the BeppoSAX and ASCA X-ray sources (Woods et al., 1999; Hurley, 2000). We are therefore confident that we have identified the X-ray counterpart of SGR 162741.
3.2 AXP 1E1841045
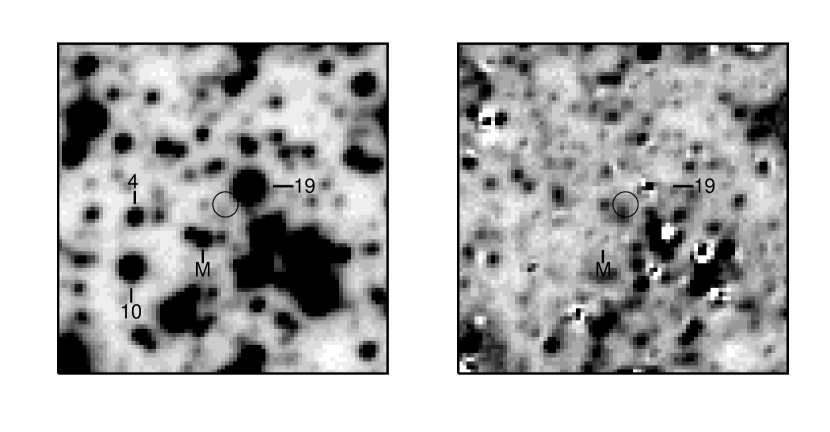
Our initial best Chandra position for AXP 1E1841045 is RA = 18:41:19.336, DEC = 04:56:10.83 (J2000). We detected 26 sources in the 2-6′ annulus around the central position of AXP 1E1841045 above a S/N threshold of 2.6. As for SGR 162741, we searched for matches with 2MASS sources and found 8 sources within 2″ of their corresponding X-ray positions. After excluding any blended sources (based on the higher resolution ESO images) we are left with the 5 sources listed in Table 5. In this case, the number of matched sources is insufficient to derive a full astrometric transformation between the X-ray and IR frames. Consequently, we only calculated median offsets arriving at RA=0.10″ and DEC=0.33″. Including this offset, our final best position of AXP 1E1841045 is RA = 18:41:19.343, DEC = 04:56:11.16 (J2000) with a 1 error of 0.3″ in each coordinate. The left panel of Figure 1 shows our final AXP 1E1841045 CXO position with a 3 0.9″ error radius overlaid on the ESO band image (23″ 23″). North is up, east to the left. A few stars are numbered according to the convention used in Mereghetti et al. (2001) to facilitate comparison between the two finding charts.
Star 19, the “promising candidate” identified by Mereghetti et al. (2001) appears to be excluded by our refined X-ray position. Instead, a very faint source is visible inside the error circle. After PSF subtraction of the brighter stars in the field (right panel of Figure 1), this faint source appears to be a blend of at least two sources. PSF fitting photometry proved difficult. Our best fit consists of a brighter southern source () and a fainter northern source near the detection limit of the observations (). If AXP 1E1841045 is associated with the SNR Kes 73, the distance to the source is 6–7.5 kpc (Sanbonmatsu & Helfand, 1992). Morii, Sato, Kataoka, & Kawai (2003) determined cm-2 from the Chandra data which translates into =14.2 using the relationship by Predehl & Schmitt (1995). This results in and for the brighter and fainter source, respectively. Based on these dereddened magnitudes, it is unlikely that the brighter source (which is also further away from the center of the error circle) is a viable counterpart candidate as it would make it the brightest known counterpart by almost a magnitude (for a detailed comparison of the AXP counterpart candidates see Section 5). The fainter source, however, is promising. Unfortunately, the archival observation we analyzed only contains band data which prevents us from investigating the color of the candidate. An IR color-magnitude diagram for this field has been presented in Mereghetti et al. (2001), however, those data do not go deep enough in to determine the brightness of our proposed counterpart.
4 The Environment of SGR 162741
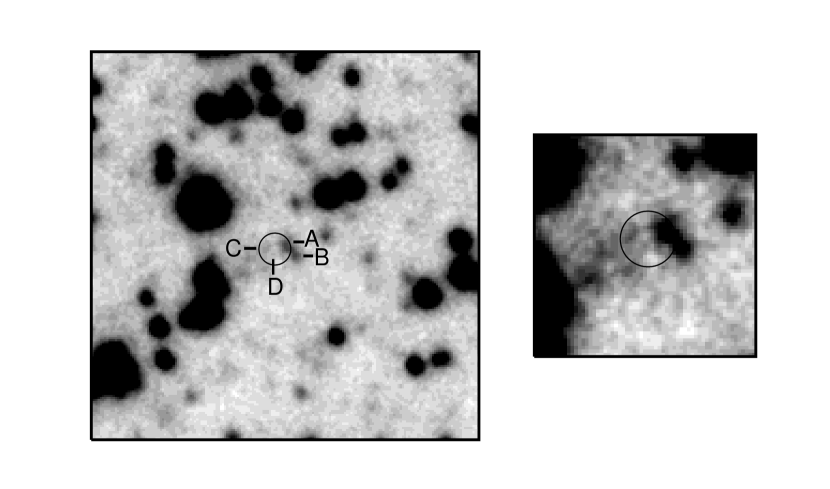
Figure 2 shows the best SGR 162741 CXO position with a 3 0.6″ error radius overlaid on our CTIO Ks band image (15″ 15″). North is up, east to the left. Despite the excellent seeing conditions during the observations (″), it is unclear whether the sources indicated as A and B are really just two sources or a composition of multiple fainter sources. Photometric measurements for A and B are given in Table 6. Unfortunately, sources C and D were too faint to be measured in any of the filters. Source D is closest to the center of the CXO X-ray error circle, but it is uncertain whether it is a real source or simply a noise spike.
We constructed an IR color–color as well as color–magnitude diagram from the 1296 sources in the 4m image that were detected in all three filters (Figure 3). We also indicated the location of the IR counterparts of all X-ray sources (not just those within 6′ of SGR 162741) with open squares. Of course, not all of these sources fall in the FOV of our 4m frame, however, the color–color and color–magnitude diagrams are not expected to change drastically over the CXO FOV, so that the positions of these sources are indicative of the type of sources we are dealing with. Only those IR counterparts with accurate photometric measurements, either from 2MASS (errors other than null) or our 1.5m and 4m images are shown. The solid lines in the color–color diagram trace the loci of unreddened main sequence (lower fork) and giant stars (upper fork). The giant and main sequence colors up to a spectral type of M6 are taken from Bessell & Brett (1988) and transformed to the 2MASS photometric system with the relations given in Carpenter (2001). We also added the 2MASS colors for late type M stars listed by Gizis et al. (2000).
The different branches visible in the color–magnitude diagram distinguish different types of stars. The first branch, roughly up to , corresponds to nearby main sequence stars, while the clump of stars around represents a superposition of giant stars with different values of extinction and distance. Most of the X-ray sources with IR counterparts are likely to be X-ray active nearby normal stars, since they fall on the unreddened main sequence and giant star tracks in both the color–color and color–magnitude diagrams. There is one extremely red source () corresponding to source 42 of Table 4. It is undetected in , but bright in both and . The source was in the CXO FOV only during the second observation. The very few source counts (76 total between keV) were fitted equally well with an absorbed power law and a thermal model, with cm-2, , and cm-2, , respectively. Most likely this source is an unusually red AGN (Wilkes et al., 2002; Cutri et al., 2001).
If we consider the IR magnitudes of the two most secure counterpart identifications, AXP 0142+614 (Israel et al., 2003b) and AXP 1048.1-5937 (Wang & Chakrabarty, 2002), and place these sources in the IR color–color diagram, they occupy a distinctly different location than source A and the majority of the field stars. With and , respectively for the two sources, they are much redder in than the bulk of the stars in the frame. Correcting for the extinction of shifts them in the direction of the indicated vector to the red edge of the end of the unreddened main sequence. On the other hand, reddening the intrinsic colors of AXP 1048.1-5937 with the for SGR 162741 would result in , shifting its location off the displayed color–color diagram. The position of source A in these diagrams shows that the source has normal colors consistent with some type of highly reddened giant star and can thus be rejected as a counterpart candidate for SGR 162741.
SGR 162741 is located at a distance of 11.00.3 kpc in the radio complex CTB 33, which consists of HII regions and the SNR (Sarma et al., 1997). Initially, the source was thought to be associated with the SNR, lying 30″ outside its rim. However, this association has been questioned by Gaensler et al. (2001), who suggested that both the SNR and SGR 162741 are simply part of the same star forming complex. Corbel et al. (1999) reported on millimeter observations of the line of sight to SGR 162741, and concluded that SNR is interacting with a massive giant molecular cloud (MC-71). Both SGR 162741 and the SNR appear to lie on the near side of the molecular cloud, since the total extinction up to MC-71444Including MC-71 would increase the expected extinction to mag deduced from the millimeter observations is mag, in good agreement with the mag extinction derived from the NH absorption of the SGR 162741 Beppo-Sax X-ray spectrum (Woods et al., 1999). Fits to our most recent CXO observations of the source give atoms cm-2 (Kouveliotou et al., 2003). Using the relation by Predehl & Schmitt (1995) this Hydrogen column density translates to , slightly larger than the previous determination.
To determine whether any of the sources visible inside the CXO error circle are viable counterpart candidates for SGR 162741, we have studied the brightness and colors of IR counterparts identified for other magnetars. We summarize the properties of the known IR counterparts in the following section.
5 Counterparts of other SGRs and AXPs
Currently, four AXPs have convincing IR counterparts while none are known for SGRs. Eikenberry et al. (2001) reported the presence of a faint IR source inside the CXO error circle for SGR 180620, but it remains to be confirmed whether this is the actual counterpart or a chance superposition in the crowded field of the source. The IR brightness of several AXPs has been determined on more than one occasion and appears to indicate significant variability. Particularly during bursting phases, the IR brightness has been seen to increase dramatically (Kaspi et al., 2003).
We have compiled the IR photometric measurements, distances, and extinction estimates for SGRs and AXPs available in the literature in Table Precise Localization of the Soft Gamma Repeater SGR 162741 and the Anomalous X-ray Pulsar AXP 1E1841045 with Chandra. In order to compare our IR sources to the established AXP counterparts, we corrected their published IR magnitudes for extinction using the relation between and by Cardelli, Clayton, & Mathis (1989). The resulting intrinsic magnitudes are listed in the 5th column of Table Precise Localization of the Soft Gamma Repeater SGR 162741 and the Anomalous X-ray Pulsar AXP 1E1841045 with Chandra. Note that no effort was made to correct for the difference in distances, since the distances to these objects are very uncertain. Among the AXPs, appears to be typical with the exception of counterpart candidate A for 1RXS J17084009. Israel et al. (2003) give two, rather discrepant, measurements for candidate A. The origin of this difference is not discussed. In any case, candidate A would be by far the intrinsically brightest AXP counterpart. Hulleman, van Kerkwijk, & Kulkarni (2004) derived predicted magnitudes based on the assumption that all AXPs have similar IR to X-ray flux ratios. They argue that candidate B for 1RXS J17084009 is more likely to be the true counterpart based solely on its brightness, while Israel et al. (2003) prefer candidate A due to the similarity of its color to other AXP counterparts. Our counterpart candidate for AXP 1E1841045 is also intrinsically brighter than most of the other AXPs and Hulleman, van Kerkwijk, & Kulkarni (2004) predict substantially fainter IR fluxes for this source. Deep, multicolor imaging of both 1RXS J17084009 and AXP 1E1841045 are needed to investigate the intrinsic range of IR fluxes between AXPs.
Since AXPs and SGRs appear to be manifestations of the same type of object, we might expect that the counterparts of SGRs would be of comparable brightness to those of AXPs. Our Table Precise Localization of the Soft Gamma Repeater SGR 162741 and the Anomalous X-ray Pulsar AXP 1E1841045 with Chandra shows that the detection limits of current SGR IR observations would not be sufficient to detect sources of the same intrinsic brightness as the known AXP counterparts. Only observations of SGR 1900+14 have even approached the magnitude limits necessary to detect a counterpart with the intrinsic brightness typical for an AXP. Consequently, the current IR candidates are unlikely to be the true counterparts for SGR 162741 and SGR 180620, unless SGRs are intrinsically much brighter than AXPs.
In an effort to answer this question by confirming the counterpart candidate for SGR 180620, we have observed the sources inside the CXO error circle reported by Kaplan et al. (2002a) for SGR 180620 during recent burst activity in July 2003. We obtained IR band observations of the field on 2003 July 31 with the ESO NTT and SOFI (exposure time and coadd parameters are listed in Table 1), only 17 days after renewed burst activity was detected from the source (Hurley et al., 2003). The data were reduced and analyzed in the identical manner as our SGR 162741 observations. We searched for brightening of any of the candidate counterpart sources proposed by Eikenberry et al. (2001) which would uniquely identify the SGR counterpart. The seeing of our image was inferior to that of Eikenberry et al. (2001) and we could not determine the brightness of all of the sources individually. In particular, we could not resolve sources A and B (nomenclature from Eikenberry et al. 2001) and only measured a combined magnitude for these sources. The resulting photometry is listed in Table 8 together with the photometry given by Eikenberry et al. (2001). Photometry for A+B was very difficult to obtain due to the vicinity of several very bright sources. The combined magnitudes for components A and B between our and Eikenberry’s observations are consistent with each other within the errors and do not support any significant brightening of one of the sources. Hence, the counterpart for SGR 180620 remains unidentified.
6 Conclusions
We have determined precise localizations of AXP 1E1841045 and SGR 162741 with Chandraallowing for the first IR counterpart search for SGR 162741 as well as a refined search for the counterpart of AXP 1E1841045. We compare the properties of our candidates to the detections and limits of other known AXP and SGR counterparts reported in the literature. Three out of the four SGR sources are heavily absorbed; optical observations of the fourth source, SGR 052666, have not revealed a counterpart despite the low extinction towards that source (Kaplan et al., 2001). We find that the remaining SGRs would have to be intrinsically much brighter than AXPs to have detectable counterparts in the observations currently available for these sources.
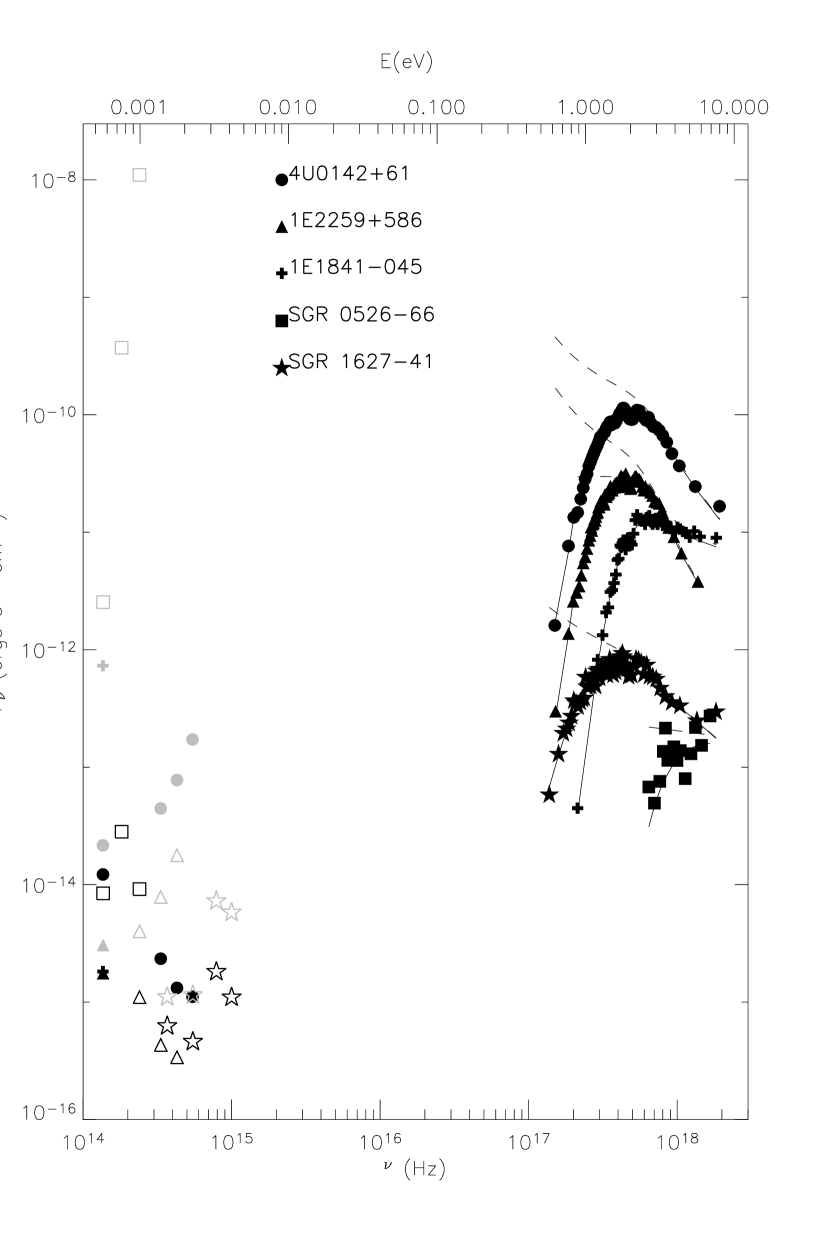
A comparison of the broadband spectra of five AXPs and SGRs are shown in Figure 4. The two SGRs shown in this figure have similar spectra but are dimmer than the AXPs in the X-ray band, probably due to both their larger distances (e.g., SGR 052666) and larger absorption columns (e.g., SGR 162741). It is, therefore, expected that the apparent optical/IR magnitudes of SGRs are significantly larger () than those of AXPs if the broadband emission mechanism is the same between the sources. We conclude that the counterparts to the three heavily absorbed SGRs have not yet been detected and that we would need significantly deeper observations to achieve that goal.
Such observations are useful in differentiating between different models for AXPs and SGRs. This is because the magnitude of the observed IR flux can place strong constraints on the nature of the emission, even though the different variants of the magnetar model make no concrete predictions for the IR emission. The most stringent constraint comes from imposing the thermodynamic limit on the surface emission from a neutron star; the maximum flux observed at infinity from thermal processes on the surface of a neutron star is given by the blackbody limit. For a source distance of 5 kpc and an emission frequency of Hz, the Rayleigh-Jeans limit to the blackbody approximation is
| (1) |
where is the radius of the neutron star and is the temperature of the surface layer from which the IR emission originates. In ultramagnetic surface emission models, this temperature is typically a factor of 10 smaller than the color temperature of the X-ray spectrum (Özel, 2001).
For the blackbody limit to be comparable to the observed IR flux, the temperature of the IR-emitting layers on the neutron star surface would need to exceed 1 MeV. This temperature would not only produce an X-ray spectrum incompatible with the data, but would also enter the regime where the neutrino emission dominates the cooling of the atmosphere. Clearly, the observed IR emission of the magnetars should originate in their magnetospheres.
Studying the broadband spectra of AXPs and SGRs are crucial for addressing the question of whether the same emission mechanism and energy source are responsible for generating their long- and short-wavelength emission. Observationally, the optical/IR and X-ray spectra cannot be fit by a simple extension of a physically plausible blackbody; the former rising in while the latter are falling. Moreover, the X-rays require the dissipation of magnetic energy whereas the optical/IR luminosities can be accounted for by rotational energy losses alone (Özel, 2004). Clearly, a spectral break must occur somewhere in the UV/EUV band. The position of this break and its luminosity will provide important clues towards understanding the energy budgets and emission mechanisms at work in AXPs and SGRs. Searches for these sources in the UV band in conjunction with deeper optical/IR observations are crucial in revealing the nature of the long-wavelength emission of magnetars.
References
- Bessell & Brett (1988) Bessell, M. S., Brett, J. M. 1988, PASP, 100, 1134
- Cardelli, Clayton, & Mathis (1989) Cardelli, J. A., Clayton, G. C., Mathis, J. S. 1989, ApJ, 345, 245
- Carpenter (2001) Carpenter, J. M. 2001, AJ, 121, 2851
- Cline et al. (2000) Cline, T., Frederiks, D. D., Golenetskii, S., Hurley, K., Kouveliotou, C., Mazets, E., & van Paradijs, J. 2000, ApJ, 531, 407
- Corbel et al. (1997) Corbel, S., Wallyn, P., Dame, T. M., Durouchoux, P., Mahoney, W. A., Vilhu, O., Grindlay, J. E. 1997, ApJ, 478, 624
- Corbel et al. (1999) Corbel, S., Chapuis, C., Dame, T. M., Durouchoux, P. 1999, ApJ, 526, L29
- Corbel & Eikenberry (2003) Corbel, S., & Eikenberry, S.S. 2003, astro-ph/0311313
- Cutri et al. (2001) Cutri, R. M. & et al. 2001, ASP Conf. Ser. 232: The New Era of Wide Field Astronomy, 78
- Duncan & Thompson (1992) Duncan, R. & Thompson, C. 1992, ApJ, 393, L9
- Durant, van Kerkwijk, & Hulleman (2003) Durant, M., van Kerkwijk, M. H., Hulleman, F. 2003, in Young Neutron Stars and Their Environments, IAU Symposium 218, eds. F. Camilo and B. M. Gaensler
- Eikenberry et al. (2001) Eikenberry, S. S., Matthews, K., Garske, M. A., Hu, Dounan, Jackson, M. A., Patel, S. G., Barry, D. J., Colonno, M. R., Houck, J. R., Wilson, J. C. 2001, ApJ, 563, L133
- Fuchs et al. (1999) Fuchs, Y., Mirabel, F., Chaty, S., Claret, A., Cesarsky, C. J., Cesarsky, D. A. 1999, A&A, 350, 891
- Gaensler et al. (2001) Gaensler, B. M., Slane, P. O., Gotthelf, E. V., Vasisht, G. 2001, ApJ, 559, 963
- Gavril et al. (2003) Gavril, F. P., Kaspi, V. M., Woods, P. M. 2003, HEAD, 35.5102
- Gizis et al. (2000) Gizis, J. E., Monet, D. G., Reid, I. N., Kirkpatrick, J. D., Liebert, J., Williams, R. J. 2000, AJ, 120, 1085
- Gotthelf et al. (2002) Gotthelf, E. V., Gavriil, F. P., Kaspi, V. M., Vasisht, G., & Chakrabarty, D. 2002, ApJ, 564, L31
- Gotthelf, Halpern, Buxton, & Bailyn (2004) Gotthelf, E. V., Halpern, J. P., Buxton, M., & Bailyn, C. 2004, ApJ, 605, 368
- Guidorzi et al. (2001) Guidorzi, C. et al. 2001, GCN 1041
- Helfand, Becker, Hawkins, & White (1994) Helfand, D. J., Becker, R. H., Hawkins, G., & White, R. L. 1994, ApJ, 434, 627
- Hulleman (2002) Hulleman, F. 2002, in Neutron Stars in Supernova Remnants, ASP Conference Series, Vol. 271, eds. P. O. Slane and B. M. Gaensler, p. 282
- Hulleman, van Kerkwijk, & Kulkarni (2004) Hulleman, F., van Kerkwijk, M. H., & Kulkarni, S. R. 2004, A&A, 416, 1037
- Hulleman, van Kerkwijk, & Kulkarni (2000) Hulleman, F., van Kerkwijk, M. H., Kulkarni, S. R. 2000, Nature, 408, 689
- Hulleman et al. (2000) Hulleman, F., van Kerkwijk, M. H., Verbunt, F. W. M., Kulkarni, S. R. 2000, A&A, 358, 605
- Hulleman et al. (2001) Hulleman, F., Tennant, A. F., van Kerkwijk, M. H., Kulkarni, S. R., Kouveliotou, C., Patel, S. K. 2001, ApJ, 563, L49
- Hurley (2000) Hurley, K., in Gamma-Ray Bursts, AIP 526, eds. Kippen, Mallozzi & Fishman, 763
- Hurley et al. (1999a) Hurley, K., Kouveliotou, C., Woods, P., Mazets, E., Golenetskii, S., Frederiks, D. D., Cline, T., van Paradijs, J. 1999a, ApJ, 519, L143
- Hurley et al. (1999b) Hurley, K., Li, P., Kouveliotou, C., Murakami, T., Ando, M., Strohmayer, T., van Paradijs, J., Vrba, F.; Luginbuhl, C., Yoshida, A., Smith, I. 1999b, ApJ, 510, L111
- Hurley et al. (2003) Hurley, K. et al. 2003, GCN Circ. 2297
- Israel et al. (2004) Israel, G. L., et al. 2004, ApJ, 603, L97
- Israel et al. (2003) Israel, G. L. et al. 2003, ApJ, 589, L93
- Israel et al. (2003b) Israel, G. L., Stella, L., Covino, S., Campana, S., Angelini, L., Mignami, R., Mereghetti, S., Marconi, G., Perna, R. 2003, astro-ph/0310482
- Israel et al. (2002) Israel, G. L. et al. 2002, ApJ, 580, L143
- Kaplan et al. (2002a) Kaplan, D. L., Fox, D. W., Kulkarni, S. R., Gotthelf, E. V., Vasisht, G., & Frail, D. A. 2002, ApJ, 564, 935
- Kaplan et al. (2002b) Kaplan, D. L., Kulkarni, S. R., Frail, D. A., van Kerkwijk, M. H. 2002, ApJ, 566, 378
- Kaplan et al. (2001) Kaplan, D. L., Kulkarni, S. R., van Kerkwijk, M. H., Rothschild, R. E., Lingenfelter, R. L., Marsden, D., Danner, R., Murakami, T. 2001, ApJ, 556, 399
- Kaspi et al. (2003) Kaspi, V. M., Gavriil, F. P., Woods, P. M., Jensen, J. B., Roberts, M. S. E., Chakrabarty, D. 2003, ApJ, 588, L93
- Klose et al. (2004) Klose et al. 2004, ApJ, accepted
- Kouveliotou (2004) Kouveliotou, C. 2004, in Proceedings of the Jan van Paradijs Memorial Symposium, eds. E.P.J. van den Heuvel, L. Kaper, R.A.M.J. Wijers & E. Rol., Publications of the Astronomical Society of the Pacific, in press.
- Kouveliotou et al. (1998a) Kouveliotou, C. et al. 1998a, Nature, 393, 235
- Kouveliotou et al. (1998b) Kouveliotou, C., Kippen, M., Woods, P., Richardson, G., Connaughton, V., McCollough, M. 1998b, IAUC 6944
- Kouveliotou et al. (1999) Kouveliotou, C. et al. 1999, ApJ, 510, L115
- Kouveliotou et al. (2003) Kouveliotou, C., Eichler, D., Woods, P. M., Lyubarsky, Y., Patel, S. K., Gogus, E., van der Klis, M., Tennant, A., Wachter, S., Hurley, K. 2003, ApJ, 596, L79
- Kriss, Becker, Helfand, & Canizares (1985) Kriss, G. A., Becker, R. H., Helfand, D. J., & Canizares, C. R. 1985, ApJ, 288, 703
- Mazets, Golenetskij, & Guryan (1979) Mazets, E. P., Golenetskij, S. V., & Guryan, Y. A. 1979, Soviet Astronomy Letters, 5, 343
- Mazets et al. (1979) Mazets, E. P., Golentskii, S. V., Ilinskii, V. N., Aptekar, R. L., & Guryan, I. A. 1979, Nature, 282, 587
- Mereghetti et al. (2001) Mereghetti, S., Mignani, R. P., Covino, S., Chaty, S., Israel, G. L., Neuhäuser, R., Plana, H., & Stella, L. 2001, MNRAS, 321, 143
- Morii, Sato, Kataoka, & Kawai (2003) Morii, M., Sato, R., Kataoka, J., & Kawai, N. 2003, PASJ, 55, L45
- Özel (2001) Özel, F. 2001, ApJ, 563, 276
- Özel (2004) Özel, F. 2004, astro-ph/0404144
- Predehl & Schmitt (1995) Predehl, P., & Schmitt, J. H. M. M., 1995, A&A, 293, 889
- Sanbonmatsu & Helfand (1992) Sanbonmatsu, K. Y. & Helfand, D. J. 1992, AJ, 104, 2189
- Sarma et al. (1997) Sarma, A. P., Goss, W. M., Green, A. J., Frail, D. A. 1997, ApJ, 483, 335
- Smith, Bradt, & Levine (1999) Smith, D. A., Bradt, H. V., Levine, A. M. 1999, ApJ, 519, L147
- Skrutskie (2001) Skrutskie, M. F. 2001, BAAS, 33, 827
- Stetson (1992) Stetson, P. B. 1992, ASP Conf. Ser. 25: Astronomical Data Analysis Software and Systems I, 1, 297
- Swartz et al. (2003) Swartz, D. A., Ghosh, K. K., McCollough, M. L., Pannuti, T. G., Tennant, A. F., & Wu, K. 2003, ApJS, 144, 213
- Thompson & Duncan (1995) Thompson, C. & Duncan, R. 1995, MNRAS, 275, 255
- Thompson & Duncan (1996) Thompson, C. & Duncan, R. 1996, ApJ, 473, 322
- Vasisht & Gotthelf (1997) Vasisht, G. & Gotthelf, E. V. 1997, ApJ, 486, L129
- Vrba et al. (2000) Vrba, F.J., Henden, A. A., Luginbuhl, C. B., Guetter, H. H., Hartmann, D. H., Klose, S. 2000, ApJ, 533, L17
- Wang & Chakrabarty (2002) Wang, Z., & Chakrabarti, D. 2002, ApJ, 579, L33
- Whiteoak & Green (1996) Whiteoak, J. B. Z., & Green, A. J. 1996, A&AS, 118, 329
- Wilkes et al. (2002) Wilkes, B. J., Schmidt, G. D., Cutri, R. M., Ghosh, H., Hines, D. C., Nelson, B., & Smith, P. S. 2002, ApJ, 564, L65
- Woods et al. (1999) Woods, P. M., Kouveliotou, C., van Paradijs, J., Hurley, K., Kippen, R. M., Finger, M. H., Briggs, M. S., Dieters, S., Fishman, G. J. 1999, ApJ, 519, L139

| Date | Telescope | (# images) | (# images) | (# images) |
|---|---|---|---|---|
| (Instr.) | exptime #coadd | exptime #coadd | exptime #coadd | |
| SGR 162741 | ||||
| 2001 March 06 | CTIO 1.5m | 9 | 9 | 9 |
| (OSIRIS) | ||||
| 2001 March 17 | CTIO 4m | 15 | 15 | 25 |
| (OSIRIS) | ||||
| 36 | ||||
| AXP 1E1841045 | ||||
| 2002 June 17 | ESO NTT | 30 | ||
| (SOFI) | ||||
| SGR 180620 | ||||
| 2003 July 31 | ESO NTT | 20 | ||
| (SOFI) | ||||
| Staraanomenclature from Mereghetti et al. (2001) | bbthis work | ccfrom Mereghetti et al. (2001) | ddre-analyzed data set of Mereghetti et al. (2001) | Star | bbthis work | ccfrom Mereghetti et al. (2001) | ddre-analyzed data set of Mereghetti et al. (2001) |
|---|---|---|---|---|---|---|---|
| A | 12.89 0.05 | 12.96 | 12.80 0.08 | 7 | 14.92 0.08 | 15.16 | 14.960.09 |
| B | 11.99 0.05 | 12.08 | 11.98 0.08 | 8* | 15.36 0.09 | 16.36 | 16.050.25 |
| C | 14.08 0.07 | 14.28 | 14.00 0.09 | 9 | 15.63 0.10 | 15.62 | 15.720.12 |
| D | 10.27 0.05 | 10.33 | 10.24 0.08 | 10 | 13.87 0.06 | 13.94 | 13.900.08 |
| H | 14.95 0.08 | 14.78 | 14.91 0.12 | 11 | 11.87 0.05 | 11.94 | 11.850.08 |
| I | 15.54 0.15 | 15.18 | 15.48 0.13 | 12 | 15.29 0.10 | 15.04 | 15.320.11 |
| L | 13.33 0.06 | 13.39 | 13.29 0.09 | 13 | 15.20 0.09 | 15.27 | 15.270.11 |
| M | 15.49 0.10 | 15.30 | 15.16 0.11 | 14* | 15.56 0.15 | 13.73 | 15.510.12 |
| O | 16.01 0.20 | 16.30 | 16.08 0.20 | 15 | 14.29 0.10 | 13.87 | 14.290.09 |
| P | 16.83 0.25 | 17.08 | 16.56 0.25 | 16* | 16.44 0.15 | 17.01 | 16.280.23 |
| Q | 14.37 0.07 | 14.41 | 14.13 0.11 | 17* | 16.11 0.15 | 16.78 | 15.830.13 |
| R | 15.81 0.20 | 15.54 | 15.85 0.20 | 18 | 16.20 0.20 | 16.37 | 16.080.20 |
| T | 15.69 0.15 | 16.04 | 15.67 0.13 | 19 | 12.76 0.05 | 12.81 | 12.730.08 |
| U* | 16.35 0.20 | 15.43 | 16.07 0.20 | 20 | 16.02 0.15 | 16.33 | 16.270.23 |
| V | 16.25 0.20 | 16.55 | 21* | 16.69 0.20 | 15.62 | ||
| Z | 15.65 0.10 | 15.88 | 15.76 0.13 | 22* | 15.77 0.15 | 14.42 | 16.040.20 |
| 1 | 16.23 0.15 | 16.19 | 16.41 0.25 | 23* | 16.58 0.20 | 17.08 | |
| 2 | 12.64 0.05 | 12.69 | 12.66 0.08 | 24 | 14.56 0.07 | 14.84 | 14.740.10 |
| 3 | 12.62 0.05 | 12.55 | 12.61 0.10 | 25 | 15.75 0.10 | 15.69 | 15.680.11 |
| 4 | 15.40 0.09 | 15.24 | 15.38 0.12 | 28 | 15.57 0.09 | 15.59 | 15.340.10 |
| 6* | 15.60 0.15 | 15.06 | 16.00 0.20 |
| RAaaChandra positions | DECaaChandra positions | RA (″) | DEC (″) | 2MASS, USNO catalog name |
|---|---|---|---|---|
| 16:35:29.988 | 47:38:05.28 | 0.768 | 0.07 | 16352991-4738053, 0375-28039446 |
| 16:35:34.207 | 47:39:33.86 | 0.576 | 0.29 | 16353414-4739335, 0375-28043741 |
| 16:35:34.666 | 47:33:05.86 | 0.869 | 0.47 | 16353458-4733063, 0375-28044283 |
| 16:35:37.133 | 47:38:03.15 | 0.243 | 0.33 | 16353710-4738034, 0375-28046819 |
| 16:35:37.426 | 47:38:49.13 | 0.930 | 0.27 | 16353733-4738494, 0375-28047088 |
| 16:35:42.206 | 47:33:41.66 | 0.586 | 0.18 | 16354214-4733418, 0375-28052100 |
| 16:35:42.341 | 47:34:07.00 | 0.404 | 0.26 | 16354230-4734072, 0375-28052286 |
| 16:35:45.168 | 47:36:57.03 | 0.354 | 0.03 | 16354513-4736569, 0375-28055150 |
| 16:35:45.494 | 47:37:43.93 | 0.617 | 0.06 | 16354543-4737438 |
| 16:35:45.667 | 47:41:32.19 | 0.738 | 0.12 | 16354559-4741320, 0375-28055773: |
| 16:35:47.515 | 47:36:08.32 | 0.384 | 0.03 | 16354747-4736082, 0375-28057595: |
| 16:35:48.425 | 47:36:50.22 | 0.435 | 0.08 | 16354838-4736502, 0375-28058346: |
| 16:35:49.382 | 47:40:08.96 | 0.728 | 0.05 | 16354930-4740090, 0375-28059500 |
| 16:35:51.859 | 47:39:41.27 | 0.232 | 0.75 | 16355188-4739405, 0375-28062106 |
| 16:35:53.477 | 47:32:30.68 | 0.819 | 0.17 | 16355339-4732305, 0375-28063751 |
| 16:35:53.988 | 47:30:42.78 | 0.526 | 0.25 | 16355393-4730425, 0375-28064268 |
| 16:35:55.346 | 47:35:22.53 | 0.162 | 0.29 | 16355532-4735228, 0375-28065740 |
| 16:35:55.764 | 47:39:55.75 | 1.132 | 0.24 | 16355565-4739559, 0375-28066141 |
| 16:35:56.371 | 47:36:37.28 | 0.576 | 0.11 | 16355631-4736373, 0375-28066792 |
| 16:35:58.898 | 47:41:02.35 | 1.021 | 1.10 | 16355899-4741034 |
| 16:36:03.761 | 47:35:36.11 | 0.465 | 0.12 | 16360371-4735359, 0375-28074553 |
| 16:36:07.896 | 47:40:25.26 | 1.688 | 0.22 | 16360772-4740254, 0375-28078699 |
| 16:36:08.969 | 47:32:06.17 | 1.537 | 0.45 | 16360881-4732057, 0375-28079785 |
| 16:36:17.681 | 47:32:55.41 | 0.121 | 0.27 | 16361766-4732556, 0375-28088802 |
| Source | RA (J2000) | DEC (J2000) | Chandra S/Naa0.7-7.0keV | off-axis (arcmin) | Comments |
|---|---|---|---|---|---|
| 1 | 16:34:43.783 | -47:35:26.42 | 6.6 | 11.2 | no 2MASS match |
| 2 | 16:34:44.542 | -47:36:47.85 | 4.5 | 11.1 | no 2MASS match |
| 3 | 16:34:55.814 | -47:40:03.40 | 3.9 | 9.9 | no 2MASS match |
| 4 | 16:35:18.257 | -47:48:32.39 | 5.2 | 13.4 | 16351836-4748321 |
| 16:35:18.362 | -47:48:32.12 | null | |||
| 5 | 16:35:19.339 | -47:45:52.61 | 5.0 | 10.9 | no 2MASS match |
| 6 | 16:35:20.534 | -47:51:09.47 | 6.0 | 15.7 | no 2MASS match |
| 7 | 16:35:20.657 | -47:41:44.48 | 3.3 | 7.4 | no 2MASS match |
| 8 | 16:35:20.676 | -47:40:29.27 | 3.2 | 6.5 | 16352058-4740281 |
| 16:35:20.589 | -47:40:28.18 | ||||
| 9 | 16:35:20.712 | -47:28:30.69 | 9.3 | 9.2 | 16352057-4728317 |
| AXJ1635.4-4728 ? | |||||
| 16:35:20.580 | -47:28:31.78 | ||||
| 10 | 16:35:25.975 | -47:38:01.39 | 4.8 | 4.4 | no 2MASS match |
| RAaaChandra positions | DECaaChandra positions | RA (″) | DEC (″) | 2MASS catalog name |
|---|---|---|---|---|
| 18:41:09.595 | 4:56:32.01 | 0.015 | 0.19 | 18410959-0456322 |
| 18:41:26.580 | 4:54:25.00 | 0.12 | 0.73 | 18412658-0454242 |
| 18:41:27.122 | 4:55:24.46 | 0.105 | 0.38 | 18412712-0455248 |
| 18:41:29.348 | 4:58:33.81 | 0.435 | 0.33 | 18412937-0458341 |
| 18:41:30.608 | 4:52:25.12 | 0.300 | 0.59 | 18413058-0452257 |
| Source | |||||
|---|---|---|---|---|---|
| A | 20.4 | 18.8 | 18.2 | 1.6 | 0.6 |
| B | 19.3 | 18.4 | 0.9 |
| Source | d (kpc) | Counterpart | ref. | ||
|---|---|---|---|---|---|
| SGRs | |||||
| 0526-66 | 50 | 1.0 | no candidate | 1 | |
| 1627-41 | 43-56 | 15–13.6 | this work, 2 | ||
| 180620 | , | , , aaThe lack of brightening during outburst suggests that this is NOT the counterpart | 14.6, 15.3 | 3, 4 | |
| 1900+14 | 5, 12-15 | , 19.2 | , | 19.3–18.6 | 5, 6 |
| AXPs | |||||
| 0142+614 | 2.6–5.1 | , , , | 19.3–19.0 | 7, 8, 9 | |
| , , | 19.7–19.4 | 10 | |||
| 19.5 | 11 | ||||
| 1048.15937 | 5.8 | , , | 18.7 | 12 | |
| 20.4 | 8 | ||||
| 17084009 | 7.8–11.2 | , bbsources with * are within the FOV of the 1.5m image | 16.6–16.3 | 13 | |
| , , bbCandidate A | 17.4–17.0 | 13 | |||
| , cc1.5m measurement | 19.1–18.7 | 13 | |||
| 1810197 | 5 | 6 | , | 20.1 | 14, 15 |
| 1841045 | 6–7.5 | 14.2 | 17.8 | this work, 16,17 | |
| 2259+586 | 5.2 | 21.1 | 18, 19 | ||
| , | 19.8–20.5 | 20 | |||
References. — (1)Kaplan et al. (2001) (2)Corbel et al. (1999) (3)Eikenberry et al. (2001) (4)Corbel et al. (1997) (5)Vrba et al. (2000) (6)Kaplan et al. (2002b) (7)Hulleman (2002) (8)Durant, van Kerkwijk, & Hulleman (2003) (9)Hulleman, van Kerkwijk, & Kulkarni (2000) (10)Israel et al. (2003b) (11)Hulleman, van Kerkwijk, & Kulkarni (2004) (12)Wang & Chakrabarty (2002) (13)Israel et al. (2003) (14)Israel et al. (2004) (15)Gotthelf, Halpern, Buxton, & Bailyn (2004) (16)Sanbonmatsu & Helfand (1992) (17)Morii, Sato, Kataoka, & Kawai (2003) (18)Hulleman et al. (2001) (19)Hulleman et al. (2000) (20)Kaspi et al. (2003)
| Source | this work | Eikenberry | 2MASS |
|---|---|---|---|
| A | 16.4aacombined magnitude for A+B | 16.7bbcombined magnitude for A+B is 16.53 | |
| B | 18.6 | ||
| C | 16.3 | 16.1 | |
| D | 14.09 | 13.87 | |
| E | 12.24 | 12.00 | 12.162 |