INFRARED ECHELLE SPECTROSCOPY OF PALOMAR 6 AND M71111Based on observations made with the Infrared Telescope Facility which is operated by the University of Hawaii under contract to the National Aeronautics and Space Administration.
Abstract
We present high-resolution infrared echelle spectroscopy for the globular clusters Palomar 6 and M71. Our mean heliocentric radial velocity of Palomar 6 is +180.6 3.2 km sec-1 and is 20 km sec-1 lower than that found by Minniti in 1995. Contrary to the previous metallicity estimates using low-resolution spectroscopy, our results show that Palomar 6 has an intermediate metallicity with [Fe/H] = 1.0 0.1 and is slightly more metal-poor than M71. Reasonable changes in the surface temperature or the microturbulent velocity of the model atmospheres do not affect [Fe/H] at more than 0.2 dex. In spite of its high metallicity, based on the spectrum of a single cluster member the [Si/Fe] and [Ti/Fe] ratios of Palomar 6 appear to be enhanced by 0.4 dex and 0.5 dex, respectively, suggesting that the Galactic inner halo may have experienced a very rapid chemical enrichment history.
1 INTRODUCTION
The measurement of [/Fe] ratios of globular clusters provides important information regarding relative ages. The -elements (C, O, Ne, Mg, Si, S, Ar, Ca, and Ti) are synthesized predominantly by massive stars, and ejected into the interstellar medium by Type II supernovae (SNe II) explosions. On the other hand, iron-peak elements are produced by both SNe II and Type Ia supernovae (SNe Ia). Enhanced values of [/Fe] ratios in globular clusters indicate the domination of SNe II nucleosynthesis, while lower ratios indicate increasing contribution of SNe Ia, which are thought to appear 109 or more years later. Therefore, the measurement of the behavior of [/Fe] versus [Fe/H] tells us how rapidly chemical enrichment proceeded in our Galaxy (Wheeler, Sneden, & Truran 1989). The [/Fe] ratio is also important in deriving accurate age from comparisons of color-magnitude diagrams (CMDs) to model isochrones.
[/Fe] ratios also provide a means of diagnosing the initial mass function (IMF) and star formation rate (SFR) parameters (McWilliam 1997). An IMF skewed to high-mass stars would have a higher -element yield while a high SFR would give an enhanced [/Fe] at a higher [Fe/H] since the interstellar medium will reach higher [Fe/H] before the onset of SNe Ia contributions. In the recent study of three metal-poor inner old halo globular clusters (Zinn 1993, Da Costa & Armandroff 1995), NGC 6287, NGC 6293, and NGC 6541, Lee & Carney (2002b) claimed that [Si/Ti] ratios are anticorrelated with Galactocentric distance of the “old” halo globular clusters, in the sense that the silicon abundance increases and the titanium abundance decreases with Galactocentric distances, and they proposed that the masses of SNe II progenitors may have been responsible for this elemental abundance gradient. However, the impact of the skewed IMF of SNe II progenitors in metal-rich globular clusters’ -element abundances appears to be unclear as yet mainly due to the lack of study of metal-rich clusters. Thus more chemical abundance studies of metal-rich globular clusters near the Galactic center are necessary, since the most metal-rich globular clusters are concentrated in the Galaxy’s central regions.
Palomar 6 is known to be a metal-rich globular cluster located 0.9 kpc from the Galactic center. As Lee & Carney (2002a) discussed, the metallicity of Palomar 6 has been in controversy for two decades. Malkan (1981) was the first to estimate the metallicity of Palomar 6, [Fe/H] = 1.30, using a reddening-free metallicity index , ranking it a metal poor inner halo cluster. Zinn (1985) derived [Fe/H] = 0.74 for Palomar 6 by reanalyzing Malkan’s photometry. Ortolani et al. (1995) estimated [Fe/H] 0.4 based on the (, ) - CMD. The results of Minniti (1995b) and Bica et al. (1998) are worth noting. Minniti (1995b) studied the metallicities of seven highly reddened clusters near the Galactic center including Palomar 6. He obtained low S/N ratio spectra of six red-giant branch (RGB) stars with 2 Å resolution covering 4700 - 5400 Å. He suggested that the sum of Mg 5175 Å, Fe 5270 Å, and Fe 5535 Å lines (Mg + 2Fe) is the optimal indicator of metallicity following Faber et al. (1985), and Minniti derived [Fe/H] = +0.2 0.3 for Palomar 6 based on the location of the giants in the (Mg + 2Fe) versus diagram (see his Figure 1). More recently, Bica et al. (1998) undertook a metallicity study of the globular clusters near the Galactic center with an expanded sample. They measured the Ca II triplet 8498, 8542, and 8662 Å using intermediate resolution (5.4 Å pixel-1) integrated spectra and obtained [] = 0.09 for Palomar 6. It should be emphasized that the result of Bica et al. (1998) may have a potential problem with field star contamination, since Palomar 6 lies in the Galactic center and the field star contamination is expected to be very high (see, for example, Figure 8 of Lee & Carney 2002a). The abundance study of Galactic bulge giants showed that the mean [Fe/H] = 0.25 (McWilliam & Rich 1994), which is comparable to that of Bica et al. (1998) found for stars in or near Palomar 6. Also the metallicity estimates relying on low resolution spectra can give erroneous results in the metal-rich RGB stars due to blending with some of the notorious molecular bands, such as TiO (see, for example, Plez 1998) and CN (see, for example, McWilliam & Rich 1994). McWilliam & Rich (1994) have demonstrated the effect of the CN blending in the metal-rich bulge K giants in their Figure 7. They claimed that the CN blending may cause a discrepancy in metallicity by 0.3 dex between the results of McWilliam & Rich (1994), who employed high resolution spectroscopy, and those of Rich (1988), who employed a similar method as Minniti (1995). Recently, Stephens & Frogel (2004) employed medium-resolution ( = 1380 – 1650) infrared (IR) -band spectroscopy for 8 globular clusters near the Galactic center. They measured Na I doublet ( 21910 – 21966Å), Ca I triplet ( 22450 – 22560Å), CO(2,0) band ( 22915 – 23025Å) and obtained [Fe/H] = 0.52 0.11 for Palomar 6. Comparisons of high resolution spectra of cool stars of Wallace & Hinkle (1996) with the spectral regions used by Stephens & Frogel (2004) show that their spectral regions are vulnerable to contamination from the CN blending and their results may have problems similar to those of Rich (1988). Therefore high resolution spectroscopy free from blending with molecular bands is required.
In this paper, we present high-resolution IR spectroscopy of three RGB stars in Palomar 6. Due to its high interstellar reddening value, 1.25 – 1.4 mag, IR spectroscopy is essential for studying Palomar 6.
2 OBSERVATIONS AND DATA REDUCTION
Our observations were carried out at the 3.5m NASA Infrared Telescope Facility using CSHELL, the facility cryogenic IR echelle spectrograph (Tokunaga et al. 1990; Greene et al. 1993), on July 13 – 14 1997 for M71 and May 22 – 25 1998 for Palomar 6. CSHELL is a long-slit spectrograph which uses a 31.6 lines/mm, 63.5 echelle grating with narrow band circular variable filters that isolate a single order. The detector for our observations was a 256 256 Hughes SBRC InSb array, which provides a spectral coverage of 750 km sec-1 ( 50 Å). All of our observations were obtained with a 0.5 arcsec slit, providing a nominal resolution of 42,000, or 7 km sec-1, using a “nodding” mode, which moves the telescope between frames and stores each frame separately. Because of the limited spectral coverage in a single grating setting, it was necessary to choose particular grating settings to cover spectral features of special interest. We chose two spectral regions based on the IR Atlas of Arcturus (Hinkle et al. 1995). One setting is for the two Fe I lines (centered at 22395 Å) and the other is for the two Si I lines and a Ti I line (centered at 21815 Å). It should be emphasized that our spectral regions are free of molecular lines, such as CN or CO. Both spectral regions contain the neutral scandium lines, however, we do not derive the scandium abundance due to the lack of information of the hyperfine splitting of the Sc I lines.
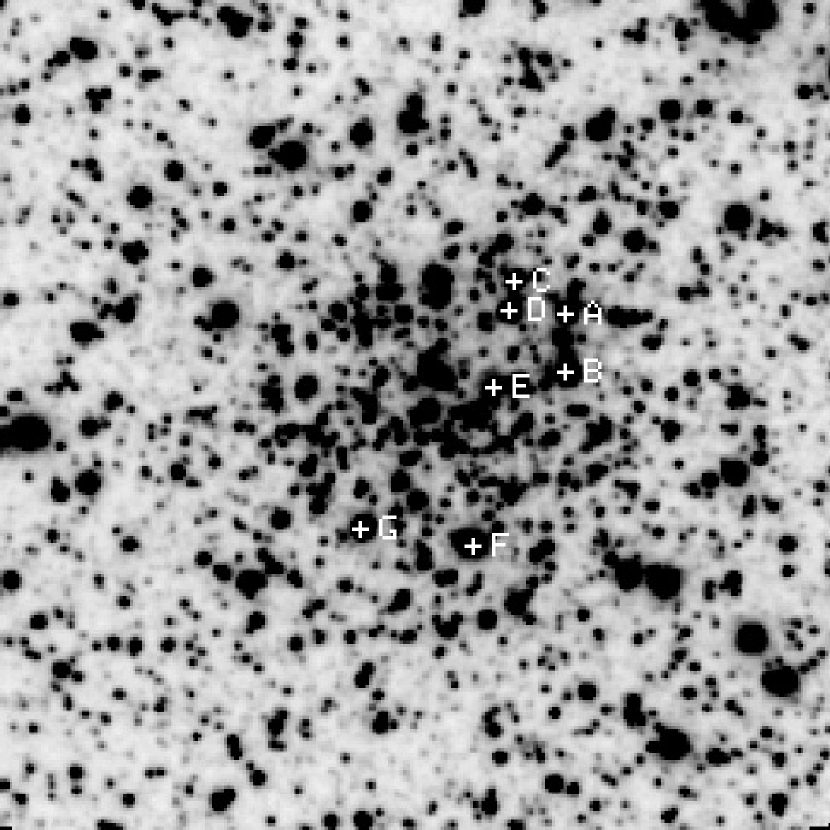
The basic photometric data for our targets using star IDs of Minniti (1995b) are given in Table 1 and the finding chart is given in Figure 1. Note that we adopt photometry by Lee & Carney (2002a) in the Table.
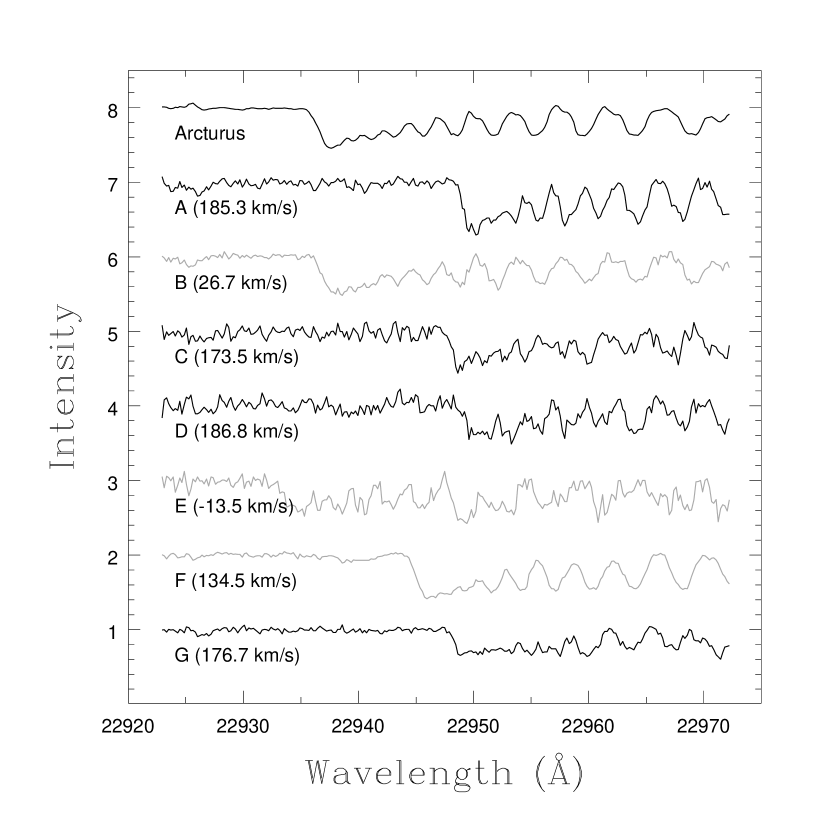
We also obtained spectra for the 12CO 2-0 bandhead for each target and for Arcturus to measure the radial velocity. This was necessary, as noted above, since field contamination toward Palomar 6 is expected to be high due to its low galactic latitude. Once we confirmed probable cluster membership using the velocities for each target (see Section 3.1), we obtained useful spectra for stars A, D, and G. We also obtained spectra of rapidly rotating early type stars in order to remove telluric absorption features. The journal of observations is summarized in Table 2.
The raw data reductions were performed following the similar procedures described by Carr, Sellgren, & Balachandran (2000). In nodding mode, the data are stored with “a” or “b” name extensions to indicate beam polarity. Subtraction of these a-beam and b-beam images removed dark current, residual images on the array, and any thermal or night sky line emission. The beam images were combined together separately. The residuals of the cosmic ray hit events on these combined images were removed by eye using the IRAF task IMEDIT, and then the spectrum was extracted using the IRAF task APALL. Separate dispersion solutions were determined for the two beams before combining them into one spectrum. The same procedures were done for hot star spectra and then the hot star spectra were divided into the target spectra to correct for telluric absorption lines and for fringing in the spectra. The target spectra were then continuum fitted and normalized.
3 ANALYSIS
3.1 Radial velocity measurements
In Figure 2, we show spectra of Arcturus and our targets in Palomar 6 for the 12CO 2-0 bandhead centered at 22945 Å. In order to derive the heliocentric radial velocities, we cross-correlated our object spectra with that of Arcturus ( = 5.2 km sec-1, Evans 1967). Table 3 shows our heliocentric radial velocity measurements for our targets. We also list those of Minniti (1995b). In general, our radial velocity measurements do not agree with those of Minniti (1995b). We believe that Minniti (1995b) misidentified star F as a cluster member since the radial velocity of this star is not consistent with cluster membership.
An independent check of the radial velocity for Palomar 6 remains desirable. However, in this paper we consider our velocity measurements are correct and stars A, C, D, and G are cluster members. Our mean heliocentric velocity of Palomar 6 is +180.6 3.2 km sec-1 and is 20 km sec-1 smaller than that of Minniti (1995b). (The error is that of the mean and is affected by both our measurement uncertainties and by the cluster’s internal velocity dispersion.)
3.2 Oscillator strengths
Laboratory measurements of the oscillator strengths for the lines in our spectral regions do not exist. Therefore, we derived the oscillator strengths following the procedure described by Carr et al. (2000), which exploits the known abundances and stellar atmospheric parameters for both the Sun and for Arcturus. We used Kurucz’s solar atmosphere model with = 1.0 km s-1 and adopted = 4300 K, = 1.5, and = 1.7 km s-1 for Arcturus (Peterson et al. 1993).
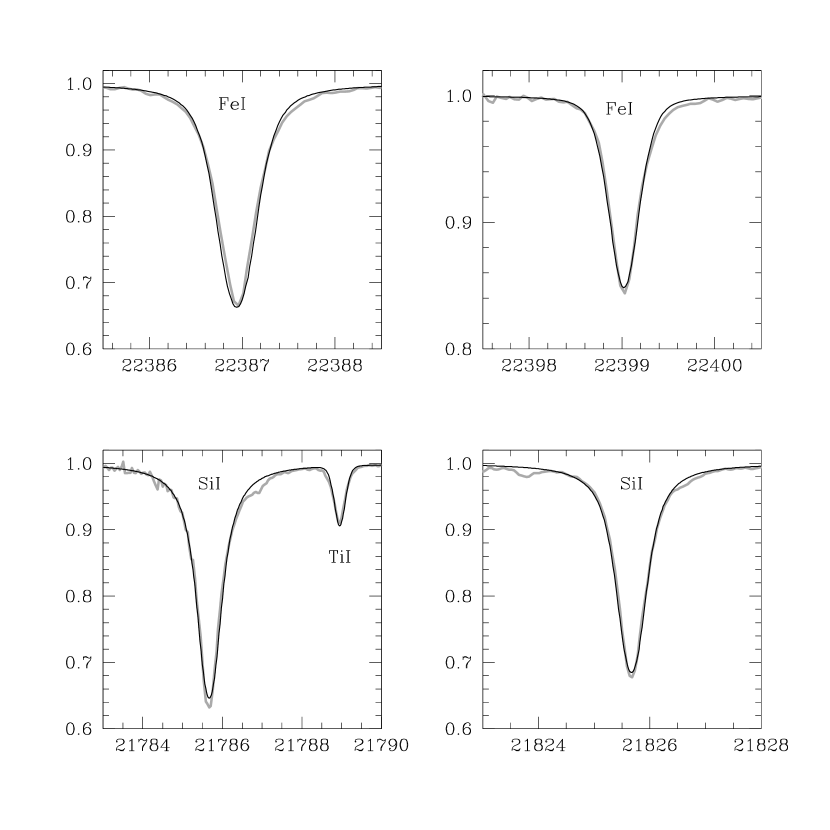
We first measured the equivalent widths of the absorption lines from the solar intensity spectrum (Wallace et al. 1996) and then derived the corresponding oscillator strengths for each line using the solar model atmosphere (Kurucz 1994) and MOOG (Sneden 1973). For collisional damping, we considered only the van der Waals force, and we adopted the Unsöld approximation. It is suspected that the collisional damping constant calculated using the Unsöld approximation is probably too small (e.g. Steffen 1985), so we artificially increased the collisional damping constants by matching the synthetic spectrum to the solar intensity spectrum of Wallace et al. (1996). To calculate the synthetic solar spectrum, we use the macroturbulent velocity of 3.0 km s-1 for the Sun (Gray 1977) and the solar elemental abundances of Anders & Greevesse (1989). The synthetic spectra with no enhancement in the collisional damping constant fail to match the line core depth and the line wing profile in particular for iron lines. Thus we enhanced the collisional damping constant by a factor of 3.5 for the iron lines and by a factor of 2 for the silicon and titanium lines. We show the synthetic solar spectra in Figure 3 and our solar oscillator strengths in Table 4. Note that our Fe I oscillator strengths are slightly different from those of Carr et al. (2000), who adopted different collisional damping enhancement factors. Their damping constants were enhanced by a factor of 3 for Fe I 22386.90 Å and by a factor of 2 for Fe I 22399.16 Å. Our solar oscillator strength for Ti I 21788.63 Å is rather uncertain, since it is on the wing profile of the nearby Si I 21785.60 Å, which has a strong wing profile in the solar spectrum. In the Figure, it is evident that the solar intensity spectrum shows subtle line asymmetries, in particular for iron lines, probably caused by the doppler shift due to the convective and oscillatory motions in the solar atmosphere, which cannot be reproduced by the plane-parallel one dimensional model atmosphere (Asplund 2003).
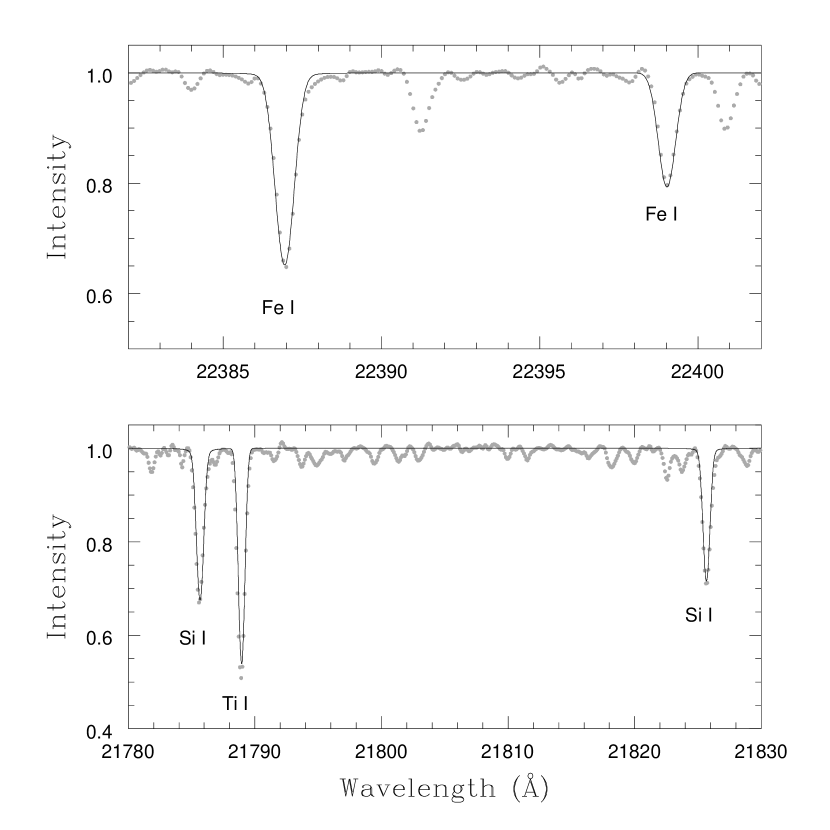
A comparison with an Arcturus spectrum provides a crucial opportunity to examine the reliability of our solar oscillator strengths, since the chemical composition and the stellar parameters of Arcturus are closer to those of our target RGB stars than those of the Sun and a high resolution, high S/N ratio spectrum is also available for Arcturus (Hinkle et al. 1995). Using the solar oscillator strengths and our equivalent width measurements for Arcturus, we obtained [Fe/H] = 0.48 0.07, [Si/Fe] = 0.24 0.09, and [Ti/Fe] = +0.61 for Arcturus. (The errors are those of the mean.) Our iron and silicon abundances are in good agreement with those of Sneden et al. (1994), who obtained [Fe/H] = 0.47 0.04 and [Si/Fe] = +0.14 0.07,111 The silicon abundance for Arcturus is rather controversial. Peterson et al. (1993) obtained [Fe/H] = 0.5 0.1, [Si/Fe] = +0.4, [Ti/Fe] = +0.3, = 4300 30 K, = 1.5 0.15, and = 1.7 0.3 km sec-1 for Arcturus. See Table 5. while our titanium abundance is very high compared to that of Sneden et al. (1994), [Ti/Fe] = +0.27 0.04. Figure 4 shows a comparison between the observed Arcturus spectrum (Hinkle et al. 1995) and the synthetic spectrum using our solar oscillator strengths and the elemental abundance ratios of Sneden et al. (1994). The Figure clearly shows that the solar oscillator strength for Ti I 21788.63 Å does not work for Arcturus. The equivalent width for the Ti I 21788.63 Å line in the synthetic spectrum is 296 mÅ and it is about 66 mÅ smaller than that we measured from the Arcturus spectrum of Hinkle et al. (1995). We examined the atomic spectral lines of Kurucz & Bell (1995) and found no strong lines near Ti I 21788.63 Å. We then generated the synthetic spectrum using the wavelengths and the oscillator strengths given by Kurucz & Bell (1995) and measured the equivalent width produced by atomic spectral lines around Ti I 21788.63 Å. We found that Ti I 21788.25 Å and Mn I 21788.49 Å lines contribute no more than 5 mÅ to our equivalent measurement of Ti I 21788.63 Å. We also generated a synthetic solar spectrum using the same line list except for Ti I 21788.25 Å and Mn I 21788.49 Å lines near Ti I 21788.63 Å and measured the equivalent width of 0.8 mÅ which is too small to cause such a large discrepancy in the titanium abundance of Arcturus. In the synthetic solar spectrum where the spectral resolution is much higher than that of Arcturus spectrum, the line cores of Ti I 21788.63 Å and the combination of Ti I 21788.25 Å and Mn I 21788.49 Å are well separated. Therefore it is not likely that our equivalent width measurement of Ti I 21788.63 Å from the observed solar spectrum is contaminated by the previously known nearby atomic spectral lines. We also examined CN molecule absorption lines (Wallace & Hinkle 1996) and found no known CN spectral lines at 21788.63 Å. This leads us to suspect that there may exist unidentified atomic spectral lines very close to Ti I 21788.63 Å. Also importantly, the excitation potential energy of Ti I 21788.63 Å is 1.749 eV and this line forms higher in the atmosphere where non-local thermodynamic equilibrium (NLTE) effects may be considered. On the other hand, Fe I and Si I lines of our interest form deep in the atmosphere due to their high excitation potential energies and NLTE effects to these lines are less severe.
We examined the solar value for the Ti I 21788.63 Å line using the giant stars I-45 and I-46 in M71. Sneden et al. (1994) studied the same stars in the optical employing high resolution echelle spectroscopy and they obtained [Fe/H] =0.78 0.04, [Ti/Fe] = +0.56 0.06 for I-45 and [Fe/H] = 0.79 0.06,[Ti/Fe] = +0.47 0.07 for I-46. Using the solar oscillator strength values and the stellar parameters of Sneden et al. (1994), we obtained [Fe/H] =0.9 0.1, [Ti/Fe] = +1.0 for I-45 and [Fe/H] =0.8 0.1, [Ti/Fe] = +0.8 for I-46. The discrepancy in the titanium abundance is large again. On the other hand, our silicon abundance measurement for the star I-45 is in good agreement with that of Sneden et al. (1994). Our silicon abundance of the star I-46 is [Si/Fe] = 0.1 and is about 0.4 dex lower than that of the star I-45. Sneden (private communication) kindly noted that the silicon spectral lines for the star I-46 are too weak to measure reliably in his spectra.
If the discrepancy in the titanium abundance is caused by NLTE effects, then using the oscillator strengths derived from the observed Arcturus spectrum of Hinkle et al. (1995) would mitigate the problem since Arcturus is a metal-rich RGB star and the atmospheric structure of Arcturus is more similar to our program stars than that of the Sun is. As mentioned above, Ti I 21788.63 Å line has a low excitational potential energy and it suffers from more severe NLTE effects than Fe I and Si I lines, which have high excitational potential energies (Ruland et al. 1980; Brown et al. 1983; Hauschildt et al. 1997).
We examine the NLTE effects on our titanium abundance using one dwarf (61 UMa) and three giants ( Sge, Cep, and Ori) with solar metllicity. To avoid the possible contamination by unidentified atomic spectral lines very close to Ti I 21788.63 Å, we chose three more Ti I lines free from CN blending at 21903.31, 22216.74, 22239.03 Å and we derived oscillator strengths using the solar spectrum and the Arcturus spectrum. For the Arcturus Ti I oscillator strengths, we adopt (Ti) = 4.79 (Sneden et al. 1994) and our Ti I oscillator strengths are shown in Table 6. Wallace & Hinkle (1996) provided high-resolution IR spectra ( 45,000) of 61 UMa, Sge, Cep, and Ori and the chemical compositions and stellar parameters of these four stars are previously known in optical. Table 7 shows the basic stellar parameters and iron, titanium abundances of 61 UMa, Sge, Cep, and Ori (Luck 1977, Cornide & Rego 1984, Lambert et al. 1984, McWilliam 1990, Carr et al. 2000). We then measured the equivalent widths for Fe I 22386.90, 22399.16 Å and Ti I 21788.63, 21903.31, 22216.74, 22239.03 Å and obtained (Fe) and (Ti) for the stars. Remind that Fe I 22386.90, 22399.16 Å and Ti I 21788.63 Å lines are of interest in our study. Our iron abundance measurements using the solar oscillator strengths are in excellent agreement with previous measurements in optical within (Fe) 0.05 dex. For the titanium abundance measurements, the situation is somewhat different. The titanium abundance for 61 UMa is not known, but we assume that this thin disk, solar-type star has [Ti/Fe] = 0.00, from which we deduce log (Ti) = 4.99. As Table 7 shows, using values for the different Ti I lines derived from solar spectrum leads to consistent titanium abundances for 61 UMa, whose surface gravity is similar to the Sun. But the solar Ti I values do not appear to yield correct abundances for the three giant stars. Table 7 shows that in those cases, the values derived from the Arcturus spectrum provide a better match. This may reflect unknown problems in either underlying and unidentified absorption lines or, since the behavior appears to affect all the Ti I lines, problems in the adopted relations for giants compared to dwarfs.
For our titanium abundance determination in Palomar 6, in which we rely on giant stars, we therefore adopt values derived from the Arcturus spectrum. Table 8 summarizes our adopted values.
3.3 Stellar parameters and model atmospheres
3.3.1 The effective temperature
Having good stellar parameters, such as the effective temperature and the surface gravity, is very important in any stellar abundance study, since the absolute or the relative elemental abundance scales will depend on the input stellar parameters. In optical spectroscopy, the effective temperature is usually determined by using weak neutral iron lines with log(Wλ/) , lying on the linear part of curve of growth (COG). Since only the two very strong neutral iron lines with similar excitation potentials are available in our spectral regions, we have to rely upon photometric temperature estimates. However, applying the photometric method using relations between color versus for Palomar 6 still poses a problem, since the interstellar reddening value for the cluster is not well known. In the case of using the color index to estimate the stellar temperature, an uncertainty of 0.1 mag in will result in an uncertainty of 100 K in the photometric surface temperature in the stellar temperature range of our interest. The discrepancy between previous interstellar reddening estimates for Palomar 6 is as large as 0.15 mag (Lee & Carney 2002a). We, therefore, devise an alternative photometric temperature determination method, which is independent of interstellar reddening and the photometric zero points, using the magnitude differences between the horizontal branch (HB) stars and the RGB stars.
In Figure 5, we show a plot of versus for the RGB sequences with Z = 0.010, 0.004 (equivalently [Fe/H] = 0.5, 0.9) and the zero-age horizontal branch (ZAHB; Kim et al. 2002; Yi, Demarque, & Kim 1997). The differences in (i.e., the differences in bolometric magnitudes) between HB and RGB stars are linearly related to the surface temperature of the RGB stars, with a slight dependence on metallicity. Since the bolometric correction for RGB stars in the passband, , is linearly correlated with the effective temperature (see, for example, Bessell, Castelli, & Plez 1998), the difference in the magnitude is also linearly correlated with the difference in luminosity, . Therefore, we can estimate the temperature of our target RGB stars by simply measuring the difference in magnitude between the HB and the target RGB stars, . Since HB stars are not located horizontally in IR CMDs, it is necessary to adopt the magnitude at the intersection between RGB and red HB (RHB) in IR photometry for our HB reference level, (for example, see Kuchinski et al. 1995). In practice, instead of using the theoretical values, we relied upon the versus diagram for RGB stars in well-studied globular clusters with similar metallicities as Palomar 6.
We show CMDs of the metal-rich globular clusters 47 Tuc ([Fe/H] = 0.7, Frogel, Persson, & Cohen 1981), M69 ([Fe/H] = 0.7, Frogel, Persson, & Cohen 1983; Davidge & Simons 1991), M71 ([Fe/H] = 0.7, Frogel, Persson, & Cohen 1979),and M107 ([Fe/H] = 1.0, Frogel, Persson, & Cohen 1983) in Figure 6. We adopt magnitudes from Kuchinski et al. (1995) for these template clusters and we use = 13.53 mag for Palomar 6 (see Lee & Carney 2002a). Since the interstellar reddening values are well known for template clusters, we can derive the effective temperature for the RGB stars in template clusters using the relation given by Alonso, Arribas, & Martinez-Roger (1999). In Figure 7, we show a plot of versus for the RGB stars in the template clusters and we obtain a linear relation between and ,
| (1) |
Using this relation and values for our target RGB stars in Palomar 6 listed in Table 1, we obtain = 3718, 3741, and 3667 K for stars A, D, and G, respectively. The effective temperature estimates for Palomar 6 A, D, and G using the versus relation given by Alonso et al. (1999) are 3703, 3747, and 3597 K for = 1.3 mag (Lee & Carney 2002a). These values agree with those from the versus relation within 100 K. As a cross-check, we also obtained the surface temperature for M71 RGB stars using equation (1) and we have =4043 K for I-45 and = 4019 K for I-46. Our surface temperatures for M71 RGB stars are in good agreement with those of Sneden et al. (1994), who obtained temperatures of 4050 K and 4000 K, respectively.
3.3.2 The surface gravity
To estimate the surface gravity, we rely on the model isochrones of Yi, Demarque, & Kim (1997) and Kim et al. (2002). First we calculated the bolometric correction in the passband, , for the temperatures and surface gravities of each grid of model isochrones by interpolating the (, , ) grids of Bessell, Castelli, & Plez (1998). Then we calculated the bolometric magnitudes () using and obtained the magnitudes in passband () by subtracting from for each grid of the model isochrones, assuming
| (2) |
This procedure allows us to calculate for the model isochrones. In Figure 8, we show a plot of versus for the model isochrones with [Fe/H] = 0.9, 0.5 and [/Fe] = +0.3 for 10, 14 Gyr. In the Figure, we also show the locations of RGB stars in M71 and our program stars in Palomar 6. For M71 RGB stars, we obtained = 1.0 for I-45 and I-46. Our surface gravities for M71 RGB stars are = 0.2 dex larger than those of Sneden et al. (1994). For Palomar 6, we obtained = 0.3 for Palomar 6 A and D, and = 0.2 for Palomar 6 G assuming [Fe/H] 1.0 for Palomar 6 (see Lee & Carney 2002a). Note that our surface gravity estimates using the model isochrones should be considered as the upper limit of surface gravities of our program stars, since the mass loss has not been included in model isochrone calculations (Kim, Y. -C., private communication). Since our program stars in Palomar 6 lie near the tip of RGB, the mass loss rate will be large, leading to lower surface gravities.
3.3.3 The microtubulent velocity
To estimate the microturbulent velocity requires many spectral lines, preferably Fe I lines in optical spectroscopy, both on the linear and the flat parts of the COG. Since we have only two strong Fe I (or two Si I) lines and we are not able to properly estimate the microturbulent velocities for our program RGB stars. Therefore we adopt the microturbulent velocity of 2 km sec-1 for our program RGB stars without any verification. In Figure 9, we show comparisons of versus versus of RGB stars in globular clusters extensively studied in optical (Brown, Wallerstein, & Oke 1990; Ivans et al. 1999, 2001; Norris & Da Costa 1995; Sneden et al. 1994, 2004). Nine stars in these six clusters have 0.3, comparable to our program stars in Palomar 6. Those nine stars have a mean of 1.9 0.2 km sec-1. If we include stars with 0.5, there are 23 stars and they have a mean of 2.0 0.3 km sec-1 (The error is the standard deviation). Since these stars are very similar to our program stars in Palomar 6, our choice of = 2.0 km sec-1 is thought to be reasonable. It should be noted that, however, the microturbulent velocity appears to increase with decreasing surface gravity in M supergiants (see, for example, Figure 4 of Ramírez et al. 2000).
3.3.4 The model atmosphere
With temperature and surface gravity estimates, 72-depth plane-parallel local thermodynamic equilibrium (LTE) model atmospheres were computed using the program ATLAS9, written and supplied by Dr. R. L. Kurucz. The model atmospheres were computed using opacity distribution functions and abundances with enhanced abundances of all the “” elements (O, Ne, Mg, Si, S, Ar, Ca, and Ti) by 0.4 dex, assuming our target RGB stars would prove to be -element enhanced (see discussions below). The abundance analysis was performed using the program MOOG (Sneden 1973).
Since our abundance analysis is based upon the neutral lines, the elemental abundances are not sensitive to the surface gravity. On the other hand, since we rely on very strong lines, our results will depend on the choice of microturbulent velocity of the model atmosphere, which we are not able to estimate using our target spectra.
4 RESULTS
We show our equivalent width measurements in Table 9 and the elemental abundances for Palomar 6 and M71 in Table 10. We also show the elemental abundances of Sneden et al. (1994) in the Table. In Table 11, we show estimated errors resulting from the uncertainties in the input model atmosphere = +200 K, = 0.2, and = +0.5 km sec-1, which are appropriate for our analysis. In general, [Fe/H] and [Si/Fe] ratios are not sensitive to the changes in the input parameters of model atmospheres. However, [Ti/Fe] is very sensitive to the surface temperature and the microturbulent velocity. An uncertainty of = +200 K leads to an uncertainty of 0.3 dex and an uncertainty of = +0.5 km sec-1 leads to 0.3 dex in the [Ti/Fe] ratio.
Table 10 shows that our M71 abundances are consistent with those obtained by Sneden et al., given the uncertainties and the limited number of lines available for our analyses.
The mean metallicity for Palomar 6 is [Fe/H] = 1.0 0.1, consistent with that derived from the slope of the RGB in the CMD, [Fe/H] 1.1 (Lee & Carney 2002a), and is slightly more metal-poor than M71, [Fe/H] = 0.8 0.1, unless our surface temperatures or the microturbulent velocities for the Palomar 6 RGB stars are inaccurate by more than 400 K or 0.7 km sec-1. We show the synthetic spectra for [Fe/H] = 1.0, 0.5, 0.0, and the observed spectra of the Palomar 6 RGB stars in Figure 10. In the Figure we used an ad hoc value for Sc I 22400.70 Å since the hyperfine splitting components for the line are not known. The Figure clearly indicates that the observed Fe I absorption lines are too weak to lead to the super- or near-solar metallicity as claimed by Minniti (1995b) or Bica et al. (1998). Figure 11 shows synthetic spectra for the star Palomar 6 G using the model atmospheres with [Fe/H] = +0.20, which is the metallicity of Palomar 6 claimed by Minniti (1995). As can be seen in the Figure, synthetic spectra do not reproduce the observed spectrum of the star Palomar 6 G until 5000 K, which is an unreasonably high surface temperature for the super-metal-rich RGB star (see also Figure 6). Therefore, it is most likely that Palomar 6 is much more metal-poor than claimed by Minniti (1995b) or Bica et al. (1998).
Our [Si/Fe] ratio for the star I-45 shows good agreement with the results of Sneden et al. (1994), suggesting that our measurement for the silicon abundance is reliable. It appears that the silicon abundance of the star Palomar 6 G is enhanced by 0.4 dex. The titanium abundance is enhanced by 0.5 dex relative to the iron abundance. Figure 12 shows synthetic spectra of the star Palomar 6 G with [Si/Fe] = +0.4 and [Ti/Fe] = +0.5. In their Figure 9, Lee & Carney (2002a) showed the Palomar 6 CMD drooping at the RGB-tip, which led Ortolani et al. (1995) to conclude that Palomar 6 has [Fe/H] 0.4. The droop seen at the tip of the RGB branch in the CMD of Palomar 6 could be due to its high titanium abundance which increases the line blanketing effect by TiO bands and may not due to the overall high metallicity. In particular, since the star Palomar 6 G has a low effective temperature, this effect would be large. It should be emphasized again that our [Ti/Fe] ratio measurement is very sensitive to and of the input model atmosphere and our derived titanium abundance for Palomar 6 relies on the single line measurement in a single star. As shown in Table 11, an uncertainty of = 200 K leads to the uncertainty of almost 0.3 dex in the [Ti/Fe] ratio. Our titanium abundance of Palomar 6 relied upon a very strong single line measurement and the microturbulent velocity was not measured in an appropriate way. A change of 0.5 km sec-1 in the microturbulent velocity results in 0.3 dex change in the [Ti/Fe] ratio.
5 DISCUSSIONS
5.1 Is Palomar 6 part of the inner halo or the bulge populations?
Globular clusters do not define a single homogeneous population with a single history and, in particular, the Galactic central regions may contain globular clusters belonging to various populations. The globular clusters near the Galactic center may provide the means by which we can improve our understanding of the processes and chronology involved in the formation of the Galactic halo and the bulge. Carney, Latham, & Laird (1990) and Wyse & Gilmore (1992) argued that the halo is the ancestor to the bulge. The idea is that the halo is metal-poor because star formation terminated early by the loss of gas from the halo, and the low angular momentum of the halo means the gas should have largely collected dissipatively into the central regions (i.e., into the bulge). However, the definition of the bulge clusters currently being used is rather ambiguous mainly due to lack of complete kinematical information. Minniti (1995a) drew attention to a set of clusters that may be associated with the Galaxy’s bulge, distinct from the central concentration of the spheroidal halo clusters. In practice, the metal-rich clusters located within a few kpc from the Galactic center are usually categorized as the bulge population, but halo clusters formed in the metal-rich tail may also exist in the Galactic central regions. In a recent study, Dinescu et al. (2003) discussed the population status of seven globular clusters with 3.2 kpc based on their actual space velocities. One of their intriguing findings is that the metal-rich globular cluster NGC 6316 is most likely a halo cluster, in spite of its high metallicity, [Fe/H] = 0.55. Unfortunately, Palomar 6 does not as yet have a measurement of its proper motion. To assign it to the disk, bulge, or halo populations, we will have to rely only upon its metallicity, position, and radial velocity.
In Figure 13, we show the metallicity distribution and the kinematical properties of globular clusters within 3 kpc from the Galactic center using data available from Harris (1996). In addition, we adopt the recent metallicity measurements by Origlia, Rich, & Castro (2002) for Liller 1, Carretta et al. (2001) for NGC 6528, and Cohen et al. (1999) for NGC 6553. The metallicity distribution shows two peaks at [Fe/H] 1.3 and 0.4, suggesting that at least two distinct populations exist in the Galactic central regions. The bottom panel shows a plot of versus for the metal-rich and metal-poor clusters using the relations given by Frenk & White (1980), corrected by Zinn (1985), where is the radial velocity observed at the Sun’s position by an observer at rest with respect to the galactic center and is the angle between the line of sight and the direction of Galactic rotation at the cluster (Zinn 1993). The and values are listed in Table 13. In the Figure, the mean rotation velocity, , is given by the slope of the straight line, and the line-of-sight velocity dispersion, , is given by the standard deviation of the points about the line. The fit for the metal-poor clusters ([Fe/H] 1.0) is represented by the solid line and that for the metal-rich clusters ([Fe/H] 1.0) by the dashed line. The metal-poor clusters have = +111 57 km sec-1 and = 137 31 km sec-1, while the metal-rich clusters have = +89 36 km sec-1 and = 99 23 km sec-1. The rotational velocity solution of the metal-rich clusters with the lower mass bar-like kinematics is also shown in the Figure by the dotted line (Burkert & Smith 1997). There is no distinctive difference in mean kinematics between the two metallicity regimes, but the metallicity distribution shows that if there are two different groups based on different mean metallicities, the overlap in [Fe/H] is considerable. We can, nonetheless, still employ kinematics as a discriminant since more disk-like or bulge-like clusters will, on average be closer to the mean rotational solutions than would halo clusters. The observed radial velocity of Palomar 6 deviates by over 150 km sec-1 from the rotational velocity solutions, suggesting that Palomar 6 may have halo kinematics. We believe that Palomar 6 is probably a globular cluster that is more probably classified as belonging to the halo population rather than a bulge or disk population, based on both its kinematics and its relatively low metallicity. Like other halo clusters, its high [/Fe] ratio suggests that the star formation rate was very high when the cluster formed. Additional spectroscopic studies of high and low metallicity and high and low velocity clusters in the inner Galaxy will be needed to unravel the complex histories of star formation.
5.2 The silicon and the titanium abundances of Palomar 6
As we discussed above, the measurement of -element abundances of globular clusters provides important information regarding relative ages, in the sense that the enhanced value of [/Fe] ratios indicates the high star formation rate and old age of the system. In Figure 14, we show the silicon and the titanium abundances of globular clusters as a function of metallicity (see Lee & Carney 2002b and references therein). In the Figure, our [Ti/Fe] ratio of Palomar 6 appears to be 0.2 dex higher than the mean value of [Ti/Fe] of other globular clusters, [Ti/Fe] 0.3 dex. However, given the uncertainty of Palomar 6 [Ti/Fe] value, the significance of this difference is hard to access without further data. The enhanced -element abundances of Palomar 6 suggest that Palomar 6 must have formed very quickly, in spite of its high metallicity. If true, the Galactic inner halo must have experienced a very rapid chemical enrichment history.
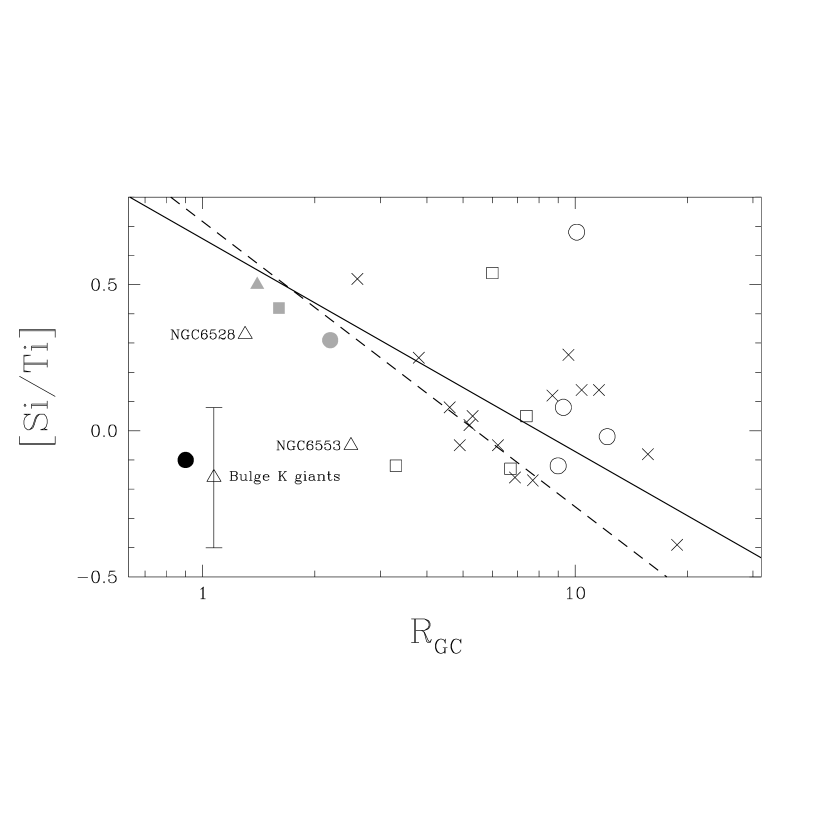
Figure 15 shows [Si/Ti] ratio versus Galactocentric distance, , of globular clusters. The bisector linear fit to the old halo clusters (18 clusters) and that to the old halo clusters with 8 kpc (12 clusters) are also shown in the Figure. As we mentioned above, Lee & Carney (2002b) claimed that [Si/Ti] ratios of the old halo globular clusters are anticorrelated with Galactocentric distances, in the sense that the silicon abundance increases and the titanium abundance decreases with Galactocentric distances. They argued that the contributions from SNe II events with different progenitor masses could explain such a gradient. In the Figure, the [Si/Ti] ratio of Palomar 6 does not appear to follow the trend claimed by Lee & Carney (2002b) and, further, the [Si/Ti] ratio of Palomar 6 appears to be lower than those of metal-rich bulge clusters NGC 6528 ([Fe/H] = +0.07, Carretta et al. 2001) and NGC 6553 ([Fe/H] = 0.16, Cohen et al. 1999). The [Si/Ti] ratio of Palomar 6 appears to agree with those of the metal-rich bulge K giants by McWilliam & Rich (1994). This may suggest that the chemical enrichment history of Palomar 6 was more complex than those of other clusters in the Galactic central regions. Again, given the uncertainty in the Palomar 6 [Si/Ti] value, the significance of this difference is hard to assess without further data.
6 SUMMARY
In this paper, we have discussed high-resolution infrared echelle spectroscopy for the globular clusters Palomar 6 and M71. Our mean heliocentric velocity of Palomar 6 is +180.6 3.2 km sec-1 and is 20 km sec-1 smaller than that of Minniti (1995b). Contrary to the recent results using low resolution spectroscopy, our results have shown that Palomar 6 has an intermediate metallicity with [Fe/H] = 1.0 0.1 and is slightly more metal-poor than M71. Our estimated uncertainties in the surface temperatures, gravities, and microturbulent velocities for the three stars we have studied will not affect our derived [Fe/H] value by more than 0.2 dex. We believe that previous estimates, based on lower resolution, lower-S/N spectra were affected by unrecognized molecular line blanketing or by stars that are not members of the cluster. The [/Fe] ratio of Palomar 6 appears to be enhanced by 0.3 – 0.5 dex in spite of its high metallicity, suggesting that the Galactic inner halo must have experienced a very rapid chemical enrichment history.
References
- (1)
- (2) Alonso, A., Arribas, S., & Martinez-Roger, C. 1999, A&AS, 140, 261
- (3)
- (4) Anders, E., & Greevesse, N. 1989, Geochim. Cosmochim. Acta, 53, 197
- (5)
- (6) Asplund, M. 2003, astro-ph/0302407
- (7)
- (8) Bessell, M. S., Castelli, F., & Plez, B. 1998, A&A, 333, 231
- (9)
- (10) Bica, E., Claria, J. J., Piatti, A. E., & Bonatto, C. 1998, A&AS, 131, 483
- (11)
- (12) Brown, J. A., Tomkin, J., & Lambert, D. L. 1983, ApJ, 265, 93
- (13)
- (14) Brown, J. A., Wallerstein, G., & Oke, J. B. 1990, AJ, 100, 1561
- (15)
- (16) Burkert, A., & Smith, G. H. 1997, ApJ, 474, L15
- (17)
- (18) Carney B. W., Latham, D. W., & Laird, J. B. 1990, AJ, 99, 572
- (19)
- (20) Carr, J. S., Sellgren, K., & Balachandran, S. C. 2000, ApJ, 530, 307
- (21)
- (22) Carretta, E., Cohen, J. G., Gratton, R. G., & Behr, B. 2001, AJ, 122, 1469
- (23)
- (24) Cohen, J. G., Gratton, R. G., Behr, B., & Carretta, E. 1999, ApJ, 523, 739
- (25)
- (26) Cornide, M., & Rego, M. 1984, Ap&SS, 105, 55
- (27)
- (28) Da Costa, G. S., & Armandroff, T. E. 1995, AJ, 109, 2533
- (29)
- (30) Davidge, T. J., & Simons, D. A. 1991, AJ, 101, 1720
- (31)
- (32) Dinescu, D., Girard, T. M., Van Altena, W. F., López, C. E. 2003, AJ, 125, 1373
- (33)
- (34) Faber, S. M., Friel, E. D., Burstein, D., & Gaskell, C. M. 1985, ApJS, 57, 711
- (35)
- (36) Frenk, C. S., & White, S. D. M. 1980, MNRAS, 199, 565
- (37)
- (38) Frogel, J. A., Persson, S. E., & Cohen, J. G. 1979, ApJ, 227, 499
- (39)
- (40) Frogel, J. A., Persson, S. E., & Cohen, J. G. 1981, ApJ, 246, 842
- (41)
- (42) Frogel, J. A., Persson, S. E., & Cohen, J. G. 1983, ApJS, 53, 713
- (43)
- (44) Gray, D. F. 1977, ApJ, 218, 530
- (45)
- (46) Greene, T. P., Tokunaga, A. T., Toomey, D. W., & Carr, J. B. 1993, Proc. SPIE, 1946, 313
- (47)
- (48) Harris, W. E. 1996, AJ, 112, 1487
- (49)
- (50) Hauschildt, P. H., Allard, F., Alexander, D. R., & Baron, E. 1997, ApJ, 488, 428
- (51)
- (52) Hinkle, K., Wallace, L., & Livingston, W. C. 1995 Infrared atlas of the Arcturus spectrum, 0.9-5.3 microns (San Fransico: Astronomical Society of Pacific, 1995)
- (53)
- (54) Ivans, I., Sneden, C., Kraft, R. P., Smith, G. H., Rich, R. M., & Shetrone, M. AJ, 122, 1438
- (55)
- (56) Ivans, I., Sneden, C., Kraft, R. P., Suntzeff, N. B., Smith, V. V., Langer, G. E., & Fulbright, J. P. 1999, AJ, 118, 1273
- (57)
- (58) Kim, Y. -C., Demarque, P., Yi, S. K., & Alexander, D. R. 2002, ApJS, 143, 499
- (59)
- (60) Kuchinski, L. E., Frogel, J. A., Terndrup, D. M., & Persson, S. E. 1995, AJ, 109, 1131
- (61)
- (62) Kurucz, R. L. 1994, CD-ROM 13
- (63)
- (64) Kurucz R. L., & Bell, B. 1995, CD-ROM 23, Atomic Line Data (Cambridge:SAO)
- (65)
- (66) Lambert, D., Brown, J. A., Hinkle, K. H., & Johnson, H. R. 1984, ApJ, 284, 223
- (67)
- (68) Lee, J. -W., & Carney, B. W. 2002a, AJ, 123, 3305
- (69)
- (70) Lee, J. -W., & Carney, B. W. 2002b, AJ, 124, 1511
- (71)
- (72) Luck, R. E. 1977, ApJ, 212, 743
- (73)
- (74) Malkan, M. A. 1981, in Astrophysical Parameters for Globular Clusters, IAU Colloquim No. 68, 533
- (75)
- (76) McWilliam, A. 1990, ApJS, 74, 1075
- (77)
- (78) McWilliam, A. 1997, ARA&A, 35, 503
- (79)
- (80) McWilliam, A. & Rich, R. M. 1994, ApJS, 91, 749
- (81)
- (82) Minniti, D. 1995a, AJ, 109, 1663
- (83)
- (84) Minniti, D. 1995b, A&A, 303, 468
- (85)
- (86) Norris, J. E. & Da Costa, G. S. 1995, ApJ, 447, 680
- (87)
- (88) Origlia, L., Rich, R. M., & Castro, S. 2002, AJ, 123, 1559
- (89)
- (90) Ortolani, S., Bica, E., & Barbuy, B. 1995, A&A, 296, 680
- (91)
- (92) Peterson, R. C., Dalle Ore, C. M., & Kurucz, R. L. 1993, ApJ, 404, 333
- (93)
- (94) Plez, B. 1998, A&A, 337, 495
- (95)
- (96) Ramírez, S. V., Sellgren, K., Carr, J. S., Balachandran, S. C., Blum, R., Terndrup, D. M., Steed, A. 2000, ApJ, 537, 205
- (97)
- (98) Rich, R. M. 1988, AJ, 95, 828
- (99)
- (100) Ruland, R., Holweger, H., Griffin, R., & Biehl, D. 1980, A&A, 92, 70
- (101)
- (102) Sneden, C. 1973, PhD thesis, The University of Texas at Austin
- (103)
- (104) Sneden, C., Kraft, R. P., Guhathakurta, P., Peterson, R., & Fulbright, J. 2004, AJ, 127, 2162
- (105)
- (106) Sneden, C., Kraft, R. P., Langer, G. E., Prosser, C. F., & Shetrone, M. D. 1994, AJ, 107, 1773
- (107)
- (108) Steffen, M. 1985, A&AS, 59, 403
- (109)
- (110) Stephens, A., & Frogel, J. A. 2004, AJ, 127, 925
- (111)
- (112) Tokunaga, A. T., Toomey, D. W., Call, J., Hall, D. N. B., & Epps, H. W. 1990, Proc. SPIE, 1235, 131
- (113)
- (114) Wallace, L., & Hinkle, K. 1996, ApJS, 107, 312
- (115)
- (116) Wallace, L., Livingston, W., Hinkle, K., & Bernath, P. 1996, ApJS, 106, 165
- (117)
- (118) Wheeler, J. C., Sneden, C., & Truran, J. W. 1989, ARA&A, 27, 279
- (119)
- (120) Wyse, R. F. G., Gilmore, G., & Franx, M. 1997, ARA&A, 35, 637
- (121)
- (122) Yi, S., Demarque, P., & Kim, Y. -C. 1997, ApJ, 482, 677
- (123)
- (124) Zinn, R. 1985, ApJ, 293, 424
- (125)
- (126) Zinn, R. 1993, in The Globular Cluster-Galaxy Connection, ASP Conf. Ser. Vol. 48, edited by G. H. Smith and J. P. Brodie (A.S.P., San Francisco), p. 38
- (127)
| Id.11Minniti (1995). | 22Ortolani et al. (1995). | ||||
|---|---|---|---|---|---|
| A | 8.733 | 1.543 | 0.262 | 16.94 | 4.797 |
| B | 8.541 | 1.482 | 0.269 | 16.61 | 4.989 |
| C | 9.770 | 1.456 | 0.262 | 17.11 | 3.760 |
| D | 8.855 | 1.551 | 0.284 | 16.89 | 4.675 |
| E | 9.632 | 1.462 | 0.249 | 17.18 | 3.898 |
| F | 8.267 | 1.638 | 0.322 | 17.22 | 5.263 |
| G | 8.467 | 1.646 | 0.315 | 17.27 | 5.063 |
| Id. | (Å) | Date (UT) | (sec) | S/N | |
|---|---|---|---|---|---|
| Pal 6 | A | 22395 | 24 May 1998 | 8400 | 45 |
| D | 22395 | 25 May 1998 | 4200 | 45 | |
| G | 22395 | 24 May 1998 | 5400 | 60 | |
| G | 21815 | 25 May 1998 | 4200 | 70 | |
| M71 | I-45 | 22395 | 14 July 1997 | 2100 | 40 |
| I-45 | 21815 | 14 July 1997 | 2400 | 50 | |
| I-46 | 22395 | 13 July 1997 | 2700 | 55 | |
| I-46 | 21815 | 13 July 1997 | 2400 | 50 | |
| Id. | 11This work. | 11This work. | 22Minniti (1995). | Membership |
|---|---|---|---|---|
| (km sec-1) | (km sec-1) | (km sec-1) | ||
| A | 185.3 | 4.0 | Yes | |
| B | 26.7 | 1.7 | 56.4 | No |
| C | 173.5 | 3.6 | 243.3 | Yes |
| D | 186.8 | 2.3 | 201.2 | Yes |
| E | 13.5 | 2.1 | No | |
| F | 134.5 | 3.3 | 200.0 | No |
| G | 176.7 | 2.2 | Yes | |
| Mean | 180.6 | 200.6 |
| Sun | Carr et al. | ||||||
|---|---|---|---|---|---|---|---|
| Ele. | E.P. | EW | |||||
| (Å) | (eV) | (mÅ) | |||||
| 22386.90 | Fe I | 5.033 | 229 | 0.490 | 0.481 | ||
| 22399.16 | Fe I | 5.099 | 72 | 1.275 | 1.249 | ||
| 21785.60 | Si I | 6.719 | 400 | 0.295 | |||
| 21825.63 | Si I | 6.721 | 293 | 0.030 | |||
| 21788.63 | Ti I | 1.749 | 33 | 1.265 | |||
| This work | Sneden et al. | Peterson et al. | |
|---|---|---|---|
| [Fe/H] | 0.48 0.07 | 0.47 | 0.5 |
| [Si/Fe] | 0.24 0.09 | 0.14 | 0.4 |
| [Ti/Fe] | 0.61 | 0.27 | 0.3 |
| Sun | Arcturus | |||||||
|---|---|---|---|---|---|---|---|---|
| E.P. | EW | EW | (Ti I)11Ti I abundances using the solar Ti I values in col. 4. | |||||
| (Å) | (eV) | (mÅ) | (mÅ) | |||||
| 21788.63 | 1.749 | 33 | 1.265 | 361 | 5.17 | 0.884 | ||
| 21903.31 | 1.739 | 17 | 1.600 | 316 | 5.18 | 1.210 | ||
| 22216.74 | 1.734 | 10 | 1.850 | 237 | 4.91 | 1.730 | ||
| 22239.03 | 1.739 | 11 | 1.810 | 264 | 5.05 | 1.555 | ||
| 61 UMa (G8 V) | Sge (G1 III) | Cep (K1.5 Ib) | Ori (M2 Ia) | |||||||||||||
|---|---|---|---|---|---|---|---|---|---|---|---|---|---|---|---|---|
| 522011Cornide & Rego (1984). | 544022McWilliam (1990). | 440033Luck (1977). | 354044Carr et al. (2000). | |||||||||||||
| (K) | ||||||||||||||||
| 4.711Cornide & Rego (1984). | 3.122McWilliam (1990). | 1.033Luck (1977). | 0.044Carr et al. (2000). | |||||||||||||
| 1.411Cornide & Rego (1984). | 3.122McWilliam (1990). | 2.633Luck (1977). | 3.244Carr et al. (2000). | |||||||||||||
| (km sec) | ||||||||||||||||
| (Fe I) | 7.5511Cornide & Rego (1984). | 7.3722McWilliam (1990). | 7.7533Luck (1977). | 7.5244Carr et al. (2000). | ||||||||||||
| (Ti I) | 4.8722McWilliam (1990). | 5.3133Luck (1977). | 5.0755Lambert et al. (1984). | |||||||||||||
| Id | EW | EW | EW | EW | ||||||||||||
| (Å) | (mÅ) | Sol. | Arc. | (mÅ) | Sol. | Arc. | (mÅ) | Sol. | Arc. | (mÅ) | Sol. | Arc. | ||||
| 22386.90 | Fe I | 267 | 7.52 | 257 | 7.29 | 503 | 7.79 | 577 | 7.54 | |||||||
| 22399.16 | Fe I | 105 | 7.56 | 126 | 7.50 | 320 | 7.76 | 352 | 7.42 | |||||||
| 21788.63 | Ti I | 66 | 4.97 | 4.59 | 122 | 5.19 | 4.81 | 585 | 5.65 | 5.27 | 919 | 5.42 | 5.04 | |||
| 21903.31 | Ti I | 41 | 5.02 | 4.63 | 518 | 5.71 | 5.32 | |||||||||
| 22216.74 | Ti I | 398 | 5.50 | 5.38 | 769 | 5.31 | 5.19 | |||||||||
| 22239.03 | Ti I | 32 | 5.10 | 4.84 | 433 | 5.60 | 5.34 | 792 | 5.37 | 5.12 | ||||||
| Fe I | 7.54 | 7.40 | 7.78 | 7.48 | ||||||||||||
| Ti I | 5.03 | 4.68 | 5.19 | 4.81 | 5.62 | 5.33 | 5.37 | 5.12 | ||||||||
| Ele. | E.P. | Note | ||
|---|---|---|---|---|
| (Å) | (eV) | |||
| 22386.90 | Fe I | 5.033 | 0.490 | Solar |
| 22399.16 | Fe I | 5.099 | 1.275 | Solar |
| 21785.60 | Si I | 6.719 | 0.295 | Solar |
| 21825.63 | Si I | 6.721 | 0.030 | Solar |
| 21788.63 | Ti I | 1.749 | 0.884 | Arcturus |
| Palomar 6 | M71 | ||||||
|---|---|---|---|---|---|---|---|
| (Å) | Id. | A | D | G | I-45 | I-46 | |
| 22386.90 | Fe I | 299 | 259 | 296 | 251 | 284 | |
| 22399.16 | Fe I | 130 | 142 | 120 | 152 | 160 | |
| 21785.60 | Si I | 226 | 251 | 174 | |||
| 21825.63 | Si I | 194 | 238 | 174 | |||
| 21788.63 | Ti I | 545 | 473 | 467 | |||
| Palomar 6 | M7111This work. | M7122Sneden et al. (1994). | |||||||
|---|---|---|---|---|---|---|---|---|---|
| A | D | G | I-45 | I-46 | I-45 | I-46 | |||
| 3718 | 3741 | 3667 | 4043 | 4019 | 4050 | 4000 | |||
| 0.3 | 0.3 | 0.2 | 1.0 | 1.0 | 0.8 | 0.8 | |||
| 2.00 | 2.00 | 2.00 | 2.00 | 2.15 | 2.00 | 2.15 | |||
| [Fe/H] | 1.0 0.1 | 1.0 0.1 | 1.0 0.1 | 0.9 0.1 | 0.8 0.1 | 0.78 0.04 | 0.79 0.06 | ||
| [Si/Fe] | +0.4 0.0 | +0.3 0.1 | 0.1 0.1 | 0.38 0.06 | |||||
| [Ti/Fe] | +0.5 | +0.6 | +0.4 | +0.56 0.06 | +0.47 0.07 | ||||
| (+200 K) | (+0.2) | (+0.5 km/s) | |
|---|---|---|---|
| [Fe/H] | +0.10 | +0.05 | 0.14 |
| [Si/Fe] | 0.12 | 0.05 | +0.02 |
| [Ti/Fe] | +0.29 | 0.03 | 0.33 |
| ID | [Fe/H] | |||
|---|---|---|---|---|
| (kpc) | (km sec-1) | |||
| Terzan 3 | 0.73 | 2.4 | 0.975 | 184.92 |
| NGC 6235 | 1.40 | 2.9 | 0.085 | 94.77 |
| NGC 6256 | 0.70 | 2.1 | 0.808 | 140.45 |
| NGC 6266 (M62) | 1.29 | 1.7 | 0.624 | 84.90 |
| NGC 6273 (M19) | 1.68 | 1.6 | 0.584 | 133.75 |
| NGC 6287 | 2.01 | 1.7 | 0.052 | 275.91 |
| NGC 6293 | 1.99 | 1.4 | 0.413 | 150.35 |
| NGC 6304 | 0.59 | 2.1 | 0.291 | 113.33 |
| NGC 6325 | 1.17 | 2.0 | 0.089 | 45.09 |
| NGC 6333 (M9) | 1.72 | 1.7 | 0.975 | 262.87 |
| NGC 6342 | 0.65 | 1.7 | 0.792 | 147.42 |
| NGC 6355 | 1.50 | 1.0 | 0.070 | 167.61 |
| Terzan 2 | 0.40 | 0.9 | 0.586 | 104.59 |
| Terzan 4 | 1.60 | 1.4 | 0.445 | 55.27 |
| HP 1 | 1.50 | 0.8 | 0.516 | 53.20 |
| Liller 1 | 0.30 | 2.6 | 0.273 | 41.21 |
| Terzan 1 | 0.35 | 1.8 | 0.186 | 35.57 |
| Ton 2 | 0.50 | 1.4 | 0.988 | 212.01 |
| NGC 6401 | 1.12 | 0.8 | 0.843 | 39.99 |
| Palomar 6 | 1.08 | 0.9 | 0.343 | 200.22 |
| Terzan 5 | 0.28 | 0.7 | 0.809 | 67.79 |
| NGC 6440 | 0.34 | 1.3 | 0.919 | 36.37 |
| Terzan 6 | 0.50 | 1.6 | 0.132 | 130.21 |
| Terzan 9 | 1.00 | 0.6 | 0.866 | 83.81 |
| NGC 6522 | 1.44 | 0.6 | 0.547 | 7.09 |
| NGC 6528 | 0.07 | 1.3 | 0.146 | 199.37 |
| NGC 6541 | 1.76 | 2.2 | 0.816 | 202.01 |
| NGC 6553 | 0.16 | 2.5 | 0.294 | 24.90 |
| NGC 6558 | 1.44 | 1.0 | 0.043 | 186.84 |
| NGC 6569 | 0.86 | 1.2 | 0.103 | 16.67 |
| NGC 6624 | 0.42 | 1.2 | 0.976 | 74.51 |
| NGC 6626 (M28) | 1.45 | 2.6 | 0.432 | 58.22 |
| NGC 6638 | 0.99 | 1.6 | 0.929 | 59.40 |
| NGC 6637 (M69) | 0.71 | 1.6 | 0.451 | 55.80 |
| NGC 6642 | 1.35 | 1.6 | 0.980 | 8.05 |
| NGC 6652 | 0.96 | 2.4 | 0.146 | 96.84 |
| NGC 6681 (M70) | 1.51 | 2.1 | 0.436 | 240.28 |
| NGC 6717 | 1.29 | 2.3 | 0.941 | 82.76 |
| NGC 6723 | 1.12 | 2.6 | 0.023 | 86.44 |