The applications of the MHD Alfvén wave oscillation model for kHz quasi-periodic oscillations
In this paper, we improve the previous work on the MHD Alfvén wave oscillation model for the neutron star (NS) kHz quasi-periodic oscillations (QPOs), and compare the model with the updated twin kHz QPO data. For the 17 NS X-ray sources with the simultaneously detected twin kHz QPO frequencies, the stellar mass M and radius R constraints are given by means of the derived parameter A in the model, which is associated with the averaged mass density of star as , and we also compare the M-R constraints with the star equations of states. Moreover, we also discuss the theoretical maximum kHz QPO frequency and maximum twin peak separation, and some expectations on SAX J1808.4-3658 are mentioned, such as its highest kHz QPO frequency 870 (Hz), which is about 1.4-1.5 times less than those of the other known kHz QPO sources. The estimated magnetic fields for both Z sources (about Eddington accretion rate ) and Atoll sources () are approximately G and G respectively.
Key Words.:
accretion: accretion disks – stars:neutron – binaries: close – X-rays: stars1 Introduction
The Rossi X-Ray Timing Explorer (RXTE) has observed the kilo-Hertz quasi-periodic oscillations (kHz QPOs) in the X-ray flux in about 25 accreting neutron stars in low-mass X-ray binaries (LMXBs), and the twin peak kHz QPOs, the upper and lower frequencies ( and ), are usually shown in the Fourier power spectrum (e.g., van der Klis 2000, 2005, 2006 for the recent reviews). Remarkably, the ranges of kHz QPO frequencies are almost homogeneous at about 200 Hz - 1300 Hz for both the less luminous Atoll sources and the bright Z sources (on the definition of Atoll and Z, see Hasinger & van der Klis 1989), and they increase with the inferred mass accretion rate, which implies that the kHz QPO mechanisms should be related to the common properties of both classes of sources (e.g., van der Klis 2000, 2005, 2006; Belloni et al. 2005; Zhang et al. 2006a). Furthermore, it is also found that the separation of twin kHz QPO peaks is not a constant and usually decreases with the mass accretion rate (e.g., Méndez & van der Klis 1999; van der Klis 2000, 2006). However, it is found that the peak separations increase with the accretion rate when the kHz QPO frequencies are low in Cir X-1 (Boutloukos et al. 2006) and in 4U 1728-34 (Migliari et al. 2003), which supports the nonlinear correlations between the twin kHz QPO peaks (e.g. Zhang et al. 2006a), and it has been implied by the Alfvén oscillation model by Zhang (2004) and relativistic precession model by Stella & Vietri (1999). Moreover, the kHz QPO frequencies also follow the rather tight correlations between themselves and with the other timing features of the X-ray emissions (see, e.g., Zhang et al. 2006a; Psaltis et al. 1998; Psaltis et al. 1999ab; Stella et al. 1999; Belloni et al. 2002; Titarchuk & Wood 2002), and the ratios between twin kHz QPO peaks systematically decrease with the frequency with the averaged ratio value of about 1.5 (Zhang et al. 2006a).
In order to account for the mechanisms of twin kHz QPO phenomena, some viable models have been proposed. At the early stage of discovery of kHz QPOs, the sonic-point beat-frequency model is proposed (see, e.g., Miller at al. 1998), which predicts a constant at the stellar spin frequency, however, with the further observations, the simple beat model is inadequate for the varied kHz QPO separations. Instead, in the developed sonic-point model by Lamb & Miller (2001), the authors consider the disk flow at the spin-resonant radius to be smooth or clumped to interpret why the occurrence of kHz QPO pair separation is close to spin frequency as detected in XTE J1807-294 (see, e.g. Linares et al. 2005; Zhang et al. 2006b) or half spin frequency as detected in SAX J1808.4-3658 (see, e.g. Wijnands et al. 2003)
Later on, the relativistic precession model is proposed by Stella and Vietri (1999), in which the upper kHz QPO frequency is identified with the Keplerian frequency of an orbit in the disk and the lower kHz QPO frequency with the periastron precession of that orbit, and the varied can be consistently explained in this model. More recently, Rezania and Samson (2005) propose a model to explain the kHz QPOs based on the interaction of accreting plasma with the neutron star magnetosphere, where the matter is accelerated by the gravitational pull of the compact object and hits the star magnetosphere with a sonic or supersonic speed. Basically the conclusions of this model are consistent with the observed data for the appropriate choices of the parameters.
Moreover, Titarchuk et al. (1998), Osherovich & Titarchuk (1999ab) and Titarchuk & Osherovich (1999) have developed the alternative models. They require the lower kHz QPO frequency to be due to the Keplerian frequency of matter in the disk and the upper kHz QPO frequency to be the hybrid between the lower kHz QPO frequency and the stellar spin frequency. Nonetheless, there have not yet been any agreements on the origins of the QPOs in neutron star and black hole binary X-ray sources, nor on what physical parameters determine their frequencies, which have also been identified with various characteristic frequencies in the inner accretion flows (e.g. Abramowicz et al. 2003ab; Abramowicz 2005; Kluzniak et al 2004; Lee et al. 2004; Rebusco 2004; Rebusco & Abramowicz 2006; Petri 2005; Horak & Karas 2006).
This paper is an improved one of the previous work on the MHD Alfvén wave oscillation mechanism for the NS kHz QPOs (Zhang 2004), where we consider the radial dependence of the accretion flow velocity, and the applications have been done by comparing the model’s predictions with the updated kHz QPO data.
The paper is organized as follows: In section 2, the overview and scenario of the model are described, and the derivations of kHz QPO frequencies are given. The further applications of model are presented in section 3. The conclusions and consequences are summarized in the final section. As the conventional usage, the Newtonian gravitational constant G and the speed of light c=1 are exploited.
2 The overview of the improved model
The previous model for the NS kHz QPOs proposed by Zhang (2004) does not mention the excitation mechanism of Alfvén wave oscillation to modulate the X-ray flux to produce the observed kHz QPOs. Therefore, in this paper we try to answer these questions. To straightforwardly grasp our point of views, an imagined geometrical illustration of the magnetosphere and accretion disk associated with our model is plotted in FIGURE 1.
2.1 MHD wave and its excitation in the accretion flow
In MHD, the Alfvén wave is a transverse wave and propagates along the magnetic field line, the effects of which have been studied in solar physics to interpret the detected quasi-periodic oscillation of several minutes in coronal loops (e.g., Roberts 2000; Nakariakov et al. 1999; Aschwanden et al. 1999). As known, the coronal loops may be set into oscillations with various modes, such as a kink mode (Roberts 2000 for a review), thus we assume the similar oscillations to occur in the accretion disks with the loop length of circumference at the disk orbit radius r. As pointed out, the MHD turbulence by the shear flow in the accretion disk (e.g., Ruediger & Pipin 2000) will trigger the strong variation of plasma energy density and ignite the shear Alfvén wave motion along the orbit. In a wave length of circular perimeter, the intensely excited shear Alfvén wave can dedicate to the observed X-ray flux fluctuations, which is then responsible for the observed kHz QPO phenomena.
However, the propagation of the Alfvén wave will arise its damping because of the dissipation by the X-ray emission and the viscous interactions in MHD, which may account for why sometimes we only measure a single kHz QPO or nothing. From the conventional accretion disk prescription, the accretion flow in the equatorial plane of disk will drag the polar field lines into the azimuthal direction, and it is often assumed that the field strength of the azimuthal component is comparable to that of the unperturbed polar field in the equatorial plane. i.e. (e.g., Ghosh & Lamb 1979; Shapiro & Teukolsky 1983).
2.2 On the preferred radius and the coherence
On the preferred radius r, it is supposed to be a “coherence” location at where the characteristic Alfvén velocity (frequency) calculated by the plasma mass density of quasi-spherical flow coincides with the Keplerian velocity (frequency), i.e., . We assume that at this radius there is a resonance between the Alfvén wave frequency and Keplerian orbital frequency.
From the definition, at the Alfvén radius , the Alfvén velocity is the free fall velocity, expressed as (e.g., Shapiro & Teukolsky 1983),
| (1) |
where is the dipole magnetic field and
| (2) |
is the plasma mass density defined by the spherical accretion with the free fall velocity (r) or the Keplerian velocity (r),
| (3) |
Therefore, at the preferred radius , where is an introduced parameter, the Alfvén velocity equals the Keplerian velocity, thus,
| (4) |
the ‘coherence’
radius is defined by the condition of
or .
2.3 The identifications of twin kHz QPO frequencies
Therefore, at the preferred radius, the Alfvén wave frequency is
| (5) |
which we identify to the upper kHz QPO frequency (see also Zhang 2004), or written as
| ν_2 | ||||
with the parameters X=R/r and
where
and are the stellar radius R and mass M
in the units of (cm) and solar masses, respectively.
It is noted that the quantity is a measurement of the averaged
mass density of star, expressed as
.
The reasons for introducing the “non-Keplerian factor” in
Eq.(2.3) come from the facts of the complicated physical environments,
which do not satisfy the ideal conditions for applying the Keplerian frequency,
i.e. the point mass orbiting around a central gravitational source
in a vacuum. The modifications to the Keplerian frequency will be
taken into account if the following situations are considered:
(a) the influence by rotation or the modification from Kerr spacetime
to Schwarzschild spacetime;
(b) the consideration of the factual environment around star deviating
from the ideal situation of a test particle motion in a vacuum;
(c) the plasma blob moving in a MHD with the strong magnetic
field.
In principle, this “non-Keplerian factor” should be not
a multiplicative constant. For instance, it could depend upon the
radius in the disk at which the QPO is produced, and hence upon
the frequency itself. However, we have to stress that it is just
the reason of simplicity to chose it as a constant.
In practice, for the mathematical convenience, we still take to
process the calculations, and finally
the real parameter A can be obtained through dividing it by
the “non-Keplerian factor” , the implication of
which is discussed in the last section.
Equivalently, the NS radius can be expressed by the parameters A and m,
| (7) |
Furthermore, on the formation scenario of the lower kHz QPO frequency (), we have the following arguments. The accreted materials accumulated on the polar cap will become denser by a factor of ratio of the spherical area to the polar cap area. These denser materials will flow equator-ward and pass through the perpendicular field lines by the instabilities, so this flow is influenced by the Lorentz force. The all denser materials will be expelled out through the magnetic tunnel and enter into the transitional zone near the ‘coherence’ radius because the flow along the field lines is force free and will not experience the Lorentz force. Henceforth, we ascribe the Alfvén wave frequency calculated by the denser mass density of plasma formed on the polar cap to be the lower kHz QPO frequency. For the mathematical convenience, it is presumed that both the upper and lower kHz QPOs occur at the same radius. Thus, the lower kHz QPO frequency is described below,
| (8) |
where the Alfvén velocity is defined by the mass density expelled from the polar cap,
| (9) |
with
| (10) |
where the magnetic polar cap area is obtained as (Zhang & Kojima 2006),
| (11) |
with
| (12) |
where is the open angle of the last field line to close at radius r. As an approximation, the polar cap area is usually written as if (see e.g. Shapiro & Teukolsky 1983, P.453). Henceforth, if we ascribe the upper and lower kHz QPO frequencies to the two Alfvén wave frequencies with different mass densities described in Eqs.(2.3) and (8), then we have
| (13) |
After considering Eq.(1) and Eq.(11) with the parameter definition X R/r, Eq.(13) gives
| (14) |
For convenience, the ratio of the twin kHz QPO frequencies is obtained to be,
| (15) |
which only depends on the position parameter X R/r where X-ray flux responsible for kHz QPOs emits and is independent of the averaged mass density parameter A and mass M. Furthermore, the twin kHz QPO separation is written as,
| (16) |
which is not a constant with the variation of or .
From Eq.(2.3) and Eq.(14), if the twin kHz QPO frequencies are known simultaneously, then the values of A and X can be determined. For the detected sample sources listed in TABLE I (see e.g. van der Klis 2000, 2006; Belloni et al. 2005; data are provided by T. Belloni, M. Méndez and D. Psaltis), such as Sco X-1 (van der Klis et al. 1997; Méndez & van der Klis 2000), 4U160852 (Méndez et al. 1998ab) , 4U1735-44 (Ford et al. 1998) and 4U172834 (Méndez & van der Klis 1999).
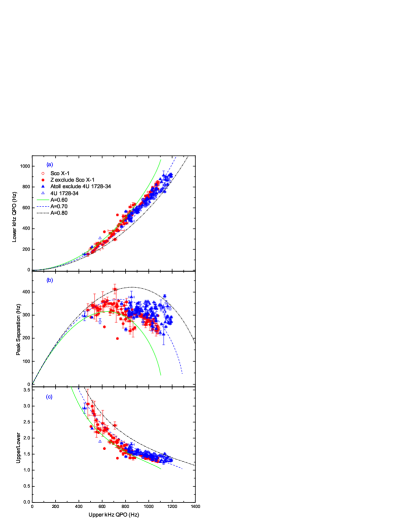
The comparisons of the model’s conclusions to the well detected kHz QPO sample sources are shown in FIGURE 2, and the agreement between the model and the observed QPO data is quite good for the selected ranges of NS parameters A=0.6, 0.7 and 0.8. In FIGURE 2b, we find that increases with if (A/0.7) Hz and decreases with if (A/0.7) Hz. In addition, the twin kHz QPO ratio (FIGURE 2c) follows the decreasing tendency with .
3 The applications of the model
To inspect the model’s predictions, we demonstrate some applications of the model in the following.
3.1 The constrain conditions of NS mass and radius
The NS mass constrain condition by the kHz QPOs has been given by Miller et al (1998) and Zhang et al (1997) through assuming that the accretion disk radius of showing kHz QPOs is bigger than the innermost stable circular orbit (ISCO: three Schwarzschild radii), i.e., the maximum observed frequency is presumed to be the Keplerian frequency at ISCO with the condition that the stellar surface is enclosed by ISCO,
| (17) |
From Eq.(7), the new radius constrain condition is obtained if the mass constrain condition is known, therefore we exploit the generally assumed NS mass lower limit 1.0 from the astrophysical argument and its upper limit condition Eq.(17) to set the radius constrain conditions, respectively,
| (18) |
and
| (19) |
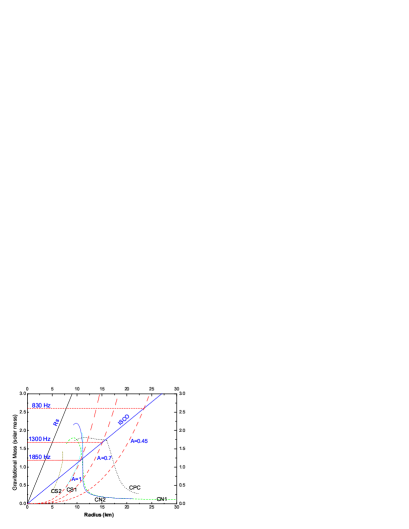
In Eq.(19), the radius is constrained by A and , or equivalently by the twin kHz QPOs. Furthermore, the NS mass and radius relations and their constrain conditions are calculated for the 17 known sources whos twin kHz QPOs are simultaneously detected, which are listed in TABLE I. In Figure 3, the mass-radius relations inferred from the values of parameter A have been plotted, and it is found that, for the conventionally accepted NS mass lower limit , there exists difficulty in accordance with the many modern equations of states (EOSs) if the parameter A is too low, for instance for SAX J1808.4-3658 (see TABLE I). In general, the lower the value of A, the more difficult it is to reconcile the M-R relations with the realistic EOSs of stars. The situation can be altered if the introduced ‘non-Keplerian factor’ 1, which makes the parameter A increased.
3.2 The maximum twin kHz QPO frequencies and their separations
The theoretical maximum frequency separation can be calculated from Eq.(16) by vanishing the variation of respect to X, , where we obtain , , and . If is lower (higher) than 750 (A/0.7) , then will increase (decrease) with . In the recent observations of 4U 1728-34 (Migliari et al 2003), the twin simultaneously detected kHz QPO frequencies are found at the central frequency (Hz) and (Hz) ( (Hz)), so this is the first detected event for a significant decrease of kHz QPO peak separation towards low frequencies, however, which is qualitatively consistent with our model’s prediction. Nonetheless, the maximum values of twin kHz QPO frequencies coincide and occur at X=1 where the preferred radius equals the stellar radius in case the ISCO is inside the star, = , namely
| (20) |
In TABLE I, the theoretical maximum kHz QPO frequencies of 17 kHz QPO sources are listed, and the averaged values of A and the maximum position parameter are given for both the Z and Atoll sources, which are, respectively, =0.66 and =0.87 () for Z sources, and =0.74 and =0.9 () for Atoll sources. However, we currently cannot figure out what physical mechanisms arise these systematical differences between the Z and Atoll sources. The inequality tells us the fact that the accretion disk does not reach the stellar surface, so it is likely that the ISCO prohibits the disk from arriving at the stellar surface. If this scenario is plausible, we can conclude that the ISCOs of almost all sources in TABLE I locate outside the stars and the estimated positions of their masses and radii should appear above ISCO line in M-R diagram shown in FIGURE 3. Interestingly, the one unusual case is the Atoll source 4U 0614+09 (e.g., van Straaten et al 2000; van der Klis 2000, 2006), and its parameter is inferred from the simultaneously detected twin kHz QPOs, which implies its maximum upper (lower) kHz QPO frequency to be about 1406 (Hz). However, from the observation, one single kHz QPO peak frequency 1330 (Hz) was detected in this source (van Straaten et al 2000; van der Klis 2000, 2006), showing , thus this detected single frequency may be near the maximum kHz QPO saturation frequency, showing the X-ray spectrum information near the stellar surface, the confirmation of which needs the further proposal and analysis of this source.
As for the level-off or frequency saturation of kHz QPO, it has been paid much attention since the early discovery of kHz QPOs, which is ascribed to the occurrence of ISCO or stellar surface (e.g., Zhang et al 1998; Kaaret et al 1999; Miller 2004; Swank 2004). However, from our model, if , the saturation frequency would occur at ISCO with the maximum upper kHz QPO frequency (Hz) (see also, e.g. Miller et al 1998; Miller 2004); if , the saturation frequency would occur at the stellar surface R with (Hz). Therefore, the model inferred maximum positions of showing the kHz QPOs satisfy (see TABLE I) for the simultaneously detected kHz QPO sources, which implies that either their ISCOs appear outside stars or the unclear mechanisms diminish the kHz QPO X-ray spectra just above the stellar surface, which needs the further investigations.
3.3 The estimations of magnetic field strengths of NSs in Z and Atoll sources
The estimation of the NS magnetic field strength can be given by the definition of its magnetosphere (see, e.g. Shapiro & Teukolsky 1983), or described by the accretion induced magnetic evolution model (see, e.g. Zhang & Kojima 2006; Cheng & Zhang 1998),
| (21) |
| (22) |
where is the magnetosphere radius defined by the long-term accretion rate and is Eddington limited accretion rate. kHz QPOs are assumed to be produced around with the variation of the instantaneous accretion rate, thus should be comparable to the averaged position parameter , i.e. , which can be estimated by Eq.(2.3) as
| (23) |
where is the averaged value of the detected upper kHz QPO of Z (870 Hz) or Atoll (980 Hz) sources and both sources share the homogeneous kHz QPO distributions (see, e.g. Zhang et al. 2006a), therefore,
| (24) | |||||
| (25) |
So, the magnetic fields are proportionally related to the accretion rates, and for both Z sources (Eddington accretion rate ) and Atoll sources () they are about G and G respectively if and , which are consistent with the originally hinted values from the X-ray spectra of both sources (Hasinger & van der Klis 1989).
On the correlation between QPO frequency and the accretion rate, we can write it in the following by means of the definition of magnetosphere (Shapiro & Teukolsky 1983),
| (26) | |||||
| (27) |
where is a ratio of the instantaneous accretion rate to the long-term accretion rate. If the neutron star accreted , the NS magnetic field will enter into a ‘bottom state’ where the B-field is proportionally related to the accretion rate as by the accretion induced magnetic evolution model (Zhang & Kojima 2006). Thus, we obtain a unified expression of QPO frequency vs. the accretion rate for both Atoll and Z sources to be , although both sources share a diversified luminosity of even more than two magnitude orders.
4 Summaries and conclusions
In the paper, we compare the observations with the improved model for kHz QPOs, and the main conclusions are summarized in the following.
(1) The theoretical
maximum twin kHz QPO frequencies coincide and occur at
about 1295(A/0.7) (Hz) when the accreted matters to show
these QPOs clash on the NS surface, and
the maximum twin kHz QPO separation is 368 (A/0.7) (Hz).
(2) For SAX J1808.4-3658,
we find that its stellar mass density parameter A=0.47 is
about 1.5 times less than the typical values of
other kHz QPO sources with A0.7,
and we also obtain its highest kHz QPO frequency
to be 870 (Hz), which needs the proof of future detections.
(3) The averaged mass density of NS
can be described by the defined parameter A as
,
and we obtain for most of NS kHz QPO sources with
.
(4) With the derived parameter A listed in
TABLE I for the ideal case of
the “non-Keplerian factor” , the mass-radius
relation curves are plotted in FIGURE 3,
and we find that the EOSs of strange matters
(CS1 and CS2) seems to be not favorite except , resulting
in an extremely high kHz QPO frequency (Hz).
Moreover, for the generally assumed
NS mass lower limit, for instance, EOSs of
the normal neutron matters (CN1 and CN2) do not fit for
the stars in the detected kHz QPO sources
unless , corresponding to
(Hz). If the EOSs of CPC
(the star core becomes a Bose-Einstein condensate of
pions) are the possible choices, the mass and radius ranges
of these stars are from to and from
15 km to 18 km, respectively,
for A = 0.45 – 0.79. In addition, if the introduced
“non-Keplerian factor” is less than unity, for instance
, then the derived values of A in TABLE I will be
increased by a factor of about 1.4, for instance from
to , which in turn, as shown in FIGURE 3, results in a
fact that many sources listed in TABLE I may be the candidates of
strange stars (see, e.g., Cheng et al 1998; Lattimer & Prakash
2004). However, in our model it seems to be difficult to take the
star in
SAX J1808.4-3658 (its A=0.47) as a candidate of strange star as
expected by Li et al. (1999), as seen in FIGURE 3. Nevertheless, the
EOSs of stars in kHz QPO sources are still the open issues before
the physical influences of the “non-Keplerian factor” are
thoroughly settled.
(5) From the homogeneous kHz QPO distributions for both Atoll and Z
sources (see, e.g. Zhang et al. 2006a),
we conclude the NS magnetosphere scales of both sources to be similar,
which will arise the NS magnetic field to be proportionally
related to the long-term averaged accretion rate, i.e. NS in Z
source possesses a stronger magnetic field than that of Atoll
source.
Furthermore, the parameter A = 0.78 is implied by the model for KS 1731-260, corresponding to the maximum kHz QPO frequency 1443 (Hz), which is bigger than the known detected maximum value (Hz) (4U 0614+091, van Straaten et al. 2000). Moreover, the proposal for the detection of 1500 (Hz) and 1800 (Hz) QPO frequency is suggested by Miller (2004), corresponding to and in our model, respectively, so these measurements of QPOs above 1500 (Hz) therefore have excellent prospects for stronger constraints on the mass and radius relations, as well as on the models. It is claimed by Miller (2004) that a QPO frequency as high as 1800 (Hz) would be large enough to argue against all standard nucleonic or hybrid quark matter EOS, leaving only strange stars (see also FIGURE 3). Nevertheless, the proposal of detecting the QPO data at low frequency 100 (Hz) is also meaningful, by which the model is tested through inspecting vs. relation as shown in the middle panel of FIGURE 2. It is also predicted by Stella and Vietri (1999) will increase with the accretion rate if Hz, and the evidence for this has been recently detected in Cir X-1 by Boutloukos et al. (2006).
As a summary, it is remarked that our model is still a simple one, and the further improvements are still needed through considering the details of accretion flow or disk structure, where the plausible existence of the transitional layer (e.g., Titarchuk et al 1998; Titarchuk & Osherovich 2000) or the nonlinear disk resonances (e.g., Abramowicz et al. 2003ab) may be important. In addition, we have not yet considered the rotational effect of Kerr spacetime (see, e.g., Miller 2004; van der Klis 2006), the factual MHD flow velocity around star but perhaps not a Keplerian velocity of test particle, the accretion flow in a strong gravity regime, the plasma instabilities and turbulence in strong magnetic field, etc. Therefore, the considerations of above complications will improve the present version of the model.
Acknowledgements.
We thank T. Belloni, M. Méndez, D. Psaltis and M.C. Miller for providing the data files, and helpful discussions with T.P. Li, X.D. Li, J.L. Qu, S.N. Zhang, M. Abramowicz, S. Boutloukos, J. Horak, J. Homan, V. Karas, P. Rebusco and J. Petri are highly appreciated. This research has been supported by the innovative project of CAS of China. C.M. Z. thanks MPE-Garching and TIARA-NTHU for visiting supports. H.-K. C. is supported by the National Science Council through grants NSC 94-2112-M-007-002 and NSC 94-2752-M-007-002-PAE. We are very grateful for the critical comments and helpful suggestions from the anonymous referee, which advise us to thoroughly improve the quality of the paper.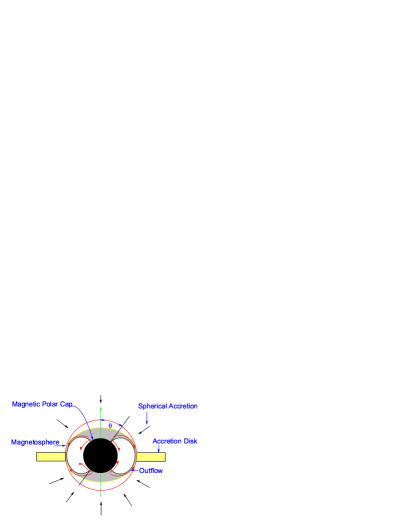
References
- (1) Abramowicz, M. A., Bulik, T., Bursa, M., & Kluźniak, W. 2003a, A&A, 404, L21
- (2) Abramowicz, M.A., Karas, V., Kluźniak, W., Lee, W.H., Rebusco, P., 2003b, PASJ, 55, 467
- (3) Abramowicz, M.A., et al. 2005, Astron. Nachr./AN 326, No.9, 864 astro-ph/0510462
- (4) Aschwanden, M. J. et al. 1999, ApJ , 520, 880
- (5) Belloni,T., Psaltis, D., & van der Klis, M., 2002, ApJ , 572, 392.
- (6) Belloni, T., Mendez, M. & Homan, J. 2005, A&A, 437, 209
- (7) Boutloukos, S., van der Klis, M., & Altamirano, D. 2006, et al., ApJ, accepted, astro-ph/0608089
- (8) Cheng, K.S., & Zhang, C.M. 1998, A&A, 337, 441
- (9) Cheng, K.S., Dai, Z.G., Wei, D.M., & Lu, T. 1998, Science, 280, 407
- (10) Ford, E.C., van der Klis, M., van Paradijs, J., Méndez, M., Wijnands, R., & Kaaret, P. 1998, ApJ , 508, L155
- (11) Ghosh, P., & Lamb, F.K. 1979, ApJ, 232, 259; 234, 296
- (12) Hasinger, G., & van der Klis, M. 1989, A&A, 225, 79
- (13) Horak, J., & Karas, V. 2006, A&A, 451, 377
- (14) Kaaret, P., Piraino, S., Bloser, P.F., Ford, E.C., Grindlay, J.E., et al. 1999, ApJ , 520, L37
- (15) Kluzniak W., Abramowicz, M.A., Kato, S., Lee, W.H., Stergioulas, N., 2004, ApJ, 603, L89
- (16) Lamb, F.K., & Miller, M.C. 2001, ApJ , 554, 1210
- (17) Lee, W.H., Abramowicz, M. A., & Kluźniak, W. 2004, ApJ, 603, L93
- (18) Lattimer, J. M., & Prakash, M. 2004, Science, 304, 536
- (19) Li, X.D., Bombaci, I., Dey, M., Dey, J., & van den Heuvel, E.P.J. 1999, Phys. Rev. Lett., 3776, 83
- (20) Linares, M., et al 2005, ApJ, 634 L2
- (21) Markwardt, C. B., Smith, E., & Swank, J. H. 2003, IAU Circ. No., 8080, 2
- (22) Méndez, M., van der Klis, M., van Paradijs, J., Lewin, W.H.G., & Vaughan, B.A. 1998a, ApJ , 494, L65
- (23) Méndez, M., van der Klis, M., Wijnands, R., Ford, E.C., van Paradijs, J., & Vaughan, B.A. 1998b, ApJ , 505, L23
- (24) Méndez, M., & van der Klis, M. 1999, ApJ , 517, L51
- (25) Méndez, M., & van der Klis, M. 2000, MNRAS, 318, 938
- (26) Migliari, S., van der Klis, M., & Fender, R. 2003, MNRAS , 345, L35
- (27) Miller, M. C., Lamb, F. K., & Psaltis, D. 1998, ApJ , 508, 791
- (28) Miller, M. C. 2002, Nature , 420, 31
- (29) Miller, M. C. 2004, to appear in the proceedings of “X-Ray Timing 2003: Rossi and Beyond”, eds. P. Kaaret, F.K. Lamb, & J.H. Swank (Melville, NY: AIP), (astro-ph/0312449)
- (30) Nakariakov, V.M., et al. 1999, Science, 285, 862
- (31) Osherovich, V. & Titarchuk, L. 1999a, ApJ, 522, L113
- (32) Osherovich, V. & Titarchuk, L. 1999b, ApJ, 523, L73
- (33) Petri, J. 2005, A&A, 439, L27
- (34) Psaltis, D., Mendez, M., Wijnands, R., Homan, J., Jonker, P., van der Klis, M., Lamb, F. K., Kuulkers, E., van Paradijs, J., & Lewin, W. H. G. 1998, ApJ , 501, L95
- (35) Psaltis, D., Wijnands, R., Homan, J., Jonker, P., van der Klis, M., Miller, M.C., Lamb, F. K., Kuulkers, E., van Paradijs, J., & Lewin, W. H. G. 1999a, ApJ , 520, 763
- (36) Psaltis, D., Belloni, T. & van der Klis, M. 1999b, ApJ, 520, 262 (astro-ph/9902130)
- (37) Rebusco, P., 2004, PASJ, 56, 553
- (38) Rebusco, P.,& Abramowicz, M. A. 2006, to appear in the proceedings of “the Einstein’s Legacy, Munich 2005”, eds., G. Hasinger, astro-ph/0601666
- (39) Rezania, V., & Samson, J. 2005, A&A 436, 999
- (40) Roberts, B. 2000, Solar Physics, 193, 139
- (41) Ruediger, G., & Pipin, V.V. 2000, A&A, 362, 756
- (42) Shapiro, S.L., & Teukolsky, S.A. 1983, Black Holes, White Dwarfs and Neutron Stars (Wiley, New York)
- (43) Stella, L., & Vietri, M. 1999, Phys. Rev. Lett., 82, 17
- (44) Stella, L., Vietri, M., & Morsink, S. 1999, ApJ , 524, L63
- Swank (2004) Swank, J. 2004, to appear in the proceedings of “X-Ray Timing 2003: Rossi and Beyond”, eds. P. Kaaret, F.K. Lamb, & J.H. Swank (Melville, NY: AIP), astro-ph/0402511
- (46) Titarchuk, L., Lapidus, I., & Muslimov, A. 1998, ApJ , 499, 315
- Titarchuk, & Osherovich (2000) Titarchuk, L. & Osherovich, V. 2000, ApJ, 537, L39
- (48) Titarchuk, L. & Wood, K.S. 2002, ApJ, 577, L23
- (49) van der Klis, M., Wijnands, A.D., Horne, K., & Chen, W. 1997, ApJ , 481, L97
- (50) van der Klis, M. 2000, ARA&A, 38, 717 (astro-ph/0001167)
- (51) van der Klis, M. 2005, Astron. Nachr./AN 326, No.9, 798
- (52) van der Klis, M. 2006, in Compact stellar X-ray sources, W.H.G. Lewin & M. van der Klis (eds.), Cambridge University Press, p. 39; (astro-ph/0410551)
- (53) van Straaten, S., Ford, E.C., van der Klis, M., Méndez, M., & Kaaret, P. 2000, ApJ , 540, 1049
- (54) Wijnands, R., van der Klis, M., Homan, J., Chakrabarty, D., Markwardt, C.B., & Morgan, E.H. 2003, Nature , 424, 44 (astro-ph/0307123)
- (55) Zhang, C.M. 2004, A&A, 423, 401 (astro-ph/0402028)
- (56) Zhang, C.M., & Kojima, Y. 2006, MNRAS, 366, 137
- (57) Zhang, C. M., Yin, H. X., Zhao, Y. H., et al. 2006a, MNRAS , 366, 1373.
- (58) Zhang, F., Qu, J. L., Zhang, C. M., et al. 2006b, ApJ , 646, 1116.
- (59) Zhang, W., Smale, A.P., Strohmayer, T.E., & Swank, J.H. 1998, ApJ , 500, L171
- (60) Zhang, W., Strohmayer, T. E., & Swank, J. H. 1997, ApJ , 482, L167
| TABLE I. Neutron star parameters of detected kHz QPO sources |
| Source∗ | A(1) | R(2) | m(3) | R(4) | (5) | (6) | |
| (km) | () | (km) | (Hz) | (Hz) | |||
| Millisecond pulsar | |||||||
| SAXJ 1808.4-3658a | 0.47 | 16.9 | 1.0-2.99 | 16.8-24.4 | 870 | 725 | 0.90 |
| Z source | |||||||
| Sco X-1 | 0.66 | 13.3 | 1.0-2.05 | 13.3-17.0 | 1221 | 1075 | 0.93 |
| GX 340+0 | 0.64 | 13.5 | 1.0-2.62 | 13.5-19.0 | 1184 | 840 | 0.80 |
| GX 349+2 | 0.68 | 13.0 | 1.0-2.23 | 13.1-17.2 | 1258 | 985 | 0.86 |
| GX 5–1 | 0.63 | 13.8 | 1.0-2.49 | 13.8-18.8 | 1166 | 890 | 0.84 |
| GX 17+2 | 0.67 | 13.2 | 1.0-2.02 | 13.3-16.8 | 1240 | 1087 | 0.93 |
| Cyg X-2 | 0.70 | 12.8 | 1.0-2.19 | 12.8-16.7 | 1295 | 1005 | 0.85 |
| Atoll source | |||||||
| 4U 0614+09 | 0.76 | 12.2 | 1.0-1.65 | 12.1-14.4 | 1406 | 1330 | 0.97 |
| 4U 1636–53 | 0.74 | 12.4 | 1.0-1.79 | 12.1-15.1 | 1369 | 1230 | 0.94 |
| 4U 160852 | 0.69 | 12.9 | 1.0-2.00 | 12.8-16.2 | 1277 | 1099 | 0.90 |
| 4U 1702–43 | 0.75 | 12.3 | 1.0-2.03 | 12.2-15.6 | 1388 | 1085 | 0.85 |
| 4U 172834 | 0.77 | 12.0 | 1.0-1.88 | 11.9-14.8 | 1425 | 1173 | 0.88 |
| KS 1731–260 | 0.78 | 11.9 | 1.0-1.83 | 11.9-14.6 | 1443 | 1205 | 0.89 |
| 4U 173544 | 0.73 | 12.5 | 1.0-1.91 | 12.4-15.5 | 1351 | 1150 | 0.90 |
| 4U 1820–30 | 0.73 | 12.5 | 1.0-2.00 | 12.4-15.8 | 1351 | 1100 | 0.88 |
| 4U 1916–053 | 0.73 | 12.5 | 1.0-2.08 | 12.4-16.0 | 1351 | 1058 | 0.85 |
| XTE J2123–058 | 0.72 | 12.6 | 1.0-1.93 | 12.5-15.8 | 1332 | 1140 | 0.91 |
| *: The sources are chosen from those that the twin kHz QPOs are detected simultaneously (van der Klis 2000, 2006; the original references therein), then 4U 1915–05 is not included because its two incompatible values of are reported (van der Klis 2006). a: Wijnands et al. 2003. (1): Calculated by the simultaneously detected twin kHz QPO data. (2): Obtained by Eq.(7). (3): Estimated by the generally assumed NS mass lower limit 1.0 and by the constrain condition (Miller et al. 1998). (4): Obtained by Eq.(18) and Eq.(19). (5): (Hz) is the possible maximum kHz QPO frequency. (6): is the detected maximum kHz QPO frequency. (7): the detection inferred maximum X position, . |