Late-type field stars in the RASS at high galactic latitude
Abstract
We present results of an investigation on a high-galactic latitude sample of late-type field stars selected from the ROSAT All-Sky Survey (RASS). The sample comprises 200 G, K, and M stars. Lithium abundances were determined for 180 G-M stars. Radial velocities were measured for most of the 140 G and K type stars. Combined with proper motions these data were used to study the age distribution and the kinematical properties of the sample. Based on the lithium abundances half of the G-K stars were found to be younger than the Hyades (660 Myr). About 30% are comparable in age to the Pleiades (100 Myr). A small subsample of 10 stars is younger than the Pleiades (100 Myr). They are therefore most likely pre-main sequence stars. Kinematically the PMS and Pleiades-type stars appear to form a group with space velocities close to the Castor moving group but clearly distinct from the Local Association.
keywords:
Surveys – X-rays: stars – Stars: late-type – Stars: pre-main sequence1 Introduction
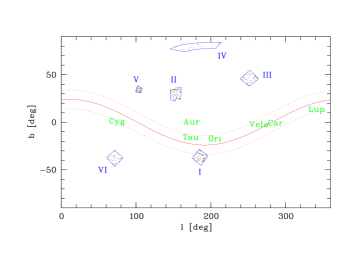
In a previous investigation a sample of RASS X-ray sources located at and has been identified optically ([\astronciteZickgraf et al.1997]). The sample comprises 674 X-ray sources distributed in 6 study areas with a total area of 685 deg2 (see Fig. 1). The sample contains 273 stellar X-ray emitters of spectral type F to M plus 20 other stellar sources (CVs, WDs, A stars). The rest are extragalactic X-ray emitters and a few unidentified sources. The catalogue of identifications and the statistical analysis can be found in [*]App98 and [*]Kraut99, respectively. Here we present the results of an investigation of the X-ray properties, the age distribution and the kinematics of the stellar subsample of coronal emitters.
2 Observations
The stellar counterparts of spectral types G to M were observed spectroscopically in the red wavelength region containing the line Li i 6708Å during several observing campaigns between 1996 and 2002 mainly at Calar Alto Observatory. Further observations were obtained at Obs. Haute Provence and at ESO, La Silla. F stars were omitted because the Li i line is not a sensitive age indicator for these stars. We observed 172 of 199 stars with spectral types G to M. Data for 6 further G-K stars were found in the literature. Of the 141 G and K stars 118 were sufficiently bright ( 12) for high-resolution spectroscopy with a resolution of 0.2 - 0.3 Å at 6708 Å. Likewise, 7 M stars could be observed with high resolution. Fainter stars were observed with low spectral resolution of 3-4 Å. Seven 7 G-K stars and 13 M stars are still unobserved. In total, spectroscopic observations of 179 out of 199 G, K, and M stars are available.
Radial velocities (RVs) and projected rotational velocities, , were derived from the high-resolution spectra by means of cross-correlation techniques.
3 Results
3.1 Distances
The distances towards the G and K stars were derived from trigonometric or spectroscopic parallaxes. The high-resolution spectra allowed the determination of the luminosity classes and hence of the absolute visual magnitudes, . For the classification procedure spectra of MK standard stars were taken from the stellar library of [*]Pru01. In this way spectroscopic parallaxes could be derived for 75 G-K stars. For M stars we obtained IR photometric parallaxes. 43 stars have IR photometry in the 2MASS catalogue. In the (J-H)-(H-K) diagramme the M stars are located along the track for main-sequence stars. Distances were therefore derived for magnitudes of main-sequence stars. Distances for 26 G-K stars and 4 M stars were found in the Hipparcos catalogue. For further 7 M stars trigonometric parallaxes were found in [*]GlieseJahreiss91. In total, distances could be determined for 101 G-K and 54 M stars. For the remaining stars we assumed luminosity class V for the estimation of a lower limit for the distance.
The distribution of distances shows a maximum around 50 pc and a tail extending up to several 100 pc with most stars being nearer than 300 pc.
3.2 X-ray luminosities
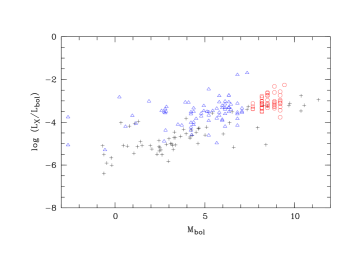
Using these distances X-ray luminosities (0.1-2.4 keV) and bolometric luminosities were calculated. The ratio is shown in Fig. 2 as a function of bolometric magnitude, . The highest ratio is measured for the latest spectral types which have the faintest .
3.3 Lithium abundances
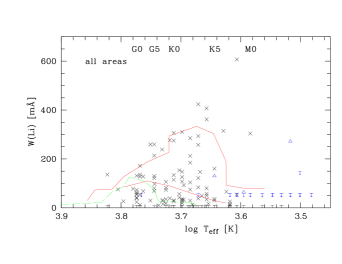
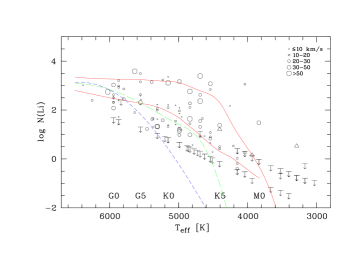
Equivalent widths of Li i 6708, (Li), were measured in high resolution spectra by direct integration. The contribution of Fe i 6708.44Å was taken into account. The detection limit was 10 mÅ. In low/medium resolution spectra Li i 6708 is blended with Fe i 6703, 6705, and 6710 Å. The contributions of the individual lines were separated by means of the fitting method described by Zickgraf et al. (1998). The detection limit in the low/medium resolution spectra is 60 mÅ for K stars and 200 mÅ for M stars. The equivalent widths are displayed in Fig. 3 as function of effective temperature, . Conversion of (Li) to abundances (Li) was performed using the curves of growth of [*]Soder93 for K and [*]Pav96 for cooler stars. We applied the spectral type - relations of de Jager & Nieuwenhuijzen (1987). The estimated temperature uncertainty is 200 K which leads to an average error of (Li) of 0.3 dex. In Fig. 4 (Li) is displayed as function of . Included in the figure are the upper and lower envelope of (Li) for the Pleiades, upper envelopes for the Ursa Major Moving Group (UMaG) and for the Hyades, respectively.
3.4 Age estimates
Age groups were defined based on lithium abundances, (Li), and on the comparison with the (Li) distribution in the Pleiades (100 Myr), UMaG (300 Myr) and Hyades (660 Myr). The age group PMS contains stars with (Li) above the Pleiades upper envelope, and the age group Pl_ZAMS comprises stars with (Li) between the Pleiades upper and lower envelope. The age group UMa consists of stars between the Pleiades lower envelope and Hyades upper envelope, and age group Hya+ has (Li) below the Hyades upper envelope. The assigned ages and fractions of G-K stars in each age group are summarized in Table 1 together with the median rotational velocity, of the respective age group. Obviously, decreases with increasing age.
| age group | ||||
| PMS | Pl_ZAMS | UMa | Hya+ | |
| Myr | 100 Myr | Myr | Myr | |
| number | 8 | 40 | 19 | 74 |
| fraction | 6% | 28% | 13% | 52% |
| 32 | 17 | 18 | 11 | |
3.5 Age dependent distribution
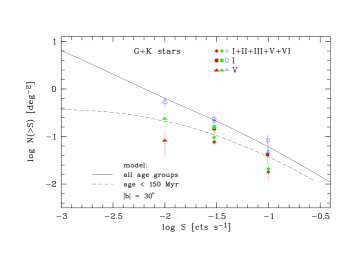
We compared the observed cumulative number distribution, , of our sample with model predictions by [*]Guillout96. The models give cumulative surface densities, , as a function of ROSAT-PSPC count rate, , for three age bins: age younger then 150 Myr, age between 150 Myr and 1 Gyr, and older than 1 Gyr. We restricted the comparison to the youngest model age bin and to the sum of all model age bins because of the difficulty to separate observationally stars with ages of several 100 Myr to Gyr and older. In Fig. 5 the comparison is shown for the stars in the five study areas located around . Shown are the sum of all age groups and of the sum of age groups PMS, PL_ZAMS, and of PMS, PL_ZAMS, and UMa which represent the subsample younger than about 150 Myr. The comparison shows that the observed numbers of stars are in reasonably good agreement with the model predictions. This holds for both the sum of all age groups and stars younger than Myr obtained as described above and represented in the figure by the filled symbols. Likewise, the predicted flattening of at increasinging smaller count rates is also found in our data for area V which has the lowest count rate limit of 0.01 cts s-1.
3.6 Kinematics
Proper motions were obtained for 138 G, K, and M stars from the Hipparcos, TYCHO-2, UCAC2, and STARTNET catalogues. Space velocity components , , and were calculated in the Local Standard of Rest (LSR) (right-handed coordinate system) for 89 single G-K and 8 M stars with distance, RV, and proper motion. For the correction of the solar motion we used the solar motion vector of [*]Dehnen98.
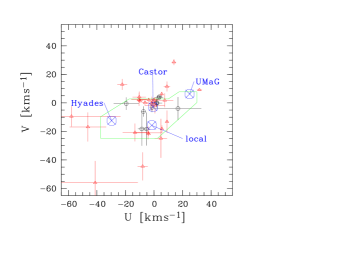
For the youngest age groups PMS and Pl_ZAMS an -digram is shown in in the upper panel of Fig. 6. The space velocities and of these stars cluster with a few exceptions around two values. The majority is found close to the velocity of the Castor Moving Group (MG). A second but much smaller fraction is located close to the Local Association (“local” in Fig. 6). The figure also shows that most PMS stars are kinematically consistent with the Castor MG but distinct from the Local Association.
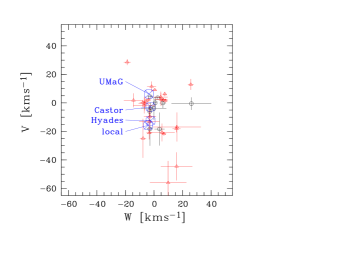
This finding is also consistent with the velocity component in the direction perpendicular to the galatic plane, , which is shown in the diagram in the lower panel of Fig. 6. As for and most PMS stars are kinematically distinct from the Local Association also in the space velocity component.
4 Conclusions
For the age distribution of the high-galactic latitude coronal sample we found that about half of the G-K stars are younger than the Hyades. About 1/3 of the G-K stars is as young or younger than the Pleiades. A small fraction of less than 10% of the G-K stars is younger than the Pleiades. In contrast to the Pl_ZAMS group whose members are found in all study areas most PMS stars, i.e. 8 out of 10, are located in area I. Only two PMS stars are found in area II and none in the remaining areas. This could indicate a possible relation of the high PMS stars to the Gould Belt indicated in Fig. 1. However, the subsample formed by combining the stellar age groups PMS and PL_ZAMS is spatially distributed in all directions covered by our study areas. At the same time most of its members show similar kinematical parameters independent of spatial location. This questions the relation to the Gould Belt. Rather, the space velocities are consistent with these stars being members of a loose moving group with velocities close to the Castor MG which has an age of Myr ([\astronciteBarrado y Navascués1998]). If the members of the PMS group of our sample belong indeed to Castor MG this would indicate an even larger spread of age in this moving group.
References
- [\astronciteAppenzeller et al.1998] Appenzeller, I., Thiering, I., Zickgraf, F.-J. et al., 1998, ApJS 117, 319
- [\astronciteBarrado y Navascués1998] Barrado y Navascués, D. 1998, A&A 339, 831
- [\astronciteDehnen & Binney 1998] Dehnen W., Binney, J.J., MNRAS 298, 387
- [\astroncitede Jager & Nieuwenhuijzen1987] de Jager, C. & Nieuwenhuijzen, H. 1987, A&A 177, 217
- [\astronciteEggen1989] Eggen, O.J., 1989, PASP 101, 366
- [\astronciteGliese & Jahreiss1991] Gliese, W. & Jahreiss, H. 1991, Nearby Stars, Preliminary 3rd Version, Astron. Rechen-Institut, Heidelberg
- [\astronciteGuillout et al.1996] Guillout, P., Haywood, M., Motch, C. & Robin, A.C 1996, A&A 316, 89
- [\astronciteGuillout et al.1998] Guillout, P., Sterzik, M.F, Schmitt, J.H.M.M., et al. 1998, A&A 334, 540
- [\astronciteKrautter et al.1999] Krautter, J., Zickgraf, F.-J., Thiering, I., et al. 1999, A&A 350, 743
- [\astronciteMontes et al.2001] Montes, D., López-Santiago, J., Gálvez, M.C., et al. 2001, MNRAS 328, 45
- [\astroncitePavlenko & Magazzù1996] Pavlenko, Y.V. & Magazzù, A. 1996, A&A 311, 961
- [\astroncitePrugniel & Soubiran2001] Prugniel, Ph. & Soubiran, C., 2001, A&A 369, 1048
- [\astronciteSoderblom et al.1993] Soderblom, D.R., Jones, B.F., Balachandran, S., et al. 1993, AJ 106 1059
- [\astronciteThorburn et al.1993] Thorburn, J.A., Hobbs, L.M., Deliyannis, C.P., & Pinsonneault, M.H. 1993, ApJ 415, 150
- [\astronciteZickgraf et al.1997] Zickgraf, F.-J., Thiering, I., Krautter, J. et al. 1997, A&AS 123, 103
- [\astronciteZickgraf et al.1998] Zickgraf, F.-J., Alcalá, J.M., Krautter, J. et al., 1998, A&A 339, 457