Variability in the stellar initial mass function at low and high mass: 3-component IMF models
Abstract
Three component models of the IMF are made to consider possible origins for the observed relative variations in the numbers of brown dwarfs, solar-to-intermediate mass stars, and high mass stars. The differences between the IMFs observed for clusters, field, and remote field are also discussed. Three distinct physical processes that should dominate the three stellar mass regimes are noted. The characteristic mass for most star formation is identified with the thermal Jeans mass in the molecular cloud core, and this presumably leads to the middle mass range by the usual collapse and accretion processes. Pre-stellar condensations (PSCs) observed in mm-wave continuum studies presumably form at this mass. Significantly smaller self-gravitating masses require much larger pressures and may arise following dynamical processes inside these PSCs, including disk formation, tight-cluster ejection, and photoevaporation as studied elsewhere, but also gravitational collapse of shocked gas in colliding PSCs. Significantly larger stellar masses form in relatively low abundance by normal cloud processes, possibly leading to steep IMFs in low-pressure field regions, but this mass range can be significantly extended in high pressure cloud cores by gravitationally-focussed gas accretion onto PSCs and by the coalescence of PSCs. These models suggest that the observed variations in brown dwarf, solar-to-intermediate mass, and high mass populations are the result of dynamical effects that depend on environmental density and velocity dispersion. They accommodate observations ranging from shallow IMFs in cluster cores to Salpeter IMFs in average clusters and whole galaxies to steep and even steeper IMFs in field and remote field regions. They also suggest how the top-heavy IMFs in some starburst clusters may originate and they explain bottom-heavy IMFs in low surface brightness galaxies.
keywords:
stars: formation, stars: mass function, ISM: clouds1 Introduction
The stellar initial mass function (IMF) is relatively uniform when averaged over whole clusters or large regions of galaxies (see review in Chabrier 2003), but detailed spatial variations in the IMF that are greater than the statistical uncertainties suggest there are different physical processes at work in at least three mass regimes: brown dwarfs, solar to intermediate stellar masses, and high mass stars. Instead of a universal power law with a lower mass limit, the IMF could be a composite with variable contributions from at least these three regimes, depending on environment. This paper reviews the observations of IMF variations (Sect.2), gives examples of how separate mass functions may combine to produce the observed IMF (Sect. 3; see also Shadmehri 2004), and suggests how distinct physical processes during star formation could lead to a 3-component IMF (Sect. 4).
2 Observed Variations in the IMF
2.1 Low Mass Stars
Several studies indicate that the relative abundance of brown dwarfs and low mass stars compared to stars of intermediate mass varies by a significant factor from region to region. For example, IC 348 (Preibisch, Stanke & Zinnecker 2003; Muench et al. 2003; Luhman et al. 2003) and Taurus (Luhman 2000; Briceno et al. 2002) have brown dwarf-to-star ratios that are times lower than the Orion trapezium cluster (Hillenbrand & Carpenter 2000; Luhman et al. 2000; Muench et al. 2002), Pleiades (Bouvier et al. 1998; Luhman et al. 2000), M35 (Barrado y Navascués et al. 2001), and the galactic field (Reid et al. 1999). Even within the sub-solar mass range, the IMF varies as a function of position within a single cluster (IC 348: Muench et al. 2003; Orion: Hillenbrand 1997, Hillenbrand & Carpenter 2000) and from cluster to cluster (IC 348 versus Taurus; Luhman et al. 2003).
These low mass variations have been attributed to a dependence of the Jeans mass on column density (Briceño et al. 2002) or Mach number (Padoan & Nordlund 2002), to stochasticity in the ages and ejection rates of protostars from super-dense clusters (Reipurth & Clarke 2001; Bate, Bonnell & Bromm 2002; Preibisch et al. 2003; Kroupa & Bouvier 2003), to differences in the photoevaporation rate from massive stellar neighbors (Preibisch et al. 2003; Kroupa & Bouvier 2003), and to possible differences in the initial conditions of the turbulence (Delgado-Donate, Clarke, & Bate 2004). The low mass IMF can also be strongly affected by variations in the binary fraction (Malkov & Zinnecker 2001).
2.2 High Mass Stars
Two types of IMF variations have been reported for high mass stars: a relatively high fraction compared to intermediate mass stars in dense cluster cores, and a high fraction compared to low-mass stars in some starbursts. In both cases the IMF shifts toward more massive stars in higher-density regions. The shift also continues toward lower densities, because field stars often have steeper IMFs than clusters (Sect. 2.3).
The flattening of the IMF in cluster cores is well documented. Many studies also note that the youngest clusters have not yet had time to segregate in mass by dynamical processes after the stars form (Bonnell & Davies 1998). The massive stars appear to favor the cluster cores from birth (Pandey, Mahra, & Sagar 1992; Subramaniam, Sagar, & Bhatt 1993; Malumuth & Heap 1994; Brandl et al. 1996; Fischer et al. 1998; Hillenbrand & Hartmann 1998; Figer, McLean, & Morris 1999; Le Duigou & Knödlseder 2002; Stolte et al. 2002; Sirianni et al. 2002; Muench et al. 2003; Gouliermis et al. 2004; Lyo et al. 2004). If is defined to be for an IMF in equal- intervals111In this paper, refers to base 10, , which gives for the Salpeter (1955) IMF, then cluster cores can have very flat IMFs, , and cluster envelopes can be much steeper, (de Grijs et al. 2002).
The observation of mass segregation at an earlier stage than pre-main sequence stars would be interesting. The 850 sources in Ophiuchus (Johnstone et al. 2000) are mass-segregated, for example (Elmegreen & Krakowski 2001), even though they appear to be too young to have moved a cluster radius. However, these are much lower mass objects than OB stars and the statistical uncertainties are large for the Johnstone et al. sample. Thus, the relevance of this result to high mass segregation in clusters is unclear.
Starburst regions and clusters in other galaxies also have a high-mass bias. Either their IMFs are shallower than or they have a high value of the low-mass turnover, such as several M⊙ (Rieke et al. 1993). This turn-over is typically M⊙ in the solar neighborhood (Kroupa 2001). Modern observations of the starburst effect combine dynamical cluster masses from stellar velocity dispersions and cluster radii with luminosities and ages based on photometry. The result is the light-to-mass ratio, and sometimes this is so high that it can only be explained by a lack of low mass stars (Sternberg 1998; Smith & Gallagher 2001; Alonso-Herrero et al. 2001; McCrady, Gilbert & Graham 2003; Förster Schreiber et al. 2003).
2.3 Steep Field IMFs
At the other extreme, the IMF appears to steepen for field regions away from massive dense clusters, although this observation is subject to systematic errors. In the local field, to (Scalo 1986; Rana 1987; Kroupa, Tout, & Gilmore 1993). In the LMC field (Parker et al. 1998) with high statistical significance. For the remote LMC and Milky Way fields, (Massey et al. 1995; Massey 2002). Hill et al. (1994) found that the massive stars inside the Lucke & Hodge associations in the LMC have , whereas the dispersed massive stars outside the associations have . Other comparisons between low and high density regions in the LMC had the same result (Hill et al. 1995; Parker et al. 1998). These studies are reminiscent of the paper by Garmany et al. (1982), who found outside the solar circle and inside, using a complete sample of stars more massive than 20 M⊙ within 2.5 kpc of the Sun. They suggested the excess of massive stars inside the Solar circle came from OB associations in the Carina and Cygnus spiral arms. A more recent study by Casassus et al. (2000) using ultra-compact HII regions throughout the galaxy finds little difference between the IMF slopes inside and outside the solar circle, but they get the steeper value, , everywhere.
Subsequent IMF models used this concept of a bimodal IMF to explain other things too, such as the metallicity gradient and star formation rate in the Galaxy (Güsten & Mezger 1983) and the possibility that disk dark matter is composed of high-mass stellar remnants (Larson 1986). Bi-modality is not so clearly defined, however. For example, the giant association NGC 604 in M33 has the Salpeter IMF (González Delgado & Pérez 2000), as do star complexes in 20 galaxies studied by Sakhibov & Smirnov (2000). So does the dense cluster R136 in the 30 Dor region of the LMC as well as many other clusters (Massey & Hunter 1998; Sagar, Munari, & de Boer 2001), including h and Persei (Slesnick, Hillenbrand, & Massey 2002), NGC 6611 (Belikov et al. 2000), NGC 1960 and NGC 2194 (Sanner et al. 2000). However, the Upper Sco association has the steep IMF, with to (Preibisch et al. 2002; see also Brown 1998).
Other possible observations of high-mass bias are more subtle. There are apparently excess numbers of high mass stars in the massive clusters NGC 3603 (Nürnberger & Petr-Gotzens 2002) and W51 (Okumura et al. 2000) compared with extrapolations of the mass functions at intermediate mass; i.e., the mass functions become shallow at high mass. However, this result is very uncertain. For NGC 3603, Sung & Bessell (2004) found a relative depletion of stars with M⊙, rather than an excess. Scalo (1998) suggested that the slope at high mass could be systematically shallower than the slope at intermediate mass: for 1–10 M⊙ and for 10–100 M⊙. Unfortunately, systematic uncertainties are often large in the high-mass part of IMF (e.g., Scalo 1986; Massey 1998), and random variations for small numbers of stars can reproduce the overall scatter in most cluster IMFs (Elmegreen 1999a; Kroupa 2001).
Several peculiar observations on much smaller scales may be showing the same density effects, although the statistical uncertainties are much larger. For example, the dispersed embedded stars in Orion seem to have a steeper IMF than the Trapezium cluster (Ali & Depoy 1995). Also, there is an apparent separation between high and low mass pre-main sequence stars near SN 1987A in the Large Magellanic Clouds (Panagia et al. 2000).
A recent study of the mass-to-light ratio in the disks of low surface brightness galaxies suggests the entire IMF there is steep, with (Lee et al. 2004). These galaxies are likely to have very low pressures because of their low stellar and gaseous column densities. Star formation in the low-density “field” mode could be pervasive.
2.4 Origins of Steep Field IMFs
Part of the difficulty with these field star measurements is that even though the IMFs are observed to be relatively steep, they could still originate from the same shallow IMFs found in dense clusters after the clusters disperse. This can happen in four ways: special conditions for star formation in the field which produce a physical dependence of the maximum stellar mass on the cluster mass; differential drift of long-lived low-mass stars into the field, differential evaporation of peripheral cluster stars that have a steep IMF from birth, and inadequate corrections for background stars.
Elmegreen (1999a) showed how a Salpeter IMF for clusters that form in clouds with a power law distribution of masses could sum to give a steeper IMF if massive clouds, which are statistically more likely to form high mass stars, are destroyed more readily by their stars than low mass clouds. One reason for this could be the rapid increase in Lyman continuum luminosity with increasing stellar mass, which actually works out numerically to give the Massey et al. (1995) slope of considering sampling statistics and cloud binding energy. This differential destruction was thought to apply to the field and not associations because the ambient pressure in the field is often times lower than in associations, making the field clouds more susceptible to internal disruption than the association clouds. The model applies even if the ages of the field stars are too young for them to have drifted there from nearby associations (as observed by Massey et al. 1995 and Parker et al. 2001).
Differential drift of the long-lived low-mass stars out of dispersed clusters and into the field also steepens the field IMF, provided the stars have enough time to do this (Elmegreen 1997, 1999a). Hoopes, Walterbos & Bothun (2001) explained the steep mass function required for diffuse interstellar ionization in nearby galaxies this way. Tremonti et al. (2002) also found a clear difference in the populations of stars in the field and clusters of the dwarf starburst galaxy NGC 5253, with a Salpeter IMF for the clusters and a steeper IMF for the field, and explained this difference as a result of cluster dispersal into the field after 10 My, when the most massive stars have disappeared.
Differential evaporation of peripheral cluster stars is a natural explanation for the steep IMF in the field because in the outer parts of clusters is already low, or lower (de Grijs et al. 2002). These are also the stars most likely to fill the field because they are the most weakly bound to the cluster. According to the figures in de Grijs et al., all stars beyond in the LMC clusters NGC 1805 and NGC 1818 have . The question remains whether the stars used for the field IMFs are too massive and short-lived to have migrated there from dense clusters. Modelling of this process seems to be required.
A fourth possibility for the steep field IMF in the LMC was proposed by Parker et al. (2001), who noted that corrections for field star contamination of cluster IMFs can reduce an apparent from to . Such corrections were not applied to the field IMF, though.
2.5 Superposition of IMFs
Kroupa & Weidner (2003) reconsidered the point in Elmegreen (1999a) about superpositions of cluster IMFs and offered a different conclusion. They suggested that superposition of Salpeter IMFs with a cluster mass function slope of explains the field star IMF. However, the superposition of IMFs in a region gives the IMF of all of the stars there, whether or not they are in clusters. If superposition alone gives for the field, then it should give the same for whole galaxies, including the clusters. Dispersal of clusters into the field will not change the average IMF in a galaxy. However, the summed IMFs for whole galaxies are not steep like the field, they are usually Salpeter IMFs, so superposition alone cannot explain the field IMF.
A review of observed galaxy IMFs was in Elmegreen (1999b). Recent observations include the following: The stellar mass-to-light ratio and the Tully-Fisher relation for galaxies were explained with the Salpeter IMF and shown to be inconsistent with steeper functions by Bell & de Jong (2001). The colors in Blue Compact Dwarf galaxies were also reproduced by the Salpeter IMF (Cairós et al. 2002). The cosmic star formation history and metallicities of galaxies were studied by Baldry & Glazebrook (2003), who concluded that only the Salpeter IMF was appropriate, ruling out anything as steep at for M. Pipino & Matteucci (2004) also required the Salpeter IMF to explain the photochemical evolution of elliptical galaxies. Similarly, Rejkuba, Greggio & Zoccali (2004) found the Salpeter IMF in the halo of the galaxy NGC 5128 (Cen A).
The observation of a Salpeter IMF for whole galaxies and essentially the same IMF or shallower for individual dense clusters implies there is little connection between stellar mass and cluster mass for most star formation. If there were a one-to-one correspondence between these masses, so that low mass clusters formed only low mass stars while high mass clusters formed both low and high mass stars, then the superposition of cluster IMFs would be significantly steeper than the observed galaxy IMFs. If only a small part of all star formation, such as the loose clusters in the field, has a correspondence between cluster mass and maximum stellar mass (as a result of specific physical effects and not random sampling), then this sub-population can have an IMF that is steeper than each cluster IMF without affecting the galaxy-wide average.
2.6 Considering a Real Difference between Field and Cluster IMFs
The IMF in low density clusters typical of the field could be intrinsically steeper than the IMFs in dense clusters in OB associations. It seems reasonable that the three main groups of stellar mass – brown dwarfs, solar-to-intermediate mass, and high mass – all form by different combinations of processes. Enhanced gravitational focussing and rapid centralization can make high mass stars grow by a much larger factor than low mass stars through accretion of peripheral gas and coalescence of other protostars in dense cluster cores. Accretion has been extensively discussed by Zinnecker (1982), Larson (1999, 2002), Myers (2000), Bonnell et al. (1997, 2001, 2004), Basu & Jones (2004) and others. Coalescence of other stars or protostars was discussed by Zinnecker (1986), Larson (1990), Price & Podsiadlowski (1995), and Stahler, Palla, & Ho (2000), Shadmehri (2004) and others. Coalescence after accretion drag (Bonnell et al. 1998) or after accretion-induced cloud core contraction (Bonnell, Bate, & Zinnecker 1998; Bonnell & Bate 2002) also seem likely in view of recent simulations showing these and other effects (Klessen 2001; Bate, Bonnell, & Bromm 2003; Bonnell, Bate & Vine 2003; Gammie, et al. 2003; Li, et al. 2004).
Accretion and coalescence make the IMF depend on environment. The environment is also important for the confinement of stellar winds and ionization during the collapse phase of massive-star formation (Garay & Lizano 1999; Yorke & Sonnhalter 2002; Churchwell 2002; McKee & Tan 2003). These processes are enhanced in dense cloud cores, so massive star formation could be biased to these regions. This is one explanation for the flattening of the IMF in cluster cores, along with dynamical effects (Giersz & Heggie 1996; Gerhard 2000; Kroupa, Aarseth & Hurley 2001; Portegies-Zwart et al. 2004). An important question is whether the average IMFs in dense clusters are also flatter than the average IMFs in loose stellar aggregates.
A critical observation would be a steep IMF in many combined low-density regions like Taurus, which together contain enough stars to sample the IMF out to the O-star range (see also discussion in Luhman 2000). If the IMF has the Salpeter slope, such sampling requires stars greater than 1 M⊙ or stars greater than 5 to include one star with a mass greater than 50 M⊙. For only 22 stars between 5 and 50 M⊙, however, the slope in the derived IMF will be statistically uncertain by (Elmegreen 1999a), which is too large to detect a difference between and . To make the IMF slope accurate to requires stars in a mass interval spanning a factor of 10 (Elmegreen 1999a). For this number of stars in the 5-50 M⊙ interval, the corresponding total number of stars and the total of the cluster masses would have to be stars and 5400 M⊙ respectively for down to 0.3 M⊙. It follows that if a survey of newborn or embedded stars far from dense clusters includes stars down to M⊙, then the difference between and at high mass could be verified for such remote regions. We emphasize that the stars in such a survey have to be very young to avoid contamination by differential drift of low-mass association stars into the same fields. The velocity dispersions of young stars in Taurus, for example, are probably km s-1 (Frink et al. 1997), so field stars much older than My will begin to mix with their drifting counterparts from OB associations, which probably have even larger velocity dispersions.
Differences between dispersed and clustered protostars are already evident. The mm-wave continuum sources in Taurus are extended like classical isothermal spheres whereas the analogous sources in Perseus are denser and more truncated like Bonner-Ebert spheres (Motte & André 2001). Enhanced boundary pressures or source interactions are evidently more important in the denser regions.
3 Multi-component IMF models
We consider two examples where different parts of the IMF are relatively independent. The point is to demonstrate that the observed power law distributions ranging from solar mass to high mass stars do not necessarily imply a single scale-free star formation mechanism. The first model builds the entire IMF from three log-normals, each with its own characteristic stellar mass, and illustrates the observed variations in the IMF by varying slightly the amplitudes or widths of these log-normals. The second uses a log-normal function with density-dependent parameters to match both an approximate log-normal IMF in the field and a shallow power-law IMF for R136 in 30 Dor (Massey & Hunter 1998). A model in Shadmehri (2004) follows the coalescence of pre-stellar condensations (PSC) in a cloud core, assuming these condensations form with a log-normal mass function and collapse on their free-fall times. Physical motivations for these models are discussed in section 4.
The models have many input parameters so the observed IMFs can be matched in different ways. The goal is not to fit the IMF with a particular model, but to show that the IMF can be a composite of IMFs from several different physical processes. These processes should also have their own list of most-dominant physical parameters and so, like our models, could also have a range of possible outcomes. Blended together or with poor sampling statistics, they can produce what appears to be a universal IMF. Only when viewed on small scales and short time intervals, and when enough similar regions are included to have good sampling statistics, will this physical diversity show up as a variable IMF. The observations mentioned above suggest this diversity is beginning to appear. Numerical simulations can check this further by comparing the physical processes involved with the formation of stars in the three mass ranges.
3.1 Three log-normals
Figure 1(top) shows examples of 3-part IMFs made from the superposition of log-normal functions, one centered on brown dwarfs at several hundredths of a solar mass, another at several tenths of a solar mass, and a third at several solar masses. The bottom panel plots the slopes of the IMFs along with open (Milky Way) and filled (LMC) squares that represent observations (from Scalo 1998).
The composite IMF is based on the equation
| (1) |
Each of the components is indicated by a dashed line with the same color as the composite. The model parameters are summarized in Table 1. The central masses for each component are shown by arrows.
| color | ||||||||||||
|---|---|---|---|---|---|---|---|---|---|---|---|---|
| 2 | 3 | 2 | 3 | 2 | 3 | 2 | 3 | |||||
| red | 0.8 | 1.0 | 0.04 | 0.02 | 0.3 | 3.0 | 3.27 | 1.35 | 0.82 | 0.9 | 1.4 | 1.8 |
| blue | 0.4 | 1.0 | 0.25 | 0.02 | 0.3 | 3.0 | 3.27 | 1.35 | 0.97 | 0.9 | 1.4 | 1.65 |
| green | 0.1 | 1.0 | 0.01 | 0.02 | 0.3 | 3.0 | 3.27 | 1.84 | 1.04 | 0.9 | 1.2 | 1.6 |
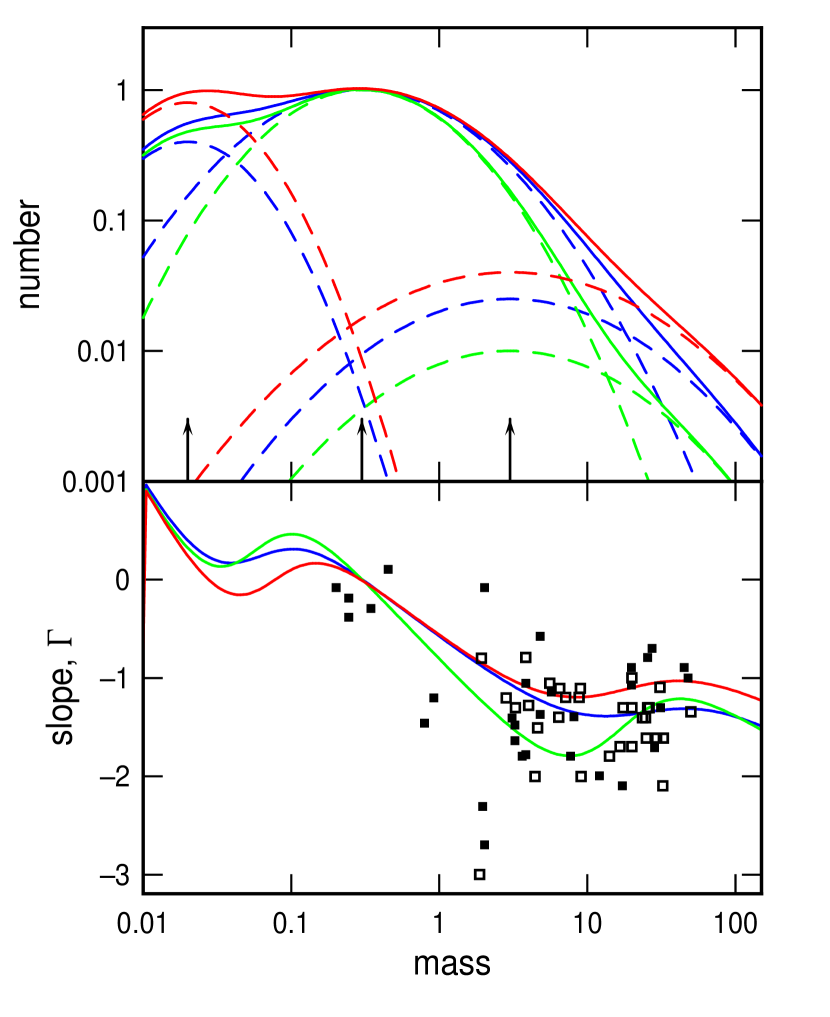
For typical star counts in clusters, the observed IMFs would be indistinguishable from these 3-component functions and probably interpreted as power laws with a low mass turn-over. We choose parameter values in the figure that give “power-law” slopes from to at high mass and to at intermediate mass. Observed variations over factors of 2 or 3 at low mass (sect. I) have also been matched. Thus this 3-component model can reproduce the three-part variations that are observed in the IMF.
3.2 The upper IMF from a log-normal with density-dependent dispersion
Figure 2 shows a model where an idealized cloud forms stars in a log-normal mass distribution that has a central mass and dispersion increasing with cloud density. The cloud density has the form
| (2) |
where the central density is normalized to unity and the core radius is . The IMF is locally log-normal, written as
| (3) |
for exponential factor that decreases with density as and central mass that increases with density as . Thus the log-normal is broader and shifted toward higher mass in the cloud core. The Miller-Scalo (1979) IMF has and M⊙ with no density dependence. The parameters and are varied to fit the observations. The overall stellar mass function in the cloud is determined from an integral over cloud radius with a weighting factor equal to the power of density:
| (4) |
The density factor accounts for available mass and for a star formation rate locally proportional to the dynamical rate, .
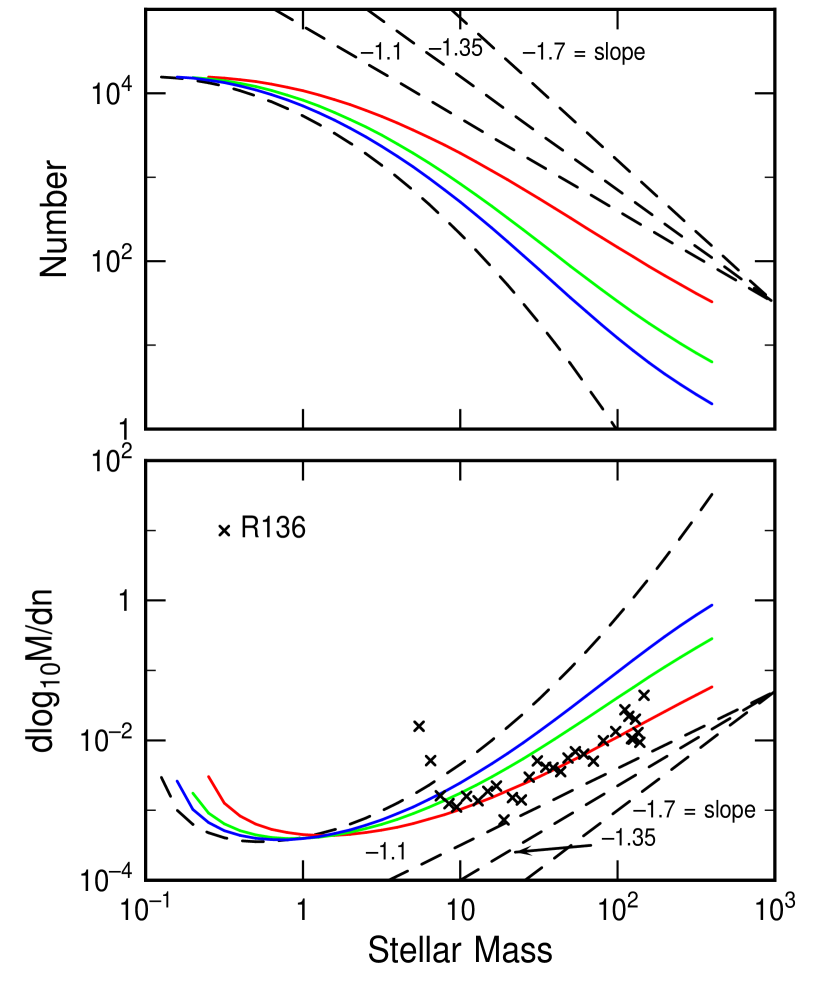
Figure 2 shows the Miller-Scalo IMF () as a dashed line and sample IMFs with , and (red), (green), and (blue). The IMF slope is shallower for smaller . The bottom panel plots mean separation between the logs of the masses in the IMF, or the inverse of the IMF density, which is defined to be . Also shown for comparison are the observations of R136 from Massey & Hunter (1998). This IMF density is used to overcome problems with histograms or cumulative distributions. When the number of stars is small, as for the R136 cluster at high mass, a histogram of the number of stars versus log mass has gaps along the abscissa where certain stellar masses happen to be missing, or it has such large mass intervals that the slope of has poor accuracy. To make Figure 2, we used the 599 stars with M⊙ in the Massey & Hunter survey (kindly provided by the authors in electronic form). These stars were listed in order of increasing mass and the differences in for stellar groups of various lengths were determined. The IMF density is and the inverse of this quantity is plotted. When there are a large number of stars with a common mass, the group size can be large. The abscissa in this plot is the average mass in the group. For example, if the two largest masses are and , then the last point plotted has coordinates
| (5) |
The slope of the distribution of points in such a plot is the negative power in a power-law IMF. The R136 points have .
The variation of central mass and dispersion with density stretches the IMF into a near-power law at high mass, with the additional massive stars coming from the core region. The slope is more shallow as the core is approached, as shown by the sequence of decreasing in the figure. The shallow IMF in R136 can be reproduced in this way.
4 Physical basis for multi-component models
The stellar mass at the transition in the IMF where the rising power law from high to intermediate mass bends over to become relatively flat on a log-log plot has been viewed for some time as the thermal Jeans mass in the cloud core, (Larson 1992, Elmegreen 1997, 1999a; see review in Chabrier 2003). This physical mass is a reasonable lower limit to an IMF that arises from scale-free turbulent fragmentation because fragmentation at lower mass cannot easily lead to gravitational collapse for typical cloud temperatures and pressures. We believe that even without an intrinsically scale-free star formation process, this characteristic mass still defines the main component of the IMF around M⊙. This component produces the low-to-intermediate mass stars in all of the models above.
Stars or brown dwarfs with M⊙ require times higher pressures to collapse from a gaseous state than do stars with because the small stars need their own thermal Jeans mass to be small for them to be made by an instability, and the thermal Jeans mass scales as the inverse square root of pressure for a fixed temperature. Several models of brown dwarf formation were referenced in the introduction, i.e. ejection from tight multiple systems or disks, photoevaporated remains of normal protostars, and turbulent fragmentation. The ejection and photoevaporation models do not rely on high cloud pressure to reach a self-gravitating state with . They get their high pressures inside pre-existing self-gravitating objects.
Ultra high pressures also occur during collisions between existing gravitating pre-stellar condensations (PSC). The PSCs with normal stellar masses have high internal pressures from self-gravity but no ability to fragment into independent (free-floating) brown dwarfs. Whatever brown dwarfs they make will be in tight multiple systems or disks, as in the existing models (these brown dwarfs may be ejected after they form). However, two colliding PSCs will have ultra-high pressure shocks between them, and the shock fragments and sheared off overlapping parts can collapse into independent brown dwarfs on their own. The free-fall time at the compressed density is less than the cooling time by grain radiation and probably also less than the timescale for fragment dispersal. The pressure in such a collision is the square of the collision speed times the PSC density, and because the average PSC density is times higher than the cloud core density ( cm-3 compared to cm-3) while the collision speed is probably comparable to the cloud core virial speed, the pressure between colliding PSCs will be times the ambient cloud core pressure. This allows unstable pieces of the collision to have a thermal Jeans mass that is 0.1 times the thermal Jeans mass in the cloud core, making brown dwarfs.
Evidently, there are a variety of mechanisms, all related to instabilities and fragments inside PSCs, that suggest a second characteristic mass appears in the IMF at about 0.1 times the characteristic mass in the average cloud core. The PSCs are already dense and at high pressure because of self-gravity, and so secondary fragmentation and collisions among them should make new instabilities at times lower . This low characteristic mass could be the origin of the low-mass part of the 3-component IMF shown in Figure 1.
The high mass component of the IMF in this composite model may also arise from collisions between PSCs if they occasionally coalesce as well as fragment (Shadmehri 2004). Interactions could make both brown dwarfs and massive PSCs at the same time if the ejected gravitationally bound parts are a small fraction of the combined mass. The above models assumed either a fixed characteristic mass for the high mass part that was times higher than the main part of the IMF (Fig. 1), or a variable characteristic mass that depended on density (Fig. 2) or collision details (Shadmehri 2004). The factor of in mass is reasonable for distinct coalescence bi-products because it follows from several collision events with a hierarchical build-up in mass. Also, the gravitational cross section for collisions becomes significantly larger than the physical cross section, leading to a run-away growth process, when one of the stars is times the average mass of the others.
The exact factors for the high and low-mass components in our composite models of the IMF are not critical because the mathematical expressions are general enough to reproduce the observed IMFs even with slightly different characteristic masses. The essential points are: (1) there could be distinct physical processes operating at low, intermediate, and high masses; (2) these distinct processes will be disguised inside a composite IMF if only wide spatial or temporal averages of stellar populations are observed; and (3) the IMF need not reflect scale-free formation conditions for all intermediate to massive stars.
5 Summary
Composite models of the IMF that are based on several characteristic masses for distinct physical processes of star formation are shown to be as good a fit to the observations as a universal model that has essentially one characteristic mass and a scale free formation process above that mass. Three characteristic masses and their possible origins were discussed here: brown dwarf masses on the order of M⊙ could be the result of dynamical processes inside self-gravitating pre-stellar condensations or gravitational collapse in the ultra high-pressure shocks between these condensations; small-to-intermediate mass stars could come from the pre-stellar condensations themselves, getting their characteristic mass from the thermal Jeans mass in the cloud core, and high mass stars could grow from enhanced gas accretion and coalescence of pre-stellar condensations (see also Shadmehri 2004). These three mass ranges would also have processes in common, such as competitive accretion of ambient cloud gas, collapse to protostars and disks, binary star formation, and so on, as suggested by many authors referenced above. These processes broaden each component in the IMF into what was approximated here as a log-normal.
The characteristic mass for a star in this model is still the thermal Jeans mass in the cloud core, . This mass is relatively free of variations over different environments in the Galaxy and in different galaxies because of the way pressure and temperature tend to scale for typical heating and cooling conditions (Elmegreen 1999a). This constancy gives the apparent universality of the IMF. However, secondary processes inside objects and interactions between these objects should also form stars. With these additional star formation processes, some of the observed variations in the IMF make more sense. For example, the relative number of brown dwarfs increases as the primary condensations interact more and at greater relative speeds in rich (Orion-type) clusters. Also, the relative numbers of massive stars increase in denser, more coalescence-rich clusters, including cluster cores and starbursts.
An important point here is that the shocks which form brown dwarfs and the coalescences which form massive stars are among relatively large ( AU) pre-stellar condensations and not among protostars or stars, which are much smaller. Thus the cluster densities that lead to severe interactions are rather low, like the observed densities of stars and protostars in clusters, objects pc-3 (Elmegreen & Shadmehri 2003).
Computer simulations of cluster formation in turbulent clouds show many processes operating simultaneously. It may be difficult to tell if any particular process dominates during the formation of a particular star. However, the IMFs in these simulations might still be partitioned into the three fundamental parts discussed here. Bate, Bonnell & Bromm (2002) have already distinguished brown dwarf formation from other stars. Gammie et al. (2003) have shown how the high-mass part of the IMF gets shallower with time as a result of coalescence and enhanced accretion. The advantage of viewing the IMF in this 3-fold way is that it allows observers to anticipate and recognize slight variations in the IMF for different classes of regions when they are sampled with enough stars to give statistically significant counts.
Acknowledgements: B.G.E. is grateful for support from NSF Grant AST-0205097.
References
- [] Ali, B., & DePoy, D. L. 1995, AJ, 109, 709
- [] Alonso-Herrero, A., Engelbracht, C. W., Rieke, M. J., Rieke, G. H., & Quillen, A. C. 2001, ApJ, 546, 952
- [] Baldry, I.K., Glazebrook, K. 2003, ApJ, 593, 258
- [] Barrado y Navascués, D., Stauffer, J.R., Bouvier, J., Mart n, E.L. 2001, ApJ, 546, 1006
- [] Basu, S. & Jones, C. E. 2004, MNRAS, 347, L47
- [] Bate, M.R., Bonnell, I.A. & Bromm, V. 2002, MNRAS, 332, L65
- [] Bate, M.R., Bonnell, I.A. & Bromm, V. 2003, MNRAS, 339, 577
- [] Belikov, A. N., Kharchenko, N. V., Piskunov, A. E., & Schilbach, E. 2000, A&A, 358, 886
- [] Bell, E.F. & de Jong, R.S. 2001, ApJ, 550, 212
- [] Bonnell, I. A., Bate, M. R., Clarke, C. J., & Pringle, J. E., 1997, MNRAS, 285, 201
- [] Bonnell, I. A., Bate, M. R., & Zinnecker, H. 1998, MNRAS, 298, 93
- [] Bonnell, I. A., & Davies, M. B. 1998, MNRAS, 295, 691
- [] Bonnell, I. A., Clarke, C. J., Bate, M. R. & Pringle, J. E. 2001, MNRAS, 324, 573
- [] Bonnell, I.A., & Bate, M.R. 2002, MNRAS, 336, 659
- [] Bonnell, I.A., Bate, M.R., & Vine, S.G. 2003, MNRAS, 343, 413
- [] Bonnell, I.A., Vine, S.G., & Bate, M.R. 2004, MNRAS, 349, 735
- [] Bouvier, J., Stauffer, J. R., Martin, E. L., Barrado y Navascues, D., Wallace, B., & Bejar, V. J. S. 1998, A&A, 336, 490
- [] Brandl, B., Sams, B. J., Bertoldi, F., Eckart, A., Genzel, R., Drapatz, S., Hofmann, R., Loewe, M. & Quirrenbach, A. 1996, ApJ, 466, 254
- [] Briceño, C., Luhman, K. L., Hartmann, L., Stauffer, J. R., & Kirkpatrick, J. D. 2002, ApJ, 580, 317
- [] Brown, A.G.A. 1998, In The Stellar Initial Mass Function, Ed. G. Gilmore & D. Howell, ASP Conference Series, Vol. 142, 45.
- [] Cairós, L.M., Caon, N., García-Lorenzo, B., Vílchez, J.M., & Muñoz-Tuñón, C. 2002, ApJ, 577, 164
- [] Casassus, S., Bronfman, L., May, J., Nyman, L.-Å 2000, A&A, 358, 514
- [] Chabrier, G. 2003, PASP, 115, 763
- [] Churchwell, E. 2002, ARAA, 40, 27
- [] de Grijs, R., Gilmore, G. F., Johnson, R. A., & Mackey, A. D. 2002, MNRAS, 331, 245
- [] Delgado-Donate, E.J., Clarke, C.J., & Bate, M.R. 2004, MNRAS, 347, 759
- [] Elmegreen, B.G. 1997, ApJ, 486, 944
- [] Elmegreen, B.G. 1999a, ApJ, 515, 323
- [] Elmegreen, B.G. 1999b, in The Evolution of Galaxies on Cosmological Timescales, ASP Conference Series, Vol. 187. ed. J. E. Beckman and T. J. Mahoney, San Francisco: Astron. Soc. Pacific, p. 145
- [] Elmegreen, B.G., & Krakowski, A. 2001, ApJ, 562, 433
- [] Elmegreen, B.G., & Shadmehri, M. 2003, MNRAS, 338, 817
- [] Figer, D.F., McLean, I.S., & Morris, M. 1999, ApJ, 514, 202
- [] Fischer, P., Pryor, C., Murray, S., Mateo, M., & Richtler, T. 1998, AJ, 115, 592
- [] Frink, S., Röser, S., Neuhäuser, R., & Sterzik, M.F. 1997, A&A, 325, 613
- [] Gammie, C.F., Lin, Y.-T., Stone, J.M., & Ostriker, E.C. 2003, ApJ, 592, 203
- [] Garay, G., Lizano, S. 1999, PASP, 111, 1049
- [] Garmany, C.D., Conti, P. S., & Chiosi, C. 1982, ApJ, 263, 77
- [] Gerhard, O. 2000, in Massive Stellar Clusters, eds. A. Lançon, & C. Boily, ASP Conf., San Francisco, p.12
- [] Giersz, M., Heggie, D.C. 1996, MNRAS, 279, 1037
- [] González Delgado, R. M., Pérez, E. 2000, MNRAS, 317, 64
- [] Gouliermis, D., Keller, S. C., Kontizas, M., Kontizas, E., & Bellas-Velidis, I. 2004, A&A, 416, 137
- [] Güsten, R. & Mezger, P.G. 1983, Vistas. Astron., 26, 159
- [] Hill, J. K., Isensee, J. E., Cornett, R. H., Bohlin, R. C., O’Connell, R. W., Roberts, M. S., Smith, A. M., & Stecher, T. P. 1994, ApJ, 425, 122
- [] Hill, R. S., Cheng, K.-P., Bohlin, R. C., O’Connell, R. W., Roberts, M. S., Smith, A. M., & Stecher, T. P. 1995, ApJ, 446, 622
- [] Hillenbrand, L.A. 1997, AJ, 113, 1733
- [] Hillenbrand, L.A. & Hartmann, L.W. 1998, ApJ, 492, 540
- [] Hillenbrand, L.A. & Carpenter, J.M. 2000, ApJ, 540, 236
- [] Hoopes, C.G., Walterbos, R. A. M., Bothun, G.D. 2001, ApJ, 559, 878
- [] Johnstone, D., Wilson, C.D., Moriarty-Schieven, G., Joncas, G., Smith, G., Gregersen, E., Fich, M. 2000, ApJ, 545, 327
- [] Klessen, R. S. 2001, ApJ, 556, 837
- [] Kroupa, P. 2001, MNRAS, 322, 231
- [] Kroupa, P., Tout, C.A., & Gilmore, G. 1993, MNRAS, 262, 545
- [] Kroupa, P., Aarseth, S., & Hurley, J. 2001, MNRAS, 321, 699
- [] Kroupa, P. & Bouvier, J. 2003, MNRAS, 346, 369
- [] Kroupa, P., Weidner, C. 2003, ApJ, 598, 1076
- [] Larson, R.B. 1986, MNRAS, 218, 409
- [] Larson, R.B. 1990, in Physical processes in fragmentation and star formation, eds. R. Capuzzo-Dolcetta, C. Chiosi & A. Di Fazio, Dordrecht: Kluwer, p. 389
- [] Larson, R.B. 1992, MNRAS, 256, 641
- [] Larson, R.B. 1999, in Star Formation 1999, ed. T. Nakamoto, Nobeyama: Nobeyama Radio Observatory, 336
- [] Larson, R.B. 2002, MNRAS, 332, 155
- [] Le Duigou, J.-M., Knödlseder, J. 2002, A&A, 392, 869
- [] Lee, H.-C., Gibson, B.K., Flynn, C., Kawata, D., & Beasley, M.A. 2004, astroph/0405439
- [] Li, P.S., Norman, M.L., Mac Low, M.-M., & Heitsch, F. 2004, ApJ, 605, 800
- [] Luhman, K.L. 2000, ApJ, 544, 1044
- [] Luhman, K. L., Rieke, G. H., Young, E. T., Cotera, A.S., Chen, H., Rieke, M.J., Schneider, G. & Thompson, R. I. 2000, ApJ, 540, 1016
- [] Luhman, K. L., Stauffer, J.R., Muench, A. A., Rieke, G. H., Lada, E. A., Bouvier, J. & Lada, C. J. 2003, ApJ, 593, 1093
- [] Lyo, A.-R., Lawson, W.A., Feigelson, E.D., & Crause, L. A. 2004, MNRAS, 347, 246
- [] Malkov, O. & Zinnecker, H. 2001, MNRAS, 321, 149
- [] Malumuth, E. M. & Heap, S. R. 1994, AJ, 107, 1054
- [] Massey, P. 1998, in The Stellar Initial Mass Function, eds. G. Gilmore & D. Howell, ASP Conf. Ser., 142, p. 17
- [] Massey, P. 2002, ApJS, 141, 81
- [] Massey, P. & Hunter, D.A. 1998, ApJ, 493, 180
- [] Massey, P., Lang, C. C., DeGioia-Eastwood, K., & Garmany, C. D. 1995, ApJ, 438, 188
- [] McCrady, N., Gilbert, A., & Graham, J.R. 2003, ApJ, 596, 240
- [] McKee, C.F. & Tan, J.C. 2003, ApJ, 585, 850
- [] Miller G. E. & Scalo J. M., 1979, ApJS, 41, 513
- [] Motte F., & André P. 2001, A&A, 365, 440
- [] Muench, A.A., Lada, E.A., Lada, C.J., & Alves, J. 2002, ApJ, 573, 366
- [] Muench, A. A., Lada, E. A., Lada, C. J., Elston, R. J., Alves, J. F., Horrobin, M., Huard, T. H., Levine, J. L., Raines, S. N., Román-Zíñiga, C. 2003, AJ, 125, 2029
- [] Myers, P.C. 2000, ApJ, 530, L119
- [] Nürnberger, D. E. A., & Petr-Gotzens, M. G. 2002, A&A, 382, 537
- [] Okumura, S., Mori, A., Nishihara, E., Watanabe, E., & Yamashita, T. 2000, ApJ, 543, 799
- [] Padoan, P. & Nordlund, A. 2002, astroph/0205019
- [] Pandey, A. K., Mahra, H. S., & Sagar, R. 1992, Astr.Soc.India, 20, 287
- [] Panagia, N., Romaniello, M., Scuderi, S., Kirshner, R. P.2000, ApJ, 539, 197
- [] Parker, J.W., Hill, J.K., Cornett, R.H., Hollis, J., Zamkoff, E., Bohlin, R. C., O’Connell, R.W., Neff, S.G., Roberts, M.S., Smith, A.M. & Stecher, T.P. 1998, AJ, 116, 180
- [] Parker, J.W., Zaritsky, D., Stecher, T.P., Harris, J., & Massey, P. 2001, AJ, 121, 891
- [] Pipino, A. & Matteucci, F. 2004, MNRAS, 347, 968
- [] Portegies Zwart, Simon F., Baumgardt, H., Hut, P., Makino, J., McMillan, S. L. W. 2004, Nature, 428, 724
- [] Preibisch, T., Brown, A.G.A., Bridges, T., Guenther, E. & Zinnecker, H. 2002, AJ, 124, 404
- [] Preibisch, T., Stanke, T. & Zinnecker, H. 2003, A&A, 409, 147
- [] Price, N. M., & Podsiadlowski, Ph. 1995, MNRAS, 273, 1041
- [] Rana, N.C. 1987, A&A, 184, 104
- [] Reid, I. N., Kirkpatrick, J. D., Liebert, J., Burrows, A., Gizis, J. E., Burgasser, A., Dahn, C. C., Monet, D., Cutri, R., Beichman, C. A., & Skrutskie, M. L 1999, ApJ, 521, 613
- [] Reipurth, B. & Clarke, C. 2001, AJ, 122, 432
- [] Rejkuba, M., Greggio, L., & Zoccali, M. 2004, A&A, 415, 915
- [] Rieke, G. H., Loken, K., Rieke, M. J., & Tamblyn, P. 1993, ApJ, 412, 99
- [] Sagar, R., Munari, U., de Boer, K. S. 2001, MNRAS, 327, 23
- [] Sakhibov, F. & Smirnov, M. 2000, A&A, 354, 802
- [] Salpeter, E.E. 1955, ApJ, 121, 161
- [] Sanner, J., Altmann, M., Brunzendorf, J., & Geffert, M. 2000, A&A, 357, 471
- [] Scalo, J.S. 1986, Fund.Cos.Phys, 11, 1
- [] Scalo, J.S. 1998, in The Stellar Initial Mass Function, ed. G. Gilmore, I. Parry, & S. Ryan, Cambridge: Cambridge University Press, p. 201
- [] Förster Schreiber, N.M.F., Genzel, R., Lutz, D. & Sternberg, A. 2003, ApJ, 599, 193
- [] Sirianni, M., Nota, A., De Marchi, G., Leitherer, C., Clampin, M. 2002, ApJ, 579, 275
- [] Slesnick, C.L., Hillenbrand, L.A., & Massey, P. 2002, ApJ, 576, 880
- [] Smith, L.J., Gallagher, J.S. 2001, MNRAS, 326, 1027
- [] Stahler, S. W., Palla, F., & Ho., P. T. P. 2000, in Protostars and Planets IV, eds. V.Mannings, A. P. Boss & S. S. Russell, Tucson: Univ. Arizona Press, p. 327
- [] Sternberg, A. 1998, ApJ, 506, 721
- [] Stolte, A., Grebel, E. K., Brandner, W. & Figer, D. F. 2002, A&A, 394, 459
- [] Subramaniam, A., Sagar, R., & Bhatt, H.C. 1993, A&A, 273, 100
- [] Sung, H. & Bessell, M. S. 2004, AJ, 127, 1014
- [] Tremonti, C.A., Calzetti, D., Leitherer, C., & Heckman, T.M. 2002, ApJ, 555, 322
- [] Yorke, H.W. Sonnhalter, C. 2002, ApJ, 569, 846
- [] Zinnecker, H. 1982, in Symposium on the Orion Nebula to Honor Henry Draper, eds. A. E. Glassgold, P. J. Huggins, & E. L. Schucking, New York: New York Academy of Science, p. 226
- [] Zinnecker, H. 1986, in Luminous Stars and Associations in Galaxies, IAU Symposium 116, eds. C.W.H. de Loore, A.J. Willis, P. Laskarides, (Dordrecht: Reidel), p. 271