Photometric Observations of the Type Ia SN 2002er in UGC 10743
Abstract
Extensive light and colour curves for the Type Ia supernova SN 2002er are presented as part of the European Supernova Collaboration. We have collected photometry from ten different telescopes covering the phases from 7 days before until 619 days after maximum light. Corrections for the different instrumental systems and the non-thermal spectrum of the supernova (S-corrections) have been applied.
With the densely sampled light curves we can make detailed comparisons to other well-observed objects. SN 2002er most closely resembles SN 1996X after maximum, but clearly shows a different colour evolution before peak light and a stronger shoulder in and bands compared to other well-observed SNe Ia. In particular, the rise time appears to be longer than what is expected from rise-time vs.decline-rate relation.
We use several methods to determine the reddening towards SN 2002er based on the colour evolution at near peak and at late phases. The (bolometric) light curve shows great similarity with SN 1996X, but also indications of a higher luminosity, longer rise time and a more pronounced shoulder 25 days past maximum.
The interpretation of the light curves was done with two independent light curve codes. Both find that given the luminosity of SN 2002er the 56Ni mass exceeds 0.6 M⊙ with prefered values near 0.7 M⊙. Uncertainties in the exact distance to SN 2002er are the most serious limitation of this measurement. The light curve modelling also indicates a high level of mixing of the nickel in the explosion of SN 2002er.
keywords:
supernovae: general - supernovae: individual: SN 2002er - techniques: photometry1 Introduction
Even though significant progress has been made in recent years, many of the properties of Type Ia Supernovae (SNe) remain largely uncertain. To address this problem, several European institutes working in this field have joined together to form the European Supernova Collaboration (hereafter ESC, Benetti et al. 2004). One of the main targets of this project is the collection of a large and homogeneous database of optical and infrared SN Ia light curves and spectra at low redshift ( 6000 km s-1). A homogeneous and well-populated database is necessary in order to search for systematic differences, evolution and/or environmental effects, and for comparison with model predictions. All these points are crucial in the use of SNe Ia as cosmological probes.
SN 2002er ( R.A.= , DEC. = +, J2000) is one of the first targets of the ESC project. It was discovered on 2002 August 23.2 UT in the spiral galaxy UGC 10743 (Fig. 1), West and North of the galaxy nucleus, during the LOTOSS-KAIT SN search (Li, Swift & Ganeshalingam, 2002). On the basis of a low resolution spectrum taken at La Palma with the Isaac Newton Telescope (INT) on August 26.9 UT, the candidate was classified by some of the ESC members as a type Ia SN, approximately 10 days before maximum brightness (Smartt et al., 2002).
Considering the early epoch of the discovery and the proximity of the host galaxy ( = 2568 7 km s-1, Falco et al. 1999), target of opportunity observations were immediately triggered at all available telescopes. Mainly thanks to the contribution of the Calar Alto Observatory, almost daily coverage over the first month could be secured for both photometry and spectroscopy.
In this paper we present the photometric results from 7 days before to over 619 days past maximum light, including the analysis of the bolometric light curve. Spectroscopic observations will be presented in a separate paper (Kotak et al., in preparation).
| date | M.J.D. | Phasea | U | B | V | R | I | Instr. | Seeing |
| (days) | (arcsec) | ||||||||
| 23/08/02 | 52509.2 | 15.0 | 17.5b | KAIT | |||||
| 24/08/02 | 52510.2 | 14.0 | 16.9b | KAIT | |||||
| 30/08/02 | 52516.8 | 7.3 | 15.48 0.04 | 15.26 0.04 | 15.00 0.04 | 14.95 0.04 | AF | 1.8 | |
| 30/08/02 | 52516.8 | 7.3 | 14.96 0.04 | 14.94 0.04 | WM | 1.5 | |||
| 30/08/02 | 52516.9 | 7.2 | 15.15 0.09 | 15.48 0.04 | 15.25 0.03 | 14.96 0.04 | 14.91 0.04 | CS | 1.6 |
| 31/08/02 | 52517.9 | 6.2 | 15.02 0.10 | 15.30 0.04 | 15.11 0.03 | 14.82 0.03 | 14.76 0.04 | CS | 1.7 |
| 31/08/02 | 52518.0 | 6.1 | 15.36 0.05 | 15.08 0.04 | 14.80 0.04 | 14.74 0.05 | JJ | 2.7 | |
| 01/09/02 | 52518.9 | 5.2 | 14.98 0.05 | 15.15 0.04 | 14.96 0.03 | 14.66 0.03 | 14.63 0.04 | CS | 1.9 |
| 02/09/02 | 52519.9 | 4.2 | 14.83 0.03 | 15.10 0.03 | 14.85 0.03 | 14.58 0.04 | CL | 1.7 | |
| 03/09/02 | 52520.9 | 3.2 | 14.82 0.03 | 14.99 0.03 | 14.83 0.03 | 14.56 0.03 | 14.51 0.03 | CL | 3.5 |
| 04/09/02 | 52521.9 | 2.3 | 14.73 0.03 | 14.92 0.03 | 14.75 0.03 | 14.49 0.03 | 14.48 0.03 | CL | 2.1 |
| 05/09/02 | 52522.8 | 1.4 | 14.45 0.03 | 14.48 0.03 | WM | 1.8 | |||
| 05/09/02 | 52522.9 | 1.3 | 14.74 0.04 | 14.90 0.03 | 14.70 0.03 | 14.47 0.03 | 14.45 0.03 | CL | 2.5 |
| 06/09/02 | 52523.8 | 0.4 | 14.46 0.03 | WM | 2.6 | ||||
| 06/09/02 | 52523.9 | 0.3 | 14.72 0.03 | 14.87 0.03 | 14.65 0.03 | 14.45 0.03 | 14.47 0.03 | CL | 1.3 |
| 07/09/02 | 52524.9 | 0.8 | 14.74 0.03 | 14.91 0.03 | 14.63 0.03 | 14.43 0.03 | 14.46 0.03 | CL | 3.3 |
| 08/09/02 | 52525.9 | 1.8 | 14.79 0.03 | 14.91 0.03 | 14.64 0.03 | 14.44 0.03 | 14.50 0.03 | CL | 3.1 |
| 10/09/02 | 52527.9 | 3.7 | 14.86 0.08 | 14.99 0.04 | 14.62 0.04 | 14.46 0.04 | 14.59 0.04 | CS | 1.6 |
| 12/09/02 | 52530.0 | 5.8 | 15.09 0.07 | 14.68 0.04 | 14.55 0.03 | 14.66 0.05 | CS | 2.2 | |
| 13/09/02 | 52530.9 | 6.7 | 15.29 0.04 | 15.21 0.03 | 14.69 0.03 | 14.62 0.04 | 14.82 0.04 | JJ | 1.2 |
| 14/09/02 | 52531.5 | 7.4 | 14.72 0.03 | 14.68 0.04 | 14.88 0.04 | BA | 2.9 | ||
| 14/09/02 | 52531.9 | 7.8 | 15.40 0.07 | 15.36 0.03 | 14.78 0.03 | 14.72 0.04 | 14.92 0.04 | JJ | 1.7 |
| 16/09/02 | 52533.5 | 9.3 | 15.54 0.07 | 14.85 0.03 | 14.80 0.04 | 14.99 0.03 | BA | 2.4 | |
| 16/09/02 | 52533.9 | 9.8 | 15.56 0.04 | 14.91 0.04 | 14.92 0.04 | 15.08 0.04 | JJ | 1.8 | |
| 18/09/02 | 52535.0 | 10.9 | 16.00 0.10 | 15.64 0.03 | 14.98 0.03 | 14.94 0.04 | 15.22 0.04 | DF | 1.5 |
| 20/09/02 | 52537.9 | 13.7 | 15.98 0.04 | JJ | 2.4 | ||||
| 21/09/02 | 52538.5 | 14.3 | 16.12 0.04 | 15.15 0.03 | 15.11 0.04 | 15.10 0.03 | BA | 2.3 | |
| 21/09/02 | 52538.8 | 14.7 | 15.11 0.04 | JJ | 1.7 | ||||
| 22/09/02 | 52539.9 | 15.7 | 16.27 0.04 | 15.12 0.04 | JJ | 1.0 | |||
| 22/09/02 | 52540.0 | 15.8 | 16.76 0.05 | 16.28 0.03 | 15.29 0.03 | 15.13 0.03 | 15.21 0.03 | DF | 2.0 |
| 23/09/02 | 52540.9 | 16.7 | 16.39 0.04 | 15.07 0.04 | JJ | 0.9 | |||
| 24/09/02 | 52542.0 | 17.8 | 16.97 0.08 | 16.51 0.04 | 15.42 0.04 | DF | 1.0 | ||
| 26/09/02 | 52544.0 | 19.9 | 17.24 0.08 | 16.74 0.03 | 15.53 0.03 | 15.17 0.04 | 15.12 0.04 | DF | 1.1 |
| 27/09/02 | 52544.9 | 20.7 | 15.55 0.03 | JJ | 1.1 | ||||
| 28/09/02 | 52545.9 | 21.7 | 15.60 0.03 | JJ | 1.2 | ||||
| 29/09/02 | 52546.5 | 22.3 | 17.04 0.05 | 15.58 0.03 | 15.21 0.04 | 14.95 0.03 | BA | 2.0 | |
| 29/09/02 | 52546.8 | 22.6 | 15.27 0.04 | 15.01 0.04 | WM | 1.5 | |||
| 29/09/02 | 52546.9 | 22.7 | 15.64 0.03 | JJ | 0.9 | ||||
| 30/09/02 | 52547.8 | 23.6 | 15.26 0.03 | 14.98 0.04 | WM | 1.6 | |||
| 30/09/02 | 52547.8 | 23.6 | 17.10 0.03 | 15.71 0.03 | 15.26 0.04 | 14.98 0.03 | AF | 1.7 | |
| 01/10/02 | 52548.9 | 24.7 | 15.72 0.03 | 15.32 0.03 | 14.93 0.03 | JJ | 1.8 | ||
| 04/10/02 | 52551.5 | 27.3 | 17.45 0.07 | 15.89 0.04 | 15.40 0.04 | 14.95 0.04 | BA | 2.8 | |
| 05/10/02 | 52552.5 | 28.3 | 17.59 0.06 | 15.99 0.04 | 15.46 0.04 | 15.04 0.04 | BA | 3.2 | |
| 07/10/02 | 52554.8 | 30.7 | 17.64 0.03 | 16.19 0.04 | 15.70 0.05 | 15.17 0.05 | MO | 0.9 | |
| 08/10/02 | 52555.8 | 31.6 | 15.77 0.04 | 15.29 0.04 | WM | 2.7 | |||
| 08/10/02 | 52555.8 | 31.6 | 17.85 0.03 | 17.71 0.04 | 16.27 0.04 | 15.75 0.03 | 15.25 0.03 | TD | 1.2 |
| 09/10/02 | 52556.8 | 32.6 | 15.82 0.04 | 15.43 0.05 | WM | 3.0 | |||
| 13/10/02 | 52560.4 | 36.2 | 16.51 0.04 | 16.04 0.04 | 15.71 0.04 | SS | 2.7 | ||
| 14/10/02 | 52561.4 | 37.2 | 17.93 0.05 | 16.58 0.04 | SS | 2.0 | |||
| 16/10/02 | 52563.8 | 39.6 | 16.23 0.04 | 15.89 0.06 | WM | 2.4 | |||
| 26/10/02 | 52573.4 | 49.3 | 18.20 0.15 | 16.95 0.05 | 16.66 0.08 | 16.29 0.14 | BA | 3.7 | |
| 27/10/02 | 52574.4 | 50.3 | 17.01 0.06 | 16.35 0.08 | BA | 4.0 | |||
| 04/03/03 | 52703.4 | 179.2 | 19.94 0.03 | 19.90 0.05 | 20.10 0.09 | 19.78 0.16 | WF | 1.5 | |
| 28/03/03 | 52726.3 | 202.2 | 20.28 0.05 | 20.17 0.04 | 20.55 0.05 | 20.20 0.07 | WF | 1.1 | |
| 09/04/03 | 52739.3 | 215.2 | 20.48 0.06 | 20.37 0.05 | WF | 1.6 | |||
| 10/04/03 | 52740.3 | 216.2 | 20.85 0.07 | 20.38 0.06 | WF | 0.8 | |||
| 29/07/03 | 52848.9 | 324.7 | 21.84 0.06 | MO | 1.1 | ||||
| 18/05/04 | 53143.3 | 619.1 | 23.1 | 23.7 | VF | 0.9 | |||
| (a) Relative to maximum (MJD= 52524.2) | |||||||||
| (b) Unfiltered magnitude reasonably well approximated to R band magnitude (Li, private communication) | |||||||||
| CS = Calar Alto 2.2m + CAFOS + CCD SITe 053; DF = Danish 1.54m + DFOSC 039; BA = BAO 0.85m + CCD 045 | |||||||||
| CL = Calar Alto 2.2m + CAFOS + CCD Loral 033; WF = ESO 2.2m + WFI 024; VF = ESO VLT + FORS1 020 | |||||||||
| JJ = JKT 1.0m + JAG 033; WM = Wendelstein 0.8m + MONICA 050; AF = Asiago 1.82m + AFOSC 034 | |||||||||
| SS = Siding Spring 2.3.m + MSSSO11 059; TD = TNG + DOLORES 028; MO = Calar Alto 3.5m + MOSCA 032 | |||||||||
2 Observations and Data Reduction
| id | U | B | V | R | I |
|---|---|---|---|---|---|
| 01 | 17.97 0.03 | 17.14 0.03 | 16.06 0.03 | 15.45 0.03 | 14.90 0.02 |
| 02 | 18.12 0.04 | 17.10 0.03 | 16.47 0.02 | 15.92 0.02 | |
| 03 | 15.93 0.02 | 15.55 0.01 | 14.70 0.02 | 14.20 0.03 | 13.75 0.03 |
| 04 | 17.03 0.02 | 16.75 0.02 | 15.92 0.03 | 15.44 0.03 | 14.99 0.02 |
| 05 | 17.12 0.03 | 16.58 0.02 | 15.55 0.01 | 14.98 0.03 | 14.42 0.03 |
| 06 | 18.01 0.02 | 16.84 0.02 | 15.30 0.02 | 14.23 0.05 | 13.03 0.04 |
| 07 | 19.05 0.02 | 18.32 0.04 | 17.85 0.03 | 17.42 0.04 | |
| 08 | 19.31 0.04 | 18.44 0.04 | 17.94 0.03 | 17.48 0.05 | |
| 09 | 18.38 0.03 | 17.31 0.04 | 16.68 0.03 | 16.13 0.05 | |
| 10 | 18.54 0.06 | 18.24 0.04 | 17.39 0.04 | 16.90 0.04 | 16.48 0.02 |
| 11 | 18.64 0.05 | 18.62 0.02 | 17.92 0.05 | 17.47 0.04 | 17.01 0.07 |
| 12 | 17.87 0.03 | 16.66 0.03 | 15.91 0.02 | 15.29 0.04 |
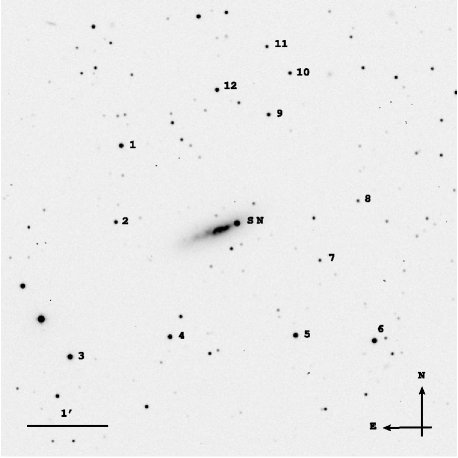
The observations of SN 2002er were performed with twelve different facilities. The main parameters of each instrument are summarized in the notes of Table 1. Basic data reduction (bias and flat-field correction) was performed using standard routines in IRAF111IRAF is distributed by the National Optical Astronomy Observatories, which are operated by the Association of Universities for Research in Astronomy, Inc, under contract to the National Science Foundation.. Selected observations of standard fields (Landolt, 1992) during photometric nights have been used to compute the colour terms for each instrument and to calibrate a local standard sequence, which in turn, was used to calibrate frames obtained under non-photometric conditions. The stars of the local sequence are identified in Fig. 1 and their magnitudes are listed in Table 2 along with estimated root mean square (RMS) errors, which are typically on the order of 0.03 mag. Since the SN was projected onto a region with quite a complicated background, photometry was performed using the PSF fitting technique. Uncertainties for the magnitude measurements were estimated by combining the fit errors in quadrature with those introduced by the transformation of instrumental magnitudes into the Johnson-Cousin standard system (Bessell, 1990).
3 Photometric systems characterisation
| Facilities | ||||||||
|---|---|---|---|---|---|---|---|---|
| sy | ph | sy | ph | sy | ph | sy | ph | |
| CAFOS+Loral | 0.129 | 0.108 | 0.073 | 0.069 | 0.011 | 0.062 | 0.209 | 0.236 |
| CAFOS+Site | 0.122 | 0.120 | 0.067 | 0.052 | 0.015 | 0.021 | 0.231 | 0.209 |
| DOLORES | 0.064 | 0.077 | 0.115 | 0.108 | 0.041 | 0.026 | 0.020 | 0.013 |
| DFOSC | 0.063 | 0.089 | 0.008 | 0.010 | 0.016 | 0.013 | 0.040 | 0.044 |
| JKT | 0.043 | 0.055 | 0.032 | 0.038 | 0.014 | 0.009 | 0.060 | 0.047 |
| AFOSC | 0.015 | 0.040 | 0.054 | 0.060 | 0.074 | 0.060 | 0.042 | 0.040 |
| MOSCA | 0.212 | 0.219 | 0.034 | 0.030 | 0.007 | 0.018 | 0.164 | 0.140 |
| SSO | 0.030 | 0.022 | 0.008 | 0.015 | 0.031 | 0.015 | 0.030 | 0.035 |
| WFI | 0.226 | 0.242 | 0.070 | 0.068 | 0.024 | 0.010 | 0.018 | 0.038 |
It is well known that different instrumental photometric systems never
exactly match. It is also known that the colour equations
used to transpose the instrumental magnitude into a standard system
loose their accuracy for objects characterised by a non-stellar
spectrum. Since the photometry of SN 2002er was obtained using almost
all the instruments available to the ESC and these facilities will be
used to monitor other targets in the future, we have decided to
perform a detailed characterisation of the photometric properties of each
instrument. This in fact allows us to correct the systematic photometric errors introduced by the combination of the caveats just mentioned before, using the S-correction method presented by Stritzinger et al. (2002) and Krisciunas et al. (2003).
In order to compute the corrections, one needs first to determine the
instrumental passband :
where is the filter transmission function, is the detector quantum efficiency, is the continuum atmospheric transmission profile, is the mirror reflectivity function and is the lens throughput. We determined for all the facilities for which we could obtain the previously mentioned information. i.e. CAFOS+Loral, CAFOS+SITe, JKT, AFOSC, DFOSC, MOSCA, DOLORES, 2.3m SSO and WFI. and were usually downloaded from the instrument web sites. We obtain for Calar Alto and La Palma in Hopp et al. (2002) and King (1985) respectively, while for La Silla we have used the CTIO transmission curve in the IRAF reduction package. Finally, for Asiago and Siding Spring Observatory we obtained by modifying the standard atmospheric model proposed by Walker (1987) in order to match the average broad band absorption coefficients of those sites. For we have used a standard aluminium reflectivity curve. For the lenses several materials are generally used, but the corresponding are relatively flat across the optical range. Since it is very difficult, and often not possible to get this information for all the instruments used, we have decided to assume that is constant across the whole spectral range. This might cause some problems at wavelengths bluer than 3400 Å, i.e. affecting the passband. However we have decided not to determine for the U filter, since very few SN spectra cover this wavelength range, making it very difficult to compute the relative S-correction.
Once the response functions are constructed, one needs to calculate an instrumental zero point for each passband. For this purpose we have used a subset of spectrophotometric standard stars (Hamuy Hamuy_1 1992,Hamuy_2 1994), for which photoelectric photometry is also available (Cousins1971,1980,1984). In order to check how well the modelled passbands match the real ones we derived synthetic colour terms using the full set of Hamuy spectrophotometric standards. As the reader can see in Table 3, the match with the colour terms computed using the classical photometric method is quite good for all instruments, especially in the band. Of course, this is not a definitive proof that the reconstructed passbands perfectly resemble the real ones, since the stellar spectra, which are dominated by a smooth continuum, are not the best tool to highlight differences between photometric systems. However, the tight correspondence shown by this test makes us confident that the reproduction is reasonably accurate.
With this information we can check the accuracy of our photometry and use the S-correction technique in order to remove possible systematic errors. With the aim of computing a reliable correction for the whole phase range covered by the photometry, we decided to use not only the best flux calibrated spectra of SN 2002er, but also a set of spectra from SN 1992A (ESO-Key Project, unpublished), SN 1994D (Patat et al., 1996) and SN 1996X (Salvo et al., 2001), properly reddened in order to match the continuum of SN 2002er. The spectra were also shifted to the SN 2002er rest frame. These SNe have very similar spectra at every phase and as the reader can see in Fig. 2, this makes the S-correction reasonably similar. Moreover, the spectra of different SNe are uniformly distributed along the light curve, preventing possible systematic errors. The similarity between the used spectra is a crucial point. To prove it, in Fig. 2 we have also plotted the corrections computed for another ESC target, SN 2002bo (Benetti et al., 2004), that is a SN characterised by different features and reddening. As the reader can easily note, especially in the B band, the corrections are significantly different from those of the other SNe. To describe the behaviour of the S-correction as a function of time, for each instrument we have fitted a third or fourth order polynomial to the data points. The RMS deviation of the observed points from the fitted law gives us an estimate of the error associated with the correction itself. This includes both the uncertainties relative to the flux calibration of the input spectra and the noise generated by using data from different SNe. For the band, where the phase coverage is quite scanty, the correction was obtained by linear interpolation. For this filter the uncertainties are larger than in , and . This is due both to the sparse sampling and to the fact that the sensitivity of most spectrographs falls toward the red edge of the band, making the flux calibration, and in turn, the S-correction less reliable.

A further way to check the effectiveness of the S-correction is the comparison between the data spread before and after its application. The RMS deviation from a fitted polynomial in and is reduced by a 0.001 and 0.002 magnitudes respectively, while for the filter it does not change. This negligible improvement simply means that the original photometry was substantially accurate. The correction in those bands is in fact quite small (see Table 4), and the observed scatter is dominated by the random photometric error. Nevertheless, our main goal was to check and eventually remove systematic effects introduced by the instrumental photometric system. For example, the peak brightness of SN 2002er was covered mainly with CAFOS and during this phase range the S-correction for CAFOS and bands was +0.01 and 0.025 respectively. This makes the SN 0.035 mag bluer than it really is, and this has some impact, for instance, on the reddening estimate.
Generally, the passband departs from the standard one more than in all other filters, and in
turn, the corrections are larger. In this case, the systematic errors
introduced by the natural photometric system mismatch are comparable to,
or larger than, random errors. Therefore, after the correction, the
RMS falls to a more meaningful value (0.017 mag). We note that
this mismatch between the natural systems could be one of the reasons
why the light curves of type Ia SNe usually show differences which
are more pronounced than in any other filter (see for example Suntzeff
1996).
For the 0.85m Beijing and 0.80m Wendelstein
telescopes it was not possible to find the basic information needed to
compute the global response. Since the original photometry obtained at
these two observatories was not too different from that of the others,
we have conservatively applied the closest in time correction derived
for the observations carried out with known passbands. The magnitudes
reported in Table 1 are the original measurements but all
the relevant parameters like , and so on, were
computed using the corrected data.
| MJD | Phasea | Facilities | ||||
|---|---|---|---|---|---|---|
| (days) | ||||||
| 52516.8 | 7.3 | 0.010 0.006 | 0.004 0.005 | 0.003 0.002 | 0.036 0.012 | AF |
| 52516.8 | 7.3 | 0.005 | 0.016 | WM | ||
| 52516.9 | 7.2 | 0.012 0.007 | 0.021 0.005 | 0.004 0.002 | 0.016 0.014 | CS |
| 52517.9 | 6.2 | 0.012 0.007 | 0.023 0.005 | 0.004 0.002 | 0.019 0.014 | CS |
| 52518.0 | 6.1 | 0.020 0.006 | 0.005 0.006 | 0.002 0.001 | 0.042 0.012 | JJ |
| 52518.9 | 5.2 | 0.011 0.007 | 0.024 0.005 | 0.003 0.002 | 0.021 0.014 | CS |
| 52519.9 | 4.2 | 0.009 0.007 | 0.025 0.005 | 0.003 0.002 | CL | |
| 52520.9 | 3.2 | 0.007 0.007 | 0.025 0.005 | 0.003 0.002 | 0.026 0.014 | CL |
| 52521.9 | 2.3 | 0.004 0.007 | 0.026 0.005 | 0.002 0.002 | 0.028 0.014 | CL |
| 52522.8 | 1.4 | 0.002 | 0.030 | WM | ||
| 52522.9 | 1.3 | 0.000 0.007 | 0.026 0.005 | 0.002 0.002 | 0.030 0.014 | CL |
| 52523.8 | 0.4 | 0.002 | WM | |||
| 52523.9 | 0.3 | 0.004 0.007 | 0.026 0.005 | 0.002 0.002 | 0.032 0.014 | CL |
| 52524.9 | 0.8 | 0.008 0.007 | 0.025 0.005 | 0.002 0.002 | 0.035 0.014 | CL |
| 52525.9 | 1.8 | 0.012 0.007 | 0.024 0.005 | 0.002 0.002 | 0.037 0.014 | CL |
| 52527.9 | 3.7 | 0.019 0.007 | 0.023 0.005 | 0.002 0.002 | 0.041 0.014 | CS |
| 52530.0 | 5.8 | 0.020 0.005 | 0.002 0.002 | 0.046 0.014 | CS | |
| 52530.9 | 6.7 | 0.005 0.006 | 0.005 0.006 | 0.001 0.001 | 0.034 0.012 | JJ |
| 52531.5 | 7.4 | 0.006 | 0.001 | 0.040 | BA | |
| 52531.9 | 7.8 | 0.004 0.006 | 0.006 0.006 | 0.001 0.001 | 0.041 0.012 | JJ |
| 52533.5 | 9.3 | 0.002 | 0.008 | 0.001 | 0.042 | BA |
| 52533.9 | 9.8 | 0.002 0.006 | 0.009 0.006 | 0.001 0.001 | 0.042 0.012 | JJ |
| 52535.0 | 10.9 | 0.001 0.005 | 0.029 0.004 | 0.000 0.002 | 0.064 0.010 | DF |
| 52537.9 | 13.7 | 0.001 0.006 | JJ | |||
| 52538.5 | 14.3 | 0.001 | 0.013 | 0.000 | 0.048 | BA |
| 52538.8 | 14.7 | 0.048 0.012 | JJ | |||
| 52539.9 | 15.7 | 0.001 0.006 | 0.049 0.012 | JJ | ||
| 52540.0 | 15.8 | 0.004 0.005 | 0.028 0.004 | 0.000 0.002 | 0.050 0.010 | DF |
| 52540.9 | 16.7 | 0.002 0.006 | 0.051 0.012 | JJ | ||
| 52542.0 | 17.8 | 0.004 0.005 | 0.025 0.004 | DF | ||
| 52544.0 | 19.9 | 0.004 0.005 | 0.022 0.004 | 0.000 0.002 | 0.039 0.010 | DF |
| 52544.9 | 20.7 | 0.014 0.006 | JJ | |||
| 52545.9 | 21.7 | 0.014 0.006 | JJ | |||
| 52546.5 | 22.3 | 0.018 | 0.038 | 0.008 | 0.024 | BA |
| 52546.8 | 22.6 | 0.002 | 0.024 | WM | ||
| 52546.9 | 22.7 | 0.013 0.006 | JJ | |||
| 52547.8 | 23.6 | 0.002 | 0.042 | WM | ||
| 52547.8 | 23.6 | 0.020 0.006 | 0.037 0.005 | 0.009 0.002 | 0.020 0.012 | AF |
| 52548.9 | 24.7 | 0.011 0.006 | 0.002 0.001 | 0.037 0.012 | JJ | |
| 52551.5 | 27.3 | 0.001 | 0.006 | 0.002 | 0.007 | BA |
| 52552.5 | 28.3 | 0.011 | 0.000 | 0.024 | 0.017 | BA |
| 52554.8 | 30.7 | 0.013 0.005 | 0.008 0.005 | 0.026 0.006 | 0.006 0.010 | MO |
| 52555.8 | 31.6 | 0.024 | 0.016 | WM | ||
| 52555.8 | 31.6 | 0.008 0.006 | 0.002 0.006 | 0.024 0.003 | 0.016 0.012 | DO |
| 52556.8 | 32.6 | 0.000 | 0.016 | WM | ||
| 52560.4 | 36.2 | 0.002 0.004 | 0.010 0.003 | 0.050 0.006 | SS | |
| 52561.4 | 37.2 | 0.012 0.003 | 0.002 0.004 | SS | ||
| (a) Relative to maximum (MJD= 52524.2) | ||||||
4 Interstellar Extinction
The presence of interstellar extinction toward SN 2002er is not unexpected, since it appears projected onto the disk of UGC 10743 (see Fig. 1). Moreover, its relatively low galactic latitude (=+26∘) suggests the presence of absorbing material in our Galaxy too. Indeed, in the mediumresolution spectrum of SN 2002er reported in Fig. 3, the NaI D absorption lines are evident for both the Milky Way and the host galaxy.

In order to estimate the intrinsic luminosity of the SN it is crucial to correct for extinction. In addition to the “classical” methods reported in Phillips et al. (1999) and more recently proposed by Wang et al. (2003) and Altavilla et al. (2004), we have also estimated the colour excess of SN 2002er by comparing its colour evolution with that of SN 1996X. These two events, in fact, were very similar to each other as shown by the light curves (see Fig. 4) and spectra (Kotak et al. in preparation).
| Method | Reference | |
|---|---|---|
| Phillips et al. (1999) | ||
| Phillips et al. (1999) | ||
| Altavilla et al. (2004) | ||
| CMAGIC | Wang et al. (2003) | |
| Phillips et al. (1999) | ||
| Salvo et al. (2001) |
As pointed out by Leibundgut (1988), the derived absorption toward a SN varies with the light-curve phase, due to the significant colour evolution that these events undergo. Therefore the presence of the interstellar material along the line of sight acts to change the shape of the light curve. To take this effect into account, we have applied the correction around maximum brightness and in the tail phase following the prescription given by Phillips et al. (1999). As in the comparison with SN 1996X, to account for the colour excess evolution we need to compute a time dependent correction to be applied to the observed of SN 2002er. For this purpose we have artificially reddened a sample of archival SN spectra, originally affected by a negligible amount of extinction, and derived the evolution as a function of the SN phase. The full results of this work will be reported in a forthcoming paper (Pignata et al. in preparation).
Thanks to this procedure and to the S-correction that
we applied to the data, all the reddening estimates are consistent
within (see Table 5). The first four methods
listed in Table 5 use maximum brightness data and only the
last two exploit information carried by the tail and the whole
phase range, respectively. Therefore, we have first computed the
weighted average of the maximum values, , this
representing the maximum light methods. Then
the final estimate of was calculated as a weighted average of
, and . This gives .
Krisciunas et al. (2004) have presented and templates for “Midrange” decliners and they have proposed to use them as a tool to estimate the extinction suffered by a SN.
Using our single epoch IR observations (see section 5.3) we have obtained and , from the and colours, respectively. Both values are in reasonable agreement with those reported before. We have not included these estimates in the computation of the final value, because a single epoch measurement might introduce a systematic error if the observations were performed under non photometric conditions. Nevertheless, it tends to confirm that the reddening we have got from the optical photometry is correct.
A totally independent way of estimating the extinction is given by the relation between and the equivalent width of the NaI D lines, as first proposed by Barbon et al. (1990). More recently, Turatto et al. (2003) have shown that two different linear relations with different slopes seem to exist. In the case of SN 2002er the relation with smaller slope gives for the Milky Way and for the total amount of reddening. These values are in good agreement with the value reported in Schlegel, Finkbeiner & Davis (1998) for the Galaxy alone (0.16) and the total value we get from the photometry (0.36), respectively.
5 Light and colour Curves
5.1 Maximum light
The light curves of SN 2002er are shown in Fig. 4. For comparison, the light curves of three other Type Ia SNe with similar values of are also sketched. From the plot it is evident that SN 2002er resembles reasonably well all the three template SNe, the match being the best with SN 1996X. SN 2002er follows the behaviour of this object even in the band, where the differences between Type Ia SNe are usually more pronounced (Suntzeff, 1996).
Our well sampled data give us the possibility of making a detailed comparison with the other three SNe. In the band the light curve of SN 2002er shows a different behaviour with respect to SN 1994D. In particular our object resembles SN 1994D between 3 and +15 days, while later on SN 2002er becomes brighter. Unfortunately there are not a lot of observations of SN 1996X in the filter, but the few available points are very close to those of 1994D. The light curve shows less pronounced differences. For this band the SN Ia template (Leibundgut, 1988) stretched by a suitable factor (Perlmutter et al., 1997a) is also reported. The template fits the data reasonably well over the whole phase range. For the and filters we notice that the shoulder visible between +20 and +30 days is more pronounced, and starts slightly later than in SN 1994D and SN 1992A, it is also stronger than SN 1996X. In the light curve, the secondary maximum is achieved roughly at the same epoch of SN 1996X and it is 0.53 mag fainter than the first maximum, a value which is very similar to that of SN 1996X (0.52 mag).
As far as the pre-maximum phase is concerned, the comparison between SN 2002er and SN 1994D seems to show a systematic shift in the rise time differences as we go from the blue to the red passbands. The two SNe exhibit similar behaviours in and filters, but SN 2002er reaches maximum light more slowly than SN 1994D in the and bands and faster in the filter.
The early discovery of SN 2002er also gives us the opportunity to apply the method of (Riess et al., 1999b) for estimation of the explosion date (). The main hypothesis of this method is that Type Ia SN shortly after the explosions could be represented as a expanding fireball. The SN luminosity is therefore proportional to the square time since the explosion. Combining the two unfiltered measurements reported in the discovery IAU Circular (Li et al. 2002), which can be reasonably well approximated to a band magnitude (Li, private communication), with our early photometry, we obtain (MJD). In this estimate we have considered only points up to 8 days before the R maximum light, since, as shown by Riess and collaborators, the reduced rises dramatically if later data are included in the fit. Taking into account the 1.5 days delay between and maxima, with the 7 available measurements we finally derive a rise time days, which is larger than the days implied by the relation of Riess et al. (1999b) given the of SN 2002er.
As mentioned before, reddening acts to change the shape of the light curve, especially, in the filter, decreasing its decline rate. To compute the reddening free band , we applied the correction found by Phillips et al. (1999) and obtained . Also the stretch factor was computed correcting the light curve for the reddening effect using the time dependent correction mentioned in the previous section. We note that the reddening corrected values of and stretch factor , satisfy reasonably well both the relations reported by Perlmutter et al. (1997b) and Altavilla et al. (2004).
The main photometric parameters of SN 2002er are reported in Table 6. Maximum light epochs and magnitudes were estimated in each band fitting a low order polynomial. We note that the time offsets between maxima in different passbands fall in the range reported in Contardo et al. (2000). In fact, SN 2002er reached maximum brightness in the and band slightly earlier than in the filter, but roughly two days later in and .


| Host galaxy | UGC 10743 |
|---|---|
| Galaxy type | Sa? (De Vaucouleurs, 1991) |
| Sc (Christensen et al., 2003) | |
| RA (2000) | 17h11m30s.7 |
| Dec (2000) | +07∘59’44”.8 |
| Recession velocity [km s-1] | 2568 7 (Falco et al., 1999) |
| 2560 20 (Christensen et al., 2003) | |
| Recession velocity | 2652 33 |
| corrected for LG infall onto | |
| Virgo [km s-1] | |
| Distance modulus | = 32.9 0.2 |
| (=71 km s-1 Mpc-1) | |
| Date of max (MJD) | 52524.2 0.5 |
| Offset from the nucleus | West and North |
| Magnitude at max and | = 14.72 0.04 0.5 [days] |
| time respect the max | = 14.89 0.03 0.0 [days] |
| = 14.59 0.03 2.0 [days] | |
| = 14.43 0.03 1.5 [days] | |
| = 14.49 0.05 0.6 [days] | |
| Magnitude and epoch | 14.97 0.05 25.5 [days] |
| of the second max | |
| Reddening Corrected | |
| Colours at time of max | |
| in | 1.33 0.04 |
| stretch factor in | 0.89 0.02 |
| Late phase decline rate | =1.29 0.04 =1.48 0.04 |
| mag 100d-1 | =2.03 0.05 =1.67 0.11 |
The de-reddened colour curves of SN 2002er are compared in Fig. 5 with those of SN 1994D, SN 1996X, SN 2002bo and with the colour template of Nobili et al. (2003) stretched by a factor . The color evolution of SN 2002er is very similar to all the other objects and it is well reproduced by the Nobili curve. In the differences between SNe are more pronounced. In particular between 0 and +8 days SN 2002er shows neither the redder bump of the two events nor the bluer dip of SN 2002bo. Indeed, in this phase interval, the evolution is intermediate between the two cases. Anyway the overall curve shape is quite well reproduced by the Nobili template, but until +25 days it is about 0.1 mag bluer.
The colour evolution all the SNe return to be quite similar. We just note that until +9 days the SN 2002er evolution is very close to those of SN 1996X, SN 1994D and the Nobili template, while SN 2002bo appears to be bluer. After +10 days, SN 2002er becomes bluer, reaching almost the same colour as SN 2002bo.
5.2 Nebular phase
SN 2002er was observed also at late phases, i.e. between six months and one year after the explosion. The complete light curves to the latest epoch are shown in Fig. 6, together with those of SN 1992A and SN 1996X. For presentation, the light curves of the last two objects have been shifted to fit SN 2002er around maximum. The late time decline rates , computed after day 150, are compatible within the errors with those of SN 1992A and SN 1996X. As found by Boisseau et al. (1991) at late epochs the background contamination can play a relevant role and this could be the reason why in each filter the points of SN 2002er lie about 0.1-0.2 magnitudes above those of SN 1992A and SN 1996X. This could be also the reason why in the last B band point this gap seems to became larger. Another possible source of systematic errors might be related to the non-standard nature of the WFI filters. In fact, in this phase range the emission features dominating the SN spectrum indeed act to amplify the effect of the passband mismatch. In particular, in Type Ia, the strongest feature around 4700 Å identified as FeIII completely dominates the flux in the band. This, together with the fact that the WFI band departs considerably from the standard one, makes the S-correction for this instrument rather large. Using reddened late spectra of SN 1996X and SN 1992A we found a value around 0.3 mag for SN 2002er. Also within the band there is quite a prominent feature at 5300 Å attributed to FeIII + FeII. However, in this case the WFI band is not so different from the Bessell one, so the effect is quite small (0.05 magnitudes). In the wavelength range covered by the and filters the spectrum is smoother than in the blue part. Therefore, even if the mismatch between the , WFI bands and the , Bessell bands is noticeable, the corrections are below 0.1 magnitudes. Unfortunately due to the low signal-to-noise ratio, the flux calibration of these late time spectra is not precise enough to compute a reliable correction. However, since the spectral evolution at late phases is very slow, the bands mismatch should not affect the decline rate (see Table 6) which at this epoch is the most important photometric parameter. As mentioned by Turatto et al. (1990), the colour of Type Ia SNe remains constant after six months from the peak brightness. SN 2002er conforms to this behaviour: between day 179 and day 215 is constant within the errors. The weighted mean of the three available measurements is . At the present date the latest and imaging of SN 2002er was performed 619.1 days after maximum light. The goal of these observations was to detect a possible light echo. In fact, the detection of this rare phenomenon, observed only in two Type Ia SNe (SN 1991T, Schmidt et al. 1994 and SN 1998bu, Cappellaro et al. 2001), would allow one to get some information on the SN environment. Using artificial stars placed at the SN position, we estimate a 3 upper limit of =23.1 and =23.7 for SN 2002er at the previously mentioned epoch. Given these detection limits, we would have detected, for instance, a light echo similar to that shown by SN 1998bu, at least in the passband. Of course we can not exclude a fainter echo, for example, as the one shown by SN 1991T.
5.3 Near-IR Photometry
A single epoch (19.9 days past maximum light) Near-IR imaging was carried out at NTT Telescope using the SOFI IR camera on September 26.9 UT 2002. This instrument uses a Hawaii HgCdTe 1024x1024 array and was operated at a plate scale of 0.29 arcsec/pixel. Data reduction was performed using standard routines in IRAF. As in the Optical, IR photometry was carried out using the PSF fitting technique. The calibrated magnitudes are , and . The associated errors are probably underestimate, since the observations were performed under unknown transparency conditions Nevertheless the and colours are compatible within the uncertainties, with those of the Elias et al. (1985) IR templates.
6 Absolute luminosity and bolometric light curves
UGC 10743, the parent galaxy of SN 2002er, has a radial velocity with respect to the CMB reference frame of =2573 8 km s-1 (LEDA). To compute a reliable distance using the Hubble law, the recession velocity has to be corrected for motion departures from the Hubble flow. One of the components of the peculiar motion is due to the Local Group (LG) infall into the Virgo Cluster. Using an infall velocity of 224 90 km s-1 (Bureau et al., 1996) we obtain a corrected velocity of =2652 33 km s-1 for UGC 10743. Assuming = 71 8 km s-1 Mpc-1 (Freedman et al., 2001), we derive a distance modulus = 32.9 0.2. Taking into account the estimated and using the Cardelli, Clayton & Mathis (1989) law of extinction in the passbands, we obtain = 19.9 0.3, = 19.5 0.2, = 19.4 0.2, = 19.3 0.2 and = 19.0 0.2. Another way to estimate the absolute magnitude is via the linear relations between and first proposed by Phillips (1993). This was later revised, especially for the band, by other authors, the most recent of whom is Altavilla et al. (2004). Adopting the Altavilla et al. (2004) values -19.613 0.037 and 1.102 0.147 for the linear coefficients, we obtain = 19.35 0.07 for SN 2002er, which is in quite good agreement with our previous estimate of .
Using the computed distance modulus and reddening and adding the UV and IR contributions given by Suntzeff (1996) to our well-sampled data for SN 2002er, we were able to construct the light curve. This is presented in Fig. 7. In the left panel, we compare the light curve of SN 2002er (filled circles) with that of SN 1996X (solid line) (Riess et al. 1999a, Salvo et al., 2001) shifted by +0.07 dex to obtain a best fit around maximum. The similarity in the light curve shape between the two objects is remarkable. SN 2002er shows only a longer rise time and a small deviation around the second maximum due to its more pronounced shoulder in the red passbands. The 0.07 dex difference could be due to: (a) the uncertainties in the distance modulus caused by an error either on the Hubble flow recession velocity or on value (or a combination of both); (b) the uncertainty in the reddening estimate; (c) an intrinsic difference in the mass of 56Ni produced (or a combination of all three). Concerning the extinction, even if the colour excess is known with high accuracy, one has to assume a value for the total-to-selective absorption coefficient. Typically, the values of Cardelli et al. (1989) are adopted. Recently, Phillips et al. (1999), Wang et al. (2003) and Altavilla et al. (2004) have shown that for SN host galaxies a lower value of decreases the dispersion in the vs. relation. In particular Altavilla et al. (2004), adopting and the Period-Luminosity-Colour relation of Freedman et al. (2001), have obtained = 72 7 km s-1 Mpc-1. These values of and change the estimate of both the absorption and the distance modulus of SN 2002er. In the right panel of Fig. 7 we show the light curve (open circles) of SN 2002er obtained assuming = 72 7 km s-1 Mpc-1, and adopting the total-to-selective absorption coefficients in the , , , and bands that correspond to . As the reader can see, this curve resembles closely that of SN 1996X (dashed line) plotted without any shift relative to SN 2002er. While this might be seen as proof that the difference between the curves of SN 2002er and SN 1996X is due to reddening and distance uncertainties, the light curves of other similar SNe are less supportive of this point of view. Also shown in the right panel of Fig. 7 are the light curves of SN 1992A, SN 1994D. Together with SN 1996X, these SNe have well-determined distances, low extinction and similar values. Yet, in spite of these similarities, their luminosities are quite different. In other words, in spite of the high similarity of SN 1996X and 2002er, the value alone may not specify the SN luminosity.
We have modelled the bolometric light curve of SN 2002er using our Monte Carlo light curve code (Mazzali, 2000). The code follows the emission, propagation, and deposition of the -rays and the positrons emitted in the decay chain 56Ni 56Co56Fe, using constant -ray and positron opacities cm2g-1 and cm2g-1, respectively. It then follows the random walk of the optical photons thus generated, adopting a time dependent optical opacity appropriate for SNe Ia as in Mazzali (2000). We used a W7 (Nomoto, Thielemann & Yokoi, 1984) density/velocity structure to characterise the SN ejecta. In Fig. 7 (left panel) we compare the model light curve (56Ni mass set to 0.75) with the observed light curve of SN 2002er. This model provides a good fit to the brightness and width near the peak but fails to reproduce the bump seen at 25 days. This is probably due to sudden changes in the opacity which our model does not take into account at advanced stages.
The mass of 56Ni is comparable to the value estimated for SNe Ia having significantly slower decline rates. This suggests, as mentioned before, that the estimated distance and/or reddening to SN 2002er may have been overestimated. Alternatively (or in addition) it may be that a single parameter is not enough to describe the type Ia event, i.e. the 56Ni mass may not be as strongly correlated with the light curve shape as has been suggested in the past.

7 Light Curve Models
Observed light curves and spectra provide the most direct test of explosion models. Here we present some synthetic light curves, not fitted to SN 2002er, to help interpreting the data. For the interpretation of the colour light curves of SN 2002er (as well as other Type Ia SNe) we will rely on the standard assumption that they are white dwarfs, composed of carbon and oxygen, near the Chandrasekhar mass, disrupted by thermonuclear burning. In the “classical” W7 model the velocity of the thermonuclear burning front is parametrized in order to fit the spectra of observed SNe Ia. More recent 3-dimensional explosion models (Reinecke, Hillebrandt &. Niemeyer 2002a,b) are essentially free of such non-physical parameters. They can only vary the ignition conditions and the condition and composition of the exploding white dwarfs allowing more self-consistent prediction of the light curves and spectra. Here we present synthetic light curves based on both types of model, and compare them with SN 2002er.
We use the light curve code STELLA described in Sorokina & Blinnikov (2003). It computes broad-band (and bolometric) light curves by solving (implicitly) the time-dependent equations for the angular moments of the intensity in fixed frequency bins, coupled to (Lagrangian) hydro-dynamics. In doing so no specific temperature has to be ascribed to the radiation. The photon energy distribution may be quite arbitrary.
While in this prescription the radiation is not in equilibrium we assume LTE for ionization and level population. NLTE effects are simulated by using the approximation of the absorptive opacity in spectral lines. In general, the effect of line opacity is treated as an expansion opacity (Eastman & Pinto 1993, Sorokina & Blinnikov 2002). It is obvious that these approximations gradually loose reliability at late epochs when the SN enters the nebular phase, and also are less accurate for the infrared passbands in which the ejecta are more transparent. Therefore, here we will concentrate mainly on the early light curves.
Our results are shown in Fig. 8. First of all one can see that the W7-model reproduces rather nicely the rise of SN 2002er in the , and passbands, and also the peak luminosities are in fair agreement with this model, which had a 56Ni-mass of about 0.7 M⊙. In contrast, the 3D model of Reinecke et al. (2002b) with less 56Ni ( 0.4 M⊙) is too faint, but is in better agreement with the shape of the light curves in , , and . The rather poor fits to the I-band light curve may reflect shortcomings of the light curve modelling, as was discussed before.
The main reason for the broader light curves of the 3D supernova model, as compared to W7, is the presence of high-velocity radioactive Ni in the outer layers of the model which is not predicted by the spherical model W7. Together with the fact that SN 2002er also showed high-velocity Si and Ca in its early spectra (Kotak et al. in preparation) this adds weight to the argument that the ejecta of SN 2002er, like those of SN 2002bo (Benetti et al., 2004), are heavily mixed.

8 Conclusions
One of the main aims of the ESC project is the accurate and detailed study of nearby Type Ia SNe in order to improve our knowledge of this class of objects especially with respect to their use for cosmological purposes.
The first step along this path is the construction of a data-base of well-sampled light curves and spectroscopic data sets. SN 2002er is one of the first targets of this observational campaign. For this object, which was discovered about 14 days before maximum light, we secured good spectroscopic coverage starting with day 11 and this will be presented and discussed in a forthcoming paper (Kotak et al., in preparation). Here we have reported the results of the photometric observations, which were carried out using a large set of telescopes and instruments.
The measurements, which started on day 7.3, provided very good sampling of the maximum light era and extended up to ten months after the explosion. The ESC project aims at a high level of observational precision and we have made particular efforts to correct for the departures of the instrumental photometric systems from the Johnson-Cousins standard system. This analysis has shown that in some cases this can cause time- and SN spectrum-dependent systematic deviations which can indeed hinder the cross-comparison with other SNe. In this respect, we note that the passband shows the largest number of variations on the Cousins theme. We note also that published Type Ia SN light curves show the largest variety in this passband (Suntzeff, 1996). Therefore, some of the diversity seen in this filter might be due to instrumental effects, a suspicion which certainly needs more investigation, including cross-checks with the spectral appearance of single objects in this wavelength range.
One of the problems we had to solve with SN 2002er is the extinction
correction. Interstellar absorption was expected due to the location
of the SN on the disk of the edge-on host spiral galaxy. Indeed,
clear signs of interstellar absorption was present in the
classification spectrum in the form of NaI D absorption lines
(Smartt et al., 2002). This was confirmed by the colour curves analysis which
led to = 0.36 0.05.
Dereddening the light curves,
assuming a standard total-to-selective absorption coefficient
, we obtain a peak bolometric luminosity for SN 2002er of
= 43.2 0.2 erg s-1 which is 0.07 dex (i.e. 17%) larger
than that of SN 1996X. This is in spite of the very similar shapes of
the bolometric light curves of the two SNe. However, by setting
for the host galaxy, we obtain excellent agreement for both the light curve
shapes and luminosities. The impressive resemblance to SN 1996X
suggests that the artificial shift we had to apply to match the two
curves is due to distance and/or reddening errors. However, we do not
rule out the possibility that the luminosities of SN 2002er and
SN 1996X might be intrinsically different. This suspicion is
strengthened when we examine the bolometric light curves of SN 1992A,
SN 1994D and SN 1996X. These SNe are characterized by low extinction,
better constrained distances and similar , and yet
their absolute luminosities are quite different. We conclude that the
single parameter characterisation of the Type Ia SN may sometimes lead
to incorrect luminosity estimates i.e. the 56Ni mass may not be
as strongly correlated with the light curve shape as has been
suggested. More information about the similarity between SN 2002er
and SN 1996X will be provided by the spectroscopic analysis, which
through synthetic spectral modelling, will also give independent
distance and reddening estimates (Kotak et al., in preparation).
We have compared the light curves of SN 2002er using two type of explosion codes: from Nomoto et al. (1984) and the 3-D models from Reinecke et al. (2002b). seems to better reproduce the rise and peak luminosity of the SN 2002er light curves, but it fails in the post maximum phase. The 3-D explosion model appears to be systematically fainter than the observed data, but better reproduces the overall shape. The 3-D model predicts 0.4 M⊙ of 56Ni, while produces a larger amount (0.7 M⊙). The latter 56Ni-mass value is in good agreement with the value obtained by modelling the bolometric light curve (0.75 M⊙). As mentioned in section 6, such a large 56Ni mass is more common for slower-declining SNe Ia. The 56Ni mass could be overestimated due to errors in the distance and/or absorption values, but it may also imply that the correlation with the light curve shape is not so strong.
Although SN 2002er could be defined as a “normal” Type Ia SN, some small differences, not affected by the uncertainties in distance and reddening, have been highlighted thanks to the excellent photometric coverage. Comparison of the pre-maximum phase of SN 2002er with that of SN 1994D shows that, despite the two SNe having similar , SN 2002er rises more slowly in the and bands but faster in the filter. The light curves of SN 2002er and SN 1996X are almost indistinguishable until 30 days after the maximum light, but the shoulder between 15 and 30 days in the and bands is clearly more pronounced in SN 2002er than in SN 1996X. SN 2002er also exhibits a deeper and earlier minimum in the I filter than does SN 1996X. The curves show an even larger dispersion: on the one hand one has normal events like SN 1994D or SN 1996X and on the other deviant objects like SN 2002bo ( 1.1), which at any time is clearly bluer (see for example Fig. 6). SN 2002er shows an intermediate behaviour.
All these facts tend to support the emerging idea that a single parameter description is not sufficient to fully characterise Type Ia SNe (see the discussion in Benetti et al. 2004).
Acknowledgments
We thank Enrico Capellaro for carefully reading the manuscript and for his advise on photometric data reduction. Stephen J. Smartt thanks PPARC for the financial assistance. This work is partially based on observations made with ESO Telescopes at the La Silla Observatory under programme ID 169.D-0670, ID 59.A-9004 and Paranal Observatory under programme ID 073.D-0853. It is supported in part by the European Community’s Human Potential Programme under contract HPRN-CT-2002-00303, “The Physics of Type Ia Supernovae”. This work is also based on observations performed at Calar Alto Observatory, Spain, the Jacobus Kapteyn Telescope (JKT) of the Isaac Newton Group, La Palma, the Beijing Observatory, China, the Wendelstein Observatory, Germany, by Otto Baernbantner and Christoph Ries, the Italian Telescopio Nazionale Galileo (TNG), La Palma, the Asiago Observatory, Italy. The TNG is operated on the island of La Palma by the Centro Galileo Galilei of INAF (Istituto Nazionale di Astrofisica) at the Spanish Observatorio del Roque de los Muchachos of the Instituto de Astrofisica de Canarias. This work has made use of the NASA/IPAC Extragalatic database (NED) which is operated by the JET Propulsion Laboratory, California Institute of Technology, under contract with the National Aeronautic and Space Administration. We have also made use of the Lyon-Meudon Extragalatic Database (LEDA), supplied by the LEDA team at the Centre de Recherche Astronomique de Lyon, Observatoire de Lyon.
References
- Altavilla et al. (2004) Altavilla G. et al., 2004, MNRAS, 349, 1344
- Arnett (1982) Arnett W. D., 1982, ApJ, 253, 785
- Barbon et al. (1990) Barbon R., Benetti S., Rosino L., Cappellaro E., Turatto M., 1990, A&A, 237, 79
- Benetti et al. (2004) Benetti S. et al., 2004, MNRAS, 348, 261
- Bessell (1990) Bessell M. S., 1990, PASP, 102, 1181
- Boisseau et al. (1991) Boisseau J. R., Wheeler J. C., 1991, AJ, 101, 1281
- Bureau et al. (1996) Bureau M., Mould J. R., Staveley-Smith L., 1996, ApJ, 463, 60
- Cappellaro et al. (2001) Cappellaro E. et al., 2001, ApJ, 549, 215
- Cardelli, Clayton & Mathis (1989) Cardelli J. A., Clayton G. C., Mathis J. S., 1989, ApJ, 345, 245
- Contardo et al. (2000) Contardo G., Leibundgut B., Vacca W. D., 2000, A&A, 359, 876
- Christensen et al. (2003) Christensen L., Becker T., Jahnke K., Kelz A., Roth M. M., Sánchez S. F., Wisotzki L., 2003, A&A, 401, 479
- (12) Cousins A. W. J., 1971, R. Obs. Ann. No. 7
- (13) Cousins A. W. J., 1980, SAAO Circ. 1, No. 5, 234
- (14) Cousins A. W. J., 1984, SAAO Circ. 1, No. 8, 69
- De Vaucouleurs (1991) De Vaucouleurs G., 1991, Science, 254, 1667
- Eastman R. G.& Pinto P. A. (1993) Eastman R. G., Pinto P. A., 1993, ApJ, 412, 731
- Elias et al. (1985) J. H., Matthews K., Neugebauer G., Persson S. E., 1985, ApJ, 296, 379
- Falco et al. (1999) Falco E. E. et al., 1999, PASP, 111, 438
- Freedman et al. (2001) Freedman W. L. et al., 2001, ApJ, 553, 47
- (20) Hamuy M., Walker A. R., Suntzeff N. B., Gigoux P., Heathcote S. R., Phillips M. M., 1992, PASP, 104, 533
- (21) Hamuy M., Suntzeff N. B., Heathcote S. R., Walker A. R., Gigoux P., Phillips M. M., 1994, PASP, 106, 566
- Hopp et al. (2002) Hopp U., Fernández M., 2002, Internal report 17/01/2002
- King (1985) King D. L., 1985, RGO/La Palma technical note N∘ 31.
- Krisciunas et al. (2003) Krisciunas K. et al., 2003, AJ, 125, 166
- Krisciunas et al. (2004) Krisciunas K. et al., 2004, AJ, 127, 1664
- Landolt (1992) Landolt A. U., 1992, AJ, 104, 340
- Leibundgut (1988) Leibundgut B., 1988, Ph.D. thesis, Univ. Basel
- Li, Swift & Ganeshalingam (2002) Li W. D., Swift B., Ganeshalingam M., 2002 IAUC, 7959, 1
- Mazzali (2000) Mazzali P., 2000, A&A, 363, 705
- Nobili et al. (2003) Nobili S., Goobar A., Knop R., Nugent P., 2003, A&A, 404, 901
- Nomoto, Thielemann & Yokoi (1984) Nomoto K., Thielemann F.-K., Yokoi K., 1984, ApJ, 1984, 286, 644
- Patat et al. (1996) Patat F., Benetti S., Cappellaro E., Danziger I. J., della Valle M., Mazzali P. A., Turatto M., 1996, MNRAS, 278, 111
- Perlmutter et al. (1997a) Perlmutter S. et al., 1997a, in Thermonuclear Supernova, ed. P. Ruiz-Lapuente, R. Canal, & J. Isern (Dordrecht:Kluwer), p. 749
- Perlmutter et al. (1997b) Perlmutter S. et al, 1997b, ApJ, 483, 565
- Phillips (1993) Phillips M. M., 1993, ApJ, 413, 105
- Phillips et al. (1999) Phillips M. M., Lira P., Suntzeff N. B., Schommer R. A., Hamuy M., Maza J., 1999, AJ, 118, 1766
- Reinecke M., Hillebrandt W. & Niemeyer J. C (2002a) Reinecke M., Hillebrandt W., Niemeyer J. C, 2002a, A&A, 386, 936
- Reinecke et al. (2002b) Reinecke M., Hillebrandt W., Niemeyer J. C, 2002b, A&A, 391, 1167
- Riess et al. 1999a, Salvo et al. (2001) Riess A. G. et al., 1999a, AJ, 117, 707
- Riess et al. (1999b) Riess A. G. et al., 1999b, AJ, 118, 2688
- Salvo et al. (2001) Salvo M. E., Cappellaro E., Mazzali P. A., Benetti S., Danziger I. J., Patat F., Turatto M., 2001, MNRAS, 321, 254
- Schlegel, Finkbeiner & Davis (1998) Schlegel D. J., Finkbeiner D. P., Davis M., 1998, ApJ, 500, 525
- Smartt et al. (2002) Smartt S. J., Patat F., Meikle P., Araujo S., 2002, IAUC, 7961, 2
- Sorokina & Blinnikov (2003) Sorokina E., Blinnikov S., 2003, in the proceedings to the ESO/MPA/MPE Workshop (an ESO Astrophysics Symposium) From Twilight to Highlight: The Physics of Supernovae, eds. B. Leibundgut and W. Hillebrandt (Springer-Verlag), p. 268.
- Sorokina & Blinnikov (2002) Sorokina E., Blinnikov S., 2002 in the proceedings of the 11th Workshop on Nuclear Astrophysics, Ringberg Castle, Tegernsee, Germany, eds. W. Hillebrandt and Ewald Mueller MPA/P13, Garching b. Mn̈chen, Germany: Max-Planck-Institut fuer Astrophysik, p. 57
- Schmidt (1994) Schmidt B. P., Kirshner R. P., Leibundgut B., Wells L. A., Porter A. C., Ruiz-Lapuente P., Challis P., Filippenko A. V., 1994, ApJ, 434, 19
- Stritzinger et al. (2002) Stritzinger M. et al., 2002, AJ, 124, 2100.
- Suntzeff (1996) Suntzeff L. J., 1996, in Supernovae and Supernova Remnants, IAU Colloquium 145, ed. R. McCray, Cambrige University Press.
- Turatto et al. (2003) Turatto M., Benetti S., Cappellaro E., 2003, in the proceedings to the ESO/MPA/MPE Workshop (an ESO Astrophysics Symposium) From Twilight to Highlight: The Physics of Supernovae, eds. B. Leibundgut and W. Hillebrandt (Springer-Verlag), p. 200
- Turatto et al. (1990) Turatto M., Cappellaro E., Barbon R., della Valle M., Ortolani S., Rosino L., 1990, AJ, 100, 771
- Vacca & Leibundgut (1996) Vacca W. D., Leibundgut, B., 1996, ApJ, 471, L37
- Wang et al. (2003) Wang L., Goldhaber G., Aldering G., Perlmutter S., 2003, ApJ, 590, 944
- Walker (1987) Walker G., 1987, Astronomical Observations, Cambrige Uni. Press, p. 47ff.