The unusual morphology of the intragroup medium in NGC 5171
Abstract
We present the results of a 24 ks XMM-Newton observation of the NGC 5171 group of galaxies. NGC 5171 is unusual in that it is an X-ray bright group ( 1042 ), with irregular contours which are not centred on a bright galaxy (e.g. Mulchaey et al., 2003). The global spectrum is adequately described by a single temperature APEC model with = 0.960.04 keV, and = 0.130.02 , in good agreement with previous ROSAT data. We find the X-ray contours are centred on a bright ridge of emission stretching from the BGG to a nearby galaxy. Spectral mapping reveals this ridge to be both cool ( 1.1 keV) and metallic ( 0.4 ) in comparison to its surrounding, suggesting it is the result of a tidal interaction between the two galaxies. Optical data reveals the member galaxies to have a high velocity dispersion ( = 49499 ), and a significantly non-Gaussian velocity distribution, suggesting the group is in the process of merging. A region of hot gas with = 1.580.36 keV is found to the West of the bright central ridge, and we interpret this as shock-heating resulting from the merging. A further region of emission to the South-East of the bright central ridge, with = 1.140.13 keV, is probably associated with a background group, four times more distant.
keywords:
X-rays: galaxies: clusters - galaxies: clusters: general - galaxies: general - galaxies: intergalactic medium - galaxies: formation - galaxies: evolution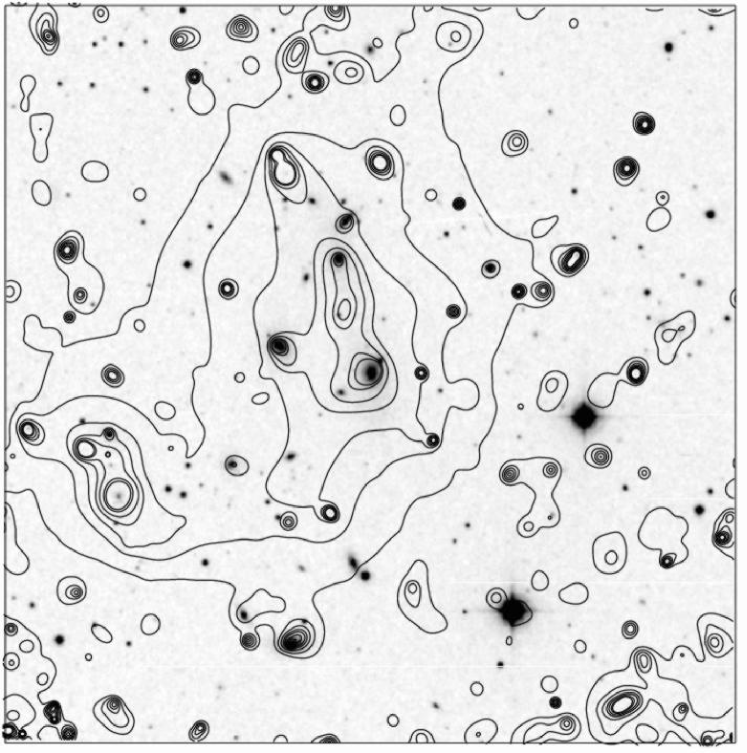
1 Introduction
The NGC 5171 group of galaxies has been included in several large-sample studies using the ROSAT PSPC (Helsdon & Ponman, 2000a, b; Mahdavi et al., 2000; Mulchaey et al., 2003; Osmond & Ponman, 2004). Such studies have evaluated the global properties of each group, and in many cases, used these properties to parameterise mean X-ray/optical scaling relations. However such trends invariably include significant, non-statistical scatter in comparison to the equivalent cluster trends (Helsdon & Ponman, 2000a). With the greater sensitivity and energy resolution of XMM-Newton we can corroborate the global values obtained using ROSAT, and map the spatial variations of these properties, in order to investigate the origin of their scatter from mean trends.
X-ray imaging has shown the morphology of NGC 5171 to be unusual in that despite being X-ray luminous ( 1042 ), it exhibits irregular X-ray contours which are not centred on a brightest group galaxy (Fig. 1). It is the only group in the GEMS sample of 60 to possess such properties. Optical data reveals the member galaxies to have an unusually high velocity dispersion for a poor group ( = 49499 , third highest in the GEMS sample), and as such NGC 5171 falls on the upper envelope of the - relation. It has a value of (the ratio of specific energy in galaxies to that in the intragroup gas) of 1.430.59, fourth highest in the GEMS sample, whilst most groups have less than or equal to unity.
In this work we employ XMM-Newton to map the spectral properties of NGC 5171. We then combine our X-ray results with a study of the dynamics of the optical galaxies, in order to better understand the evolutionary processes responsible for the unusual properties of this group.
Where applicable we have compared our results to those of the Group Evolution Multi-wavelength Study (GEMS, Osmond & Ponman, 2004), who included a 5 ks observation of NGC 5171, in their ROSAT-PSPC study of a sample of 60 optically selected groups. This comparison provides some indication of the reliability of the ROSAT data, as well as demonstrating the additional power of XMM-Newton.
This paper is organised as follows: In 2 we describe the X-ray data reduction, and in 3 we present the results of the subsequent spatial analysis. 4 includes an explanation of the optical data relating the member galaxies. In 5 we describe the global spectral analysis, and in 6 we describe the spatial variation of these spectral properties. In 7 we discuss the implications of the X-ray and optical results, and in 8 we summarise our conclusions.
Throughout this work we use = 70 , and a distance to NGC 5171 of 107 Mpc, based on an average group redshift, corrected for infall into Virgo and the Great Attractor.
2 Data Reduction
NGC 5171 was observed for 24 ks with XMM-Newton on 30 December 2001 (Obs. Id. 0377-0041180801). Data from the European Photon Imaging Camera (EPIC) were prepared for examination using the EPCHAIN and EMCHAIN pipeline processing routines within the Science Analysis Software (SAS). Periods of significant X-ray flaring were identified using a binned light-curve. Times for which the X-ray flux exceeded the mean by 3 were removed, leaving 19 ks of usable data.
PN events with pattern 4 and MOS events with pattern 12 were removed from the data, and further bad events were excluded using the XMMEA event attribute filters. Point sources were identified from data within 5 energy bands (0.2-0.5, 0.5-2.0, 2.0-4.5, 4.5-7.5, 7.5-12.0 keV) using both a sliding box algorithm (EBOXDETECT) and a maximum likelihood point spread function fitting (EMLDETECT). Results of the two methods were combined to give 107 detected point sources in the field of view. Five of these sources formed a chain between two central galaxies, and due to their arrangement, were unlikely to represent genuine point sources. We conclude that a bright filament at the centre of the group (Section 3) has confused the point source searching, and we have therefore not excluded this region from our subsequent analysis of the diffuse X-ray emission. The remaining 101 sources, including all those coincident with galaxies, were excluded to the 80% radius for 5 keV photons ( = 25 arcsec).
Background properties were estimated from a superposition of 72 observations of a blank region of sky taken with the same instrument, mode and filter as the NGC 5171 observation (Read & Ponman, 2003). Background data were filtered in the same way as the principal observation, and residuals in the background emission, between the source and blank-sky datasets, were estimated from an annulus at the edge of the field of view (12 16 arcmin). Such residuals may arise from celestial variations in galactic X-ray emission, and soft proton emission (Lumb et al., 2002), or from secular evolution of the instrumental background (De Luca & Molendi, 2004). Spectra were extracted for all three instruments and fitted over the range 0.3 - 12 keV, excluding 7.0 - 9.0 keV. The model used included a diffuse gas component (APEC, Smith et al., 2001) to account for variations in the galactic X-ray emission, and a soft power-law component to account for variations in soft proton emission. The PN instrument required an additional hard power-law component (index 0) to account for secular evolution of the background. The abundance and redshift of the galactic component were frozen at 1 and 0 respectively, and the power-law components were allowed to vary between instruments. A radial profile of surface brightness confirmed that the annulus used to evaluate the background residuals contained essentially no group emission (Section 3). Furthermore, a second APEC component added to the background residual model, achieved no significant improvement in the quality of the fit. For an account of a similar background subtraction approach see Zhang et al. (2004). Results of the fit to the residual background are presented in Table 2.
An energy range of 0.4 - 2.0 keV was adopted, as the range in which group X-ray emission dominated over the background, and data outside this range were discarded when generating images and spectra.
3 Spatial Analysis
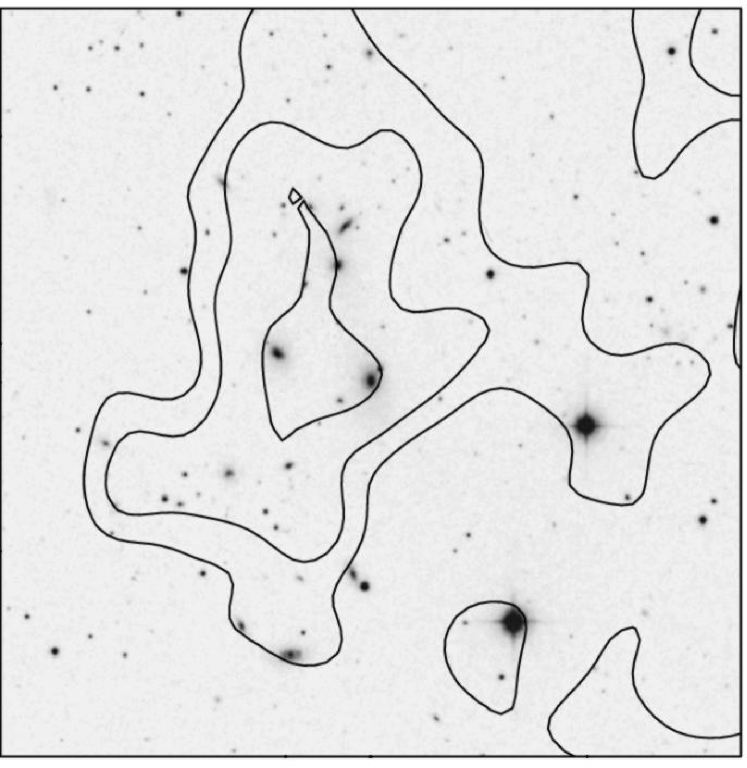
Images were created by generating cleaned events lists for each instrument, from within a square region centred on the brightest group galaxy (BGG) NGC 5171, and binning into 1 arcsec pixels. Particle flux was estimated from a dataset taken with the filter wheel set to closed (Marty et al., 2002), and normalised using the counts in the range 10 - 12 keV, in which the emission was assumed to be entirely particle in origin. This particle estimate was then subtracted from the image before the exposure correction was applied, as the particle flux is not focused by the X-ray mirrors. An X-ray background map was estimated from a blank-sky image processed in the same way, and then subtracted from the source image. Images from the 3 instruments were combined to form a mosaic, and smoothed using an adaptive smoothing algorithm. The smoothing scale was varied so as to maintain a 3 significance in surface brightness, using a background level estimated from an annulus surrounding the kernel. For comparison purposes, the mosaic was also smoothed using a wavelet smoothing algorithm (Vikhlinin et al., 1998), where the smoothing scale was varied between 2 and 7 arcsec, and regions of 4 significance from each scale co-added. Fig. 2 shows the results of the two methods, with logarithmically spaced surface-brightness contours overlaid on the adaptively smoothed image. We can see from these figures that the two techniques produce similar results. However it appears that the wavelet smoothing has failed to recover the extended, low surface-brightness emission seen in the adaptively smoothed image. A radial profile extracted from an unsmoothed image reveals genuine emission out to the edge of the image, suggesting that the wavelet smoothing algorithm is less effective at reduced intensity.
Fig. 1 shows logarithmically spaced surface-brightness contours taken from the adaptively smoothed mosaic, overlaid on a B-band DSS image, and for comparison the equivalent image generated from a 5 ks ROSAT PSPC pointing. These images show that the group-scale X-ray emission previously detected with ROSAT has been resolved into two distinct sub-regions. The larger of the two sub-regions exhibits X-ray contours which are highly elongated in approximately the North-South direction, suggesting that the corresponding gas is not relaxed. Furthermore, a bright filament of emission (hereafter the bright central filament) can be seen at the centre of this sub-region, orientated in a similar North-South direction. This filament appears to join two galaxies: the brightest group galaxy NGC 5171, at the Southern end, and NGC 5176 at the Northern end. In contrast the South-East emission region has only a faint central galaxy. Finally this comparison reveals that the Western extension apparent in the ROSAT image is not present in the XMM-Newton image, suggesting it may be the result of point-source confusion in the inferior ROSAT data.
A radial surface-brightness profile centred on NGC 5171 was extracted from an unsmoothed mosaic of images from all three instruments, with point sources removed to (25 arcsec), and the South-East emission region removed to 2 arcmin. The radius at which the surface brightness dropped to approximately the background level was used to define an aperture radius of = 9 arcmin. This is consistent with the adaptively smoothed mosaic, which demonstrates emission dropping to approximately the background level (black) at the edge of the image. The radial profile also confirms that the region used to evaluate background residuals is largely free of emission from NGC 5171.
All images presented here have a width equivalent to twice the aperture radius.
4 Optical Membership
We derive our optical galaxy membership using the procedure of Osmond & Ponman (2004). An overdensity radius is defined from the group X-ray temperature using a relation derived from simulations (Evrard et al., 1996):
| (1) |
Galaxies are then extracted from the NASA-IPAC Extragalactic Database (NED) within a radius of the BGG position, and 3 standard deviations () of the group velocity (), and the process iterated using the recalculated values of and . NGC 5171 is a typical system in comparison to the remainder of the GEMS sample of 60 groups, in all parameters except where it has the third highest value (494 ), and spiral fraction, where it has the joint lowest (0). Table 1 summarises the optical properties of NGC 5171.
| Parameter | Value | |
| 12 | ||
| () | 6924132 | |
| () | 49499 | |
| (Mpc) | 107 | |
| (Mpc) | 0.58 | |
| () | 15 | |
| (log ) | 11.28 | |
| 0.00 | ||
| (log ) | 10.76 | |
| 2.65 | ||
| (keV) | 1.070.09 | |
| () | 1.471.25 | |
| (log ) | 42.380.06 | |
| (log ) | 42.450.06 | |
| 1.430.59 | ||
| (log ) | 31.110.06 | |
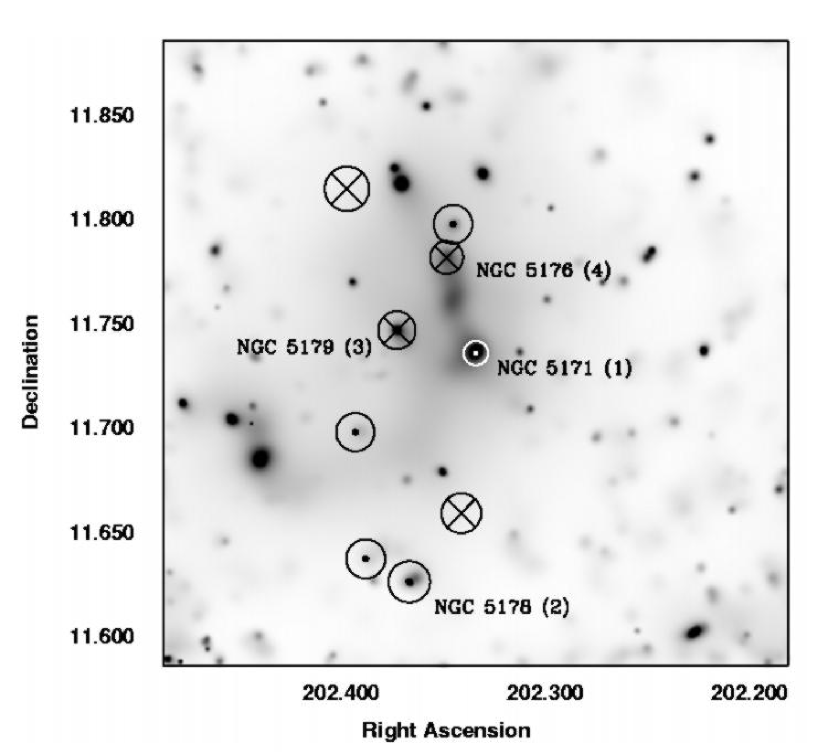
To better illustrate the spatial and velocity distribution of the member galaxies, we have overlaid a galaxy velocity map on an image of the X-ray emission (Fig. 3). Each symbol represents a group galaxy, where the size of the symbol is proportional the line-of-sight galaxy velocity in the rest-frame of the group . The symbol represents galaxies moving away, and galaxies moving towards the observer. The three group member galaxies not included in Fig. 3 are located at a similar RA to the BGG (NGC 5171), but lie 3 arcmin outside the X-ray field of view, to the North.
One significant feature of this figure is that none of the member galaxies of NGC 5171 coincide with the South-East emission region. A search of NED within 2 arcmin of the position of this region reveals 3 galaxies with undetermined redshifts. However if these galaxies lie at approximately the same redshift as our group then one would expect their redshifts to have been determined and included in NED. Furthermore, the average apparent luminosity of these galaxies is 16 times fainter than the average for the member galaxies of NGC 5171, suggesting they may be 4 times more distant. It is therefore likely that these galaxies, and their corresponding X-ray emission, are associated with a more distant group. As such we have excluded this region from the global spectral analysis.
5 Spectral Analysis
For each instrument, a source spectrum was created from cleaned events within a radius r of the group position, and a background spectrum created from the same region of the blank-sky dataset. Energy channels were grouped into bins containing 30 counts, and a Redistribution Matrix File (RMF) and Ancillary Response File (ARF) generated using the relevant SAS commands. The three spectra were then simultaneously fitted with a single-component diffuse gas emission model (APEC), and a multiplicative absorption component (WABS), using XSPEC (Arnaud, 1996). All fits were performed with the neutral hydrogen column density fixed at a value taken from radio observations (Dickey & Lockman, 1990), and with the redshift fixed at the group value derived by Osmond & Ponman (2004). Residual background, following the subtraction of the blank-sky background, was accounted for by including the residual model described in Section 2 in the spectral fitting. As variations in this residual background across the detector are not well understood, the normalisations of the residual background model components were allowed to vary.
An inspection of the residuals from the fitted model revealed two additional emission lines in the MOS spectra, which were not accounted for by the model. MOS data were refitted with a variable abundance model (VAPEC), with abundances taken from Anders & Grevesse (1989), but none of the additional lines accounted for these features. However adding two Gaussian components to the existing model, and fitting simultaneously to only the MOS spectra, identified the energies of these lines as 1.50 and 1.76 keV respectively, and improved the fit significantly ( = 0.51). These energies correspond to the Al-K and Si-K instrumental fluorescence lines, originating from the camera shielding and CCD substrate respectively (Lumb et al., 2002). To exclude these lines we have ignored all MOS data above 1.4 keV in the spectral fitting. Data were refitted with a variable abundance model (VAPEC), a two temperature model (APEC+APEC), and a differential emission model (CEMEKL), but no significant improvement was obtained.
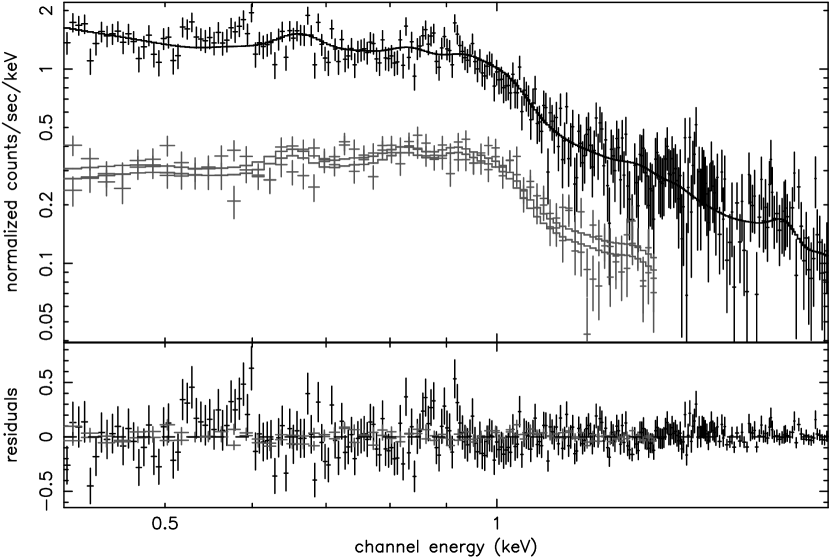
Results of the spectral fitting are presented in Table 2 and the spectral data, together with the best-fitting APEC model, and the residuals from this model, are plotted in Fig. 4.
| Comp. | Ins. | Parameter | Value | |
| IGM | (keV) | 0.960.04 | ||
| () | 0.130.02 | |||
| (log ) | 42.540.08 | |||
| (1022 ) | 0.0193 | |||
| 0.0230 | ||||
| 1.590.46 | ||||
| (log ) | 31.260.08 | |||
| 1.21 | ||||
| Galactic | (keV) | 0.310.02 | ||
| Soft | PN | Index | 2.930.29 | |
| M1 | Index | 1.810.89 | ||
| M2 | Index | 1.520.40 | ||
| Secular | PN | Index | 0.080.07 | |
6 Spectral Mapping
In order to better understand the spatial distribution of the spectral properties of NGC 5171, we have derived spectral maps using two complementary methods:
6.1 Adaptively Binned Spectral Maps
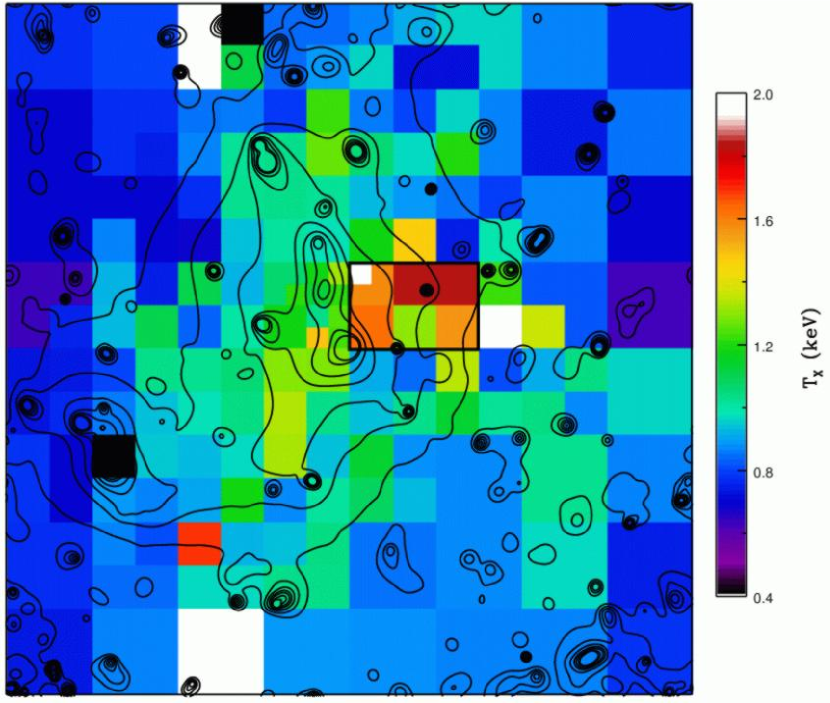
Data were extracted from within a square region centred on the BGG, with a width of 2 (18 arcmin), and background data were extracted from the same region of the blank-sky dataset. The square was subdivided into 22n bins, where n = 1 initially, and any bins containing a total of 500 counts over all three instruments after background subtraction, were used to generate spectra. RMF and ARF files were generated corresponding to 6 annular regions of equal width, centred on the bore-sight. The spectra for each bin were then associated with the most appropriate RMF and ARF, and simultaneously fitted with an absorbed APEC model using XSPEC. Residual background following the subtraction of the blank-sky background, was accounted for as described in Section 5. The process was repeated with n increasing by 1 on each iteration, until it produced a layer with no bins containing 500 counts. Any bins containing 500 counts adopted the properties of the corresponding larger region from the previous layer.
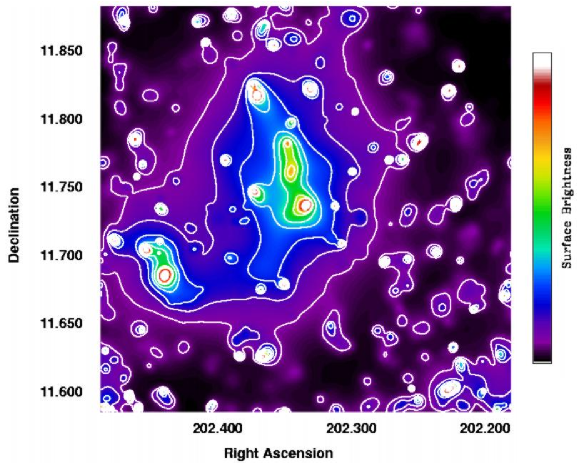
Fig. 5 shows the temperature map derived using this method. We can see that the IGM of NGC 5171 exhibits temperatures of 0.8 keV in the outer regions with a rise to 1.3 keV in the centre. The bright central filament has a temperature which is generally consistent with its surroundings. There is also evidence for a region of hot gas to the West of the bright central filament (hereafter the Western hot region), with a temperature of 1.7 keV, but with no corresponding increase in surface-brightness. A metallicity map derived in the same way shows the majority of the group gas to have a metallicity of 0.1 - 0.4 . The metal abundance in the Western hot region is 0.4 .
6.2 Surface Brightness Region Mapping
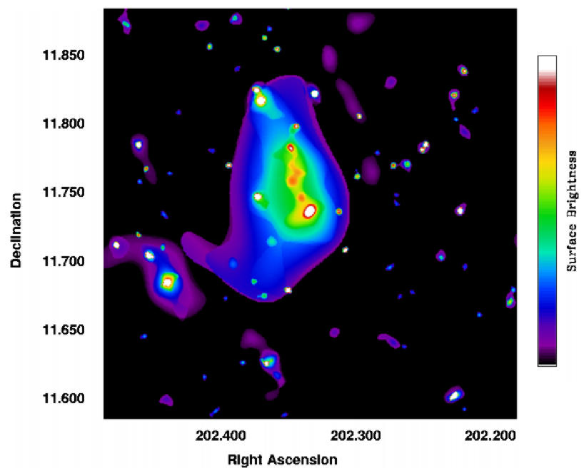
Regions of similar surface brightness were defined from an adaptively smoothed mosaic image, using thresholds equal to the contour levels shown in Fig. 2. Regions containing 200 counts above the background, across all three instruments, were fitted with an absorbed APEC model. Fig. 6 shows the temperature and metallicity maps derived using this method, and Table 2 details the corresponding parameter values and errors. In agreement with Fig. 5, the temperature map shows a general rise in temperature from 0.8 keV in the outskirts (region 1) to 1.3 keV in the centre (region 4). The Western hot region seen in Fig. 6 exhibits no corresponding increase in surface brightness, and as such does not feature in this temperature map. However we do see a drop in temperature to 1.1 keV in the bright central filament, which is not apparent in Fig. 5 due to the size and position of the bins. Region 1 shows a further dip in temperature to 1.0 keV, corresponding to emission from the BGG. The metallicity map shows a reasonably flat distribution at 0.10 across most of the group, with a rise to 0.20 in the bright central filament. Such a gradient in metal abundance suggests enrichment of the IGM by supernovae in the central galaxies (Buote et al., 2003).
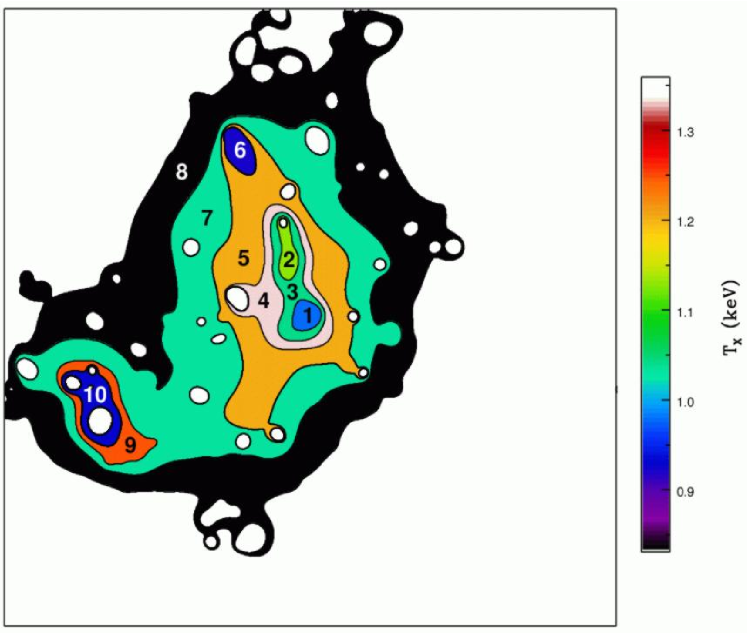
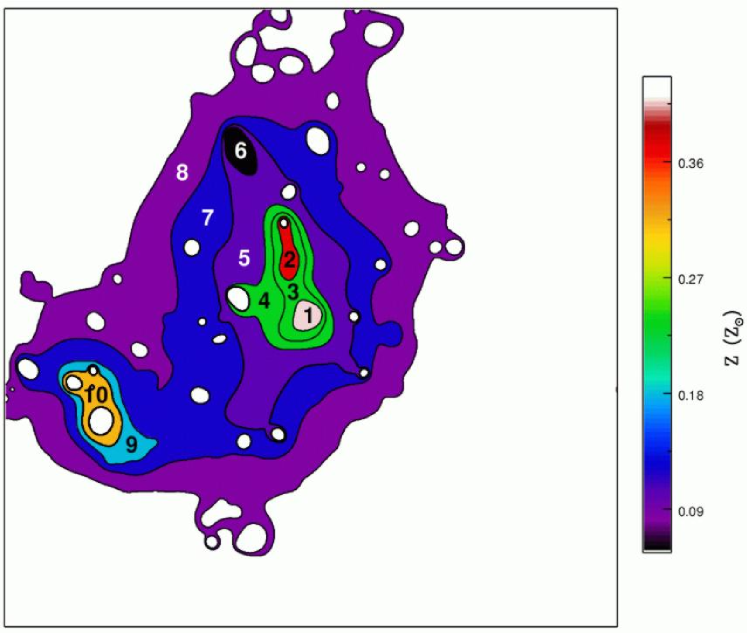
| Region | |||
|---|---|---|---|
| (keV) | () | ||
| 1 | 0.980.14 | 0.412.44 | 1.37 |
| 2 | 1.130.18 | 0.371.10 | 2.65 |
| 3 | 1.040.16 | 0.230.20 | 0.79 |
| 4 | 1.330.15 | 0.230.27 | 0.87 |
| 5 | 1.200.14 | 0.100.07 | 0.98 |
| 6 | 0.920.24 | 0.060.16 | 0.73 |
| 7 | 1.030.12 | 0.120.08 | 1.15 |
| 8 | 0.830.10 | 0.080.06 | 0.87 |
| 9 | 1.250.41 | 0.180.69 | 1.04 |
| 10 | 0.920.15 | 0.322.48 | 0.77 |
7 Discussion
7.1 ROSAT comparison
Table 1 details the X-ray properties of NGC 5171 derived using the ROSAT PSPC. The ROSAT values of = 42.380.06 , and = 1.070.09 keV, are consistent with the values derived here ( = 1.6, = 1.1). Furthermore, the metallicity previously unconstrained by ROSAT is now well defined.
This comparison provides some evidence that ROSAT PSPC can be used to evaluate reliable global properties of groups, despite lacking the energy resolution to determine metallicity. Furthermore, our comparison corresponds to a group in the process of merging, and one might expect better agreement for more relaxed systems. Helsdon et al. (2004) compare ROSAT and Chandra results for two low velocity dispersion groups and find that, even in these low luminosity cases, the diffuse X-ray emission identified by ROSAT is not grossly misleading. However point source contamination and inaccurate spectral characterisation lead to an overestimation of by 30 - 40%, although source contamination should be less of a problem for more luminous systems (e.g. 1041 ). We can therefore have some confidence in the scaling relations derived using ROSAT data. However, the superior sensitivity of XMM-Newton, and in this case longer exposure time, reveals additional features in the morphology, and allows us to map the spatial variation of spectral properties.
7.2 Scaling relations
NGC 5171 exhibits an unusually high velocity dispersion ( = 49494 ) in comparison to typical groups in the sample from which it was taken. However the presence of a hot, intragroup medium detectable out to 300 kpc confirms that it is a gravitationally bound group rather than a chance alignment of galaxies. The high value of = 1.59 indicates that there is significantly more specific energy in the galaxies than in the gas, in contrast to most groups (Helsdon & Ponman, 2000a; Osmond & Ponman, 2004).
Fig. 7 shows the scaling relations derived by Osmond & Ponman (2004), with ROSAT-derived values for NGC 5171 shown as large open diamonds, and the values derived in this work as filled diamonds. The - plot shows the high of NGC 5171 in comparison to most of the remainder of the GEMS sample ( = 1 is indicated by the solid line). The - and - relations reveal that NGC 5171 also has a rather high X-ray luminosity in comparison to both its temperature and optical luminosity. The final plot shows the - relation in which NGC 5171 appears consistent with the line of best-fit for groups. These results suggest that some effect is serving to either increase and or decrease both and in the NGC 5171 group.
7.3 Galaxy dynamics
Fig. 8 shows a velocity histogram for the member galaxies of NGC 5171, where the bins are of width 300 , and are positioned such that one bin is centred on the average value of velocity for the group ( = 6924 ). This plot demonstrates weak evidence for a bimodal distribution in galaxy velocities, which may be responsible for the high velocity dispersion seen in NGC 5171. It should however be noted that the significance of this bimodality is sensitive to the position of the histogram bins, and moving them by 100 can remove this feature altogether. However the distribution remains non-Gaussian in appearance independent of the binning phase. To measure the departure of the observed velocity histogram from a Gaussian distribution (mean = , sigma = ), we apply the Kolmogorov-Smirnov test, which does not require the data to be binned, and is appropriate for a small number of data points. We find a probability of agreement between the two distributions of 0.1%, suggesting that NGC 5171 exhibits genuine velocity substructure.
The high values of and derived for NGC 5171, together with the non-Gaussian nature of its velocity histogram, suggests the presence of two sub-populations of galaxies in the process of merging. From Fig 3 we can see that the galaxies which constitute these two sub-populations are not clearly spatially separated, indicating that either they are merging in a direction close to the line of sight, or are currently passing through one another.


7.4 Spectral features
It is likely that the spectral features seen in Figs 5 and 6 are a direct result of the interaction of these two sub-populations of galaxies. The two features of interest are the bright central filament, and the Western hot region, both of which are located near the BGG (NGC 5171), and the two brightest galaxies from the second population (NGC 5179 and NGC 5176, see Fig. 3).
The enhanced abundance and reduced temperature of the bright central filament (Fig. 6) suggests that it originates from the supernova-enriched interstellar medium (ISM) of a bright galaxy. If we assume that the two populations of galaxies, dominated by NGC 5171 and NGC 5179 respectively ( = 221 ), are in the process of merging, then it is probable that the bright central filament is the result of a tidal interaction between NGC 5171 and NGC 5176.
The lack of any increase in surface-brightness in the Western hot region suggests no corresponding increase in density, and therefore an excess in entropy. The enhanced temperature and entropy of the this region could then result from shock-heating of the IGM, by the interaction between the two merging subgroups. The temperature of a region of shocked gas can be calculated from the velocity difference between the two interacting systems using the standard shock jump condition:
| (2) |
where is the pre-shock temperature, is the ratio of specific heats (here 5/3), and is the Mach number of the shock. We evaluate the spectral properties of the hot region by extracting data from within the box shown in Fig. 5, for all three instruments, and fitting in the usual way. This gives a temperature of 1.580.36 keV, and a metallicity of 0.160.22 . Assuming the pre-shock temperature is equal to the global value = 0.96 keV, implies a shock velocity of = 641132 . From Fig. 8 we see that this shock velocity is consistent with the velocity separation between the two most populated bins ( = 600 ). It should also be noted that the value of = 600 is the velocity difference along the line of sight, and is therefore a lower limit on the 3D velocity difference.
Hydrodynamical simulations of merging clusters of galaxies have shown that shock-heating can occur at the interface of the two subclusters, and then propagate out in a direction perpendicular to the axis of collision (Takizawa, 1999). In the case of a collision between two galaxies of unequal mass, the shocked region forms a cone, angled towards the more massive galaxy. Our observed hot region is therefore consistent with an interaction in the direction of the bright central filament, where NGC 5171 is the more massive galaxy, and NGC 5176 belongs to a less massive infalling group. However there is only weak evidence for a corresponding hot region to the South-East of this filament (Fig. 5).
7.5 South-East emission region
Given the undetermined redshifts of the galaxies coincident with the South-East emission region (Section 4), it is likely that the X-ray emission seen here originates from a background group or cluster of galaxies. We evaluate the spectral properties of this region by extracting data from within a radius of 2 arcmin of the background object, and for the purposes of spectral fitting, assuming a redshift 4 times greater than the redshift of NGC 5171, based on the lower galaxy luminosities discussed in Section 4. We find a temperature of 1.140.13 keV, and a metal abundance of 0.160.14 . At the distance of NGC 5171, the X-ray luminosity corresponding to this model is 41.370.32 . Adopting the - relation for groups from Osmond & Ponman (2004), and using our fitted value of temperature, gives a predicted X-ray luminosity of 42.54 . Comparing these two values suggests that if the South-East emission originates from a galaxy group, its distance should be a factor of 3.8 larger than that of NGC 5171, in excellent agreement with the factor of 4 derived from the galaxy luminosities (Section 4). We therefore conclude that the background object is probably a group of galaxies at a distance of 430 Mpc (z 0.092).
8 Conclusions
Previous studies of NGC 5171 using the ROSAT PSPC have found it to be both X-ray luminous ( 1042 ), and of an unusual morphology. X-ray contours appear highly irregular and are not centred on a BGG (Fig. 1). However improved XMM-Newton data reveal that the X-ray emission is comprised of two distinct subregions corresponding to NGC 5171 and a background group, and that the main component is centred on a bright central ridge extending from the BGG, to a nearby galaxy. Spectral mapping reveals this filament to be both cool and metallic, suggesting that it originates from the interstellar medium of the central galaxies. We therefore suggest that this filament is the result of a tidal interaction between NGC 5171 and NGC 5176.
Our spectral analysis of NGC 5171 indicates that the integrated X-ray emission is reasonably well described by a single temperature APEC model, with = 0.96 keV, typical of groups (Osmond & Ponman, 2004). However the calculated values of , and therefore , are unusually high, and a histogram of the galaxy velocities exhibits a significantly non-Gaussian distribution, as well as a weak bimodality. This suggests that NGC 5171 may be comprised of two or more sub-populations of galaxies in the process of merging.
Adaptively binned spectral maps reveal a hot, metallic region to the West of the bright central filament. The temperature of this region is consistent with shock-heating by galaxies moving with a velocity similar to the velocity separation of the two sub-populations of galaxies.
We also compare our data with the ROSAT derived values of Osmond & Ponman (2004), finding agreement within 1.1 in , and 1.6 in . This comparison helps to validate the use of ROSAT data in deriving global group properties, and hence scaling relations.

9 Acknowledgements
This research has made use of the NASA- Extragalactic Database, and optical images from the STScI Digitised Sky Survey. The XMM-Newton project is supported by the Bundesministerium für Bildung und Forschung/Deutsches Zentrum für Luft- und Raumfahrt (BMFT/DLR), the Max-Planck Society and the Heidenhain-Stiftung, and also by PPARC, CEA, CNES, and ASI. The authors also acknowledge the support of a studentship (JPFO) and a senior fellowship (TJP) from the Particle Physics and Astronomy Research Council, and the Verbundforschung grant 50 OR 0207 of the DLR (AF).
References
- Anders & Grevesse (1989) Anders E., Grevesse N., 1989, Geochim. Cosmochim. Acta, 53, 197
- Arnaud (1996) Arnaud K. A., 1996, in ASP Conf. Ser. 101: Astronomical Data Analysis Software and Systems V Xspec: The first ten years. p. 17
- Buote et al. (2003) Buote D. A., Lewis A. D., Brighenti F., Mathews W. G., 2003, ApJ, 595, 151
- De Luca & Molendi (2004) De Luca A., Molendi S., 2004, A&A, 419, 837
- Dickey & Lockman (1990) Dickey J. M., Lockman F. J., 1990, ARA&A, 28, 215
- Evrard et al. (1996) Evrard A. E., Metzler C. A., Navarro J. F., 1996, ApJ, 469, 494
- Helsdon & Ponman (2000a) Helsdon S. F., Ponman T. J., 2000a, MNRAS, 315, 356
- Helsdon & Ponman (2000b) Helsdon S. F., Ponman T. J., 2000b, MNRAS, 319, 933
- Helsdon et al. (2004) Helsdon S. F., Ponman T. J., Mulchaey J. S., 2004, submitted to ApJ
- Lumb et al. (2002) Lumb D. H., Warwick R. S., Page M., De Luca A., 2002, A&A, 389, 93
- Mahdavi et al. (2000) Mahdavi A., Böhringer H., Geller M. J., Ramella M., 2000, ApJ, 534, 114
- Marty et al. (2002) Marty P. B., Kneib J. P., Sadat R., Ebeling H., Smail I., Markevitch M., 2002, proc. SPIE, 4851, 208
- Mulchaey et al. (2003) Mulchaey J. S., Davis D. S., Mushotzky R. F., Burstein D., 2003, ApJS, 145, 39
- Osmond & Ponman (2004) Osmond J. P. F., Ponman T. J., 2004, MNRAS, 350, 1511
- Read & Ponman (2003) Read A. M., Ponman T. J., 2003, A&A, 409, 395
- Smith et al. (2001) Smith R. K., Brickhouse N. S., Liedahl D. A., Raymond J. C., 2001, ApJ, 556, L91
- Takizawa (1999) Takizawa M., 1999, ApJ, 520, 514
- Vikhlinin et al. (1998) Vikhlinin A., McNamara B., Forman W., Jones C., Quintana H., Hornstrup A., 1998, ApJ, 502, 558
- Zhang et al. (2004) Zhang Y.-Y., Finoguenov A., Boehringer H., Ikebe Y., Matsushita K., Schuecker P., 2004, A&A, 413, 49