High-mass star formation within the bright-rimmed cloud SFO 79
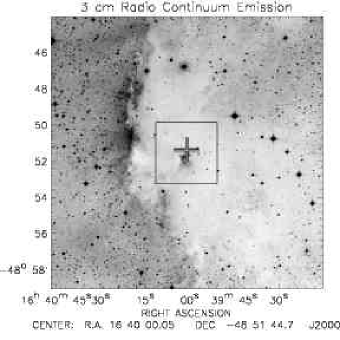
We report Radio Recombination Line (RRL) and continuum observations toward the IRAS point source 16362–4845, embedded within the Bright-Rimmed Cloud (BRC) SFO 79, a small molecular cloud lying at the edge of the HII region RCW 108. High resolution observations of the H92α hydrogen recombination line and of the continuum emission (3.6 and 6 cm) confirm the presence of a resolved Ultra Compact (UC) HII region embedded within the molecular cloud. The integrated radio fluxes suggest the source of the ionisation to be an O9 Zero Age Main Sequence (ZAMS) star. Millimetre observations of 12CO, 13CO and C18O (J=1–0) molecular lines reveal the presence of a molecular condensation offset 30″ to the north of the IRAS position on the boundary of the UC HII region. Analysis of 2MASS data has led to the identification of a small IR cluster of Young Stellar Objects (YSOs) that are positionally coincident with the UC HII region, lying to the south east of the peak of the radio emission. Moreover, the UC HII region appears to be extended in the direction of the IR cluster, which suggests that the radio emission and the IR cluster are in some way related to each other. MSX 8.3 m and 21.3 m images have been used to trace the large scale structure of the BRC, revealing the presence of a Photo Dominated Region (PDR) and three embedded thermal sources within the molecular cloud. The PDR has a plane parallel morphology which correlates extremely well with the morphology of the ionised gas traced by the optical emission. The three thermal sources (labelled A, B, C) all lie at a similar projected distance from the interface between the HII region and the molecular gas of the cloud. Thermal sources A and C are positionally coincident with the IRAS point sources 16362–4845 and 16362–4841 respectively, both of which have IRAS colours consistent with the presence of UC HII regions. Given that UC HII regions are relatively short lived (105 yrs) it is reasonable to suggest that these two UC HII regions are of a similar age. The alignment of the three thermal sources along a line parallel to the bright rim suggests that they could have been triggered by the propagation of a plane parallel shock through the cloud.
Key Words.:
Stars: formation – ISM: individual object: RCW 108, SFO 79 – ISM: clouds – ISM: HII regions – ISM: reflection nebulae – ISM: infrared1 Introduction
Bright-Rimmed Clouds (BRCs) are small molecular clouds associated with evolved HII regions, and have long been considered possible sites for star formation triggered by the expansion of the surrounding HII region. The far-UV photons emitted from an OB star, located toward the centre of the HII regions, ionise the surface of the molecular cloud and drive photoionisation-induced shocks into the molecular material. These shocks compress the molecular gas, forming dense cores and possibly triggering their collapse as well as triggering the collapse of any pre-existing cores that may already be present within the molecular cloud in a process known as Radiative-Driven Implosion (RDI; Bertoldi 1989; Bertoldi & McKee 1990; Lefloch & Lazareff 1994, 1995).
Sugitani, Fukui, & Ogura (1991) identified 44 BRCs in the northern hemisphere which are associated with IRAS point sources, suggesting the presence of embedded protostars. This was followed by a search of the southern sky for BRCs, using the ESO(R) Southern Hemisphere Atlas by Sugitani & Ogura (1994). This search identified a further 45 BRCs associated with IRAS point sources. In total 89 BRCs have been identified as potential sites for triggered star formation to occur, collectively known as the SFO catalogue.
A recent radio continuum survey of 45 southern BRCs between 3.6 and 20 cm (Thompson, Urquhart & White, 2004a; hereafter Paper I) detected five radio sources that, because of their positional coincidence with embedded IRAS point sources, were considered as possible compact HII regions. Compact HII regions are signposts pointing to the earliest stages of massive star formation in which newly formed stars are still embedded within their natal molecular clouds and are ionising the surrounding gas. The BRC SFO 79 was identified in Paper I as a possible high-mass star forming site and is the subject of this study. The high infrared and radio luminosity detected toward the embedded IRAS point source 16362–4845 within this BRC suggest the presence of an embedded stellar cluster surrounded by a compact HII region driven by a late O type star. This embedded source has also been associated with an infrared cluster found in 2MASS survey data (Paper I; Dutra et al. 2003). In order to confirm the nature of star formation within this BRC we have made high resolution observations of the possible compact HII region detected in our earlier survey.
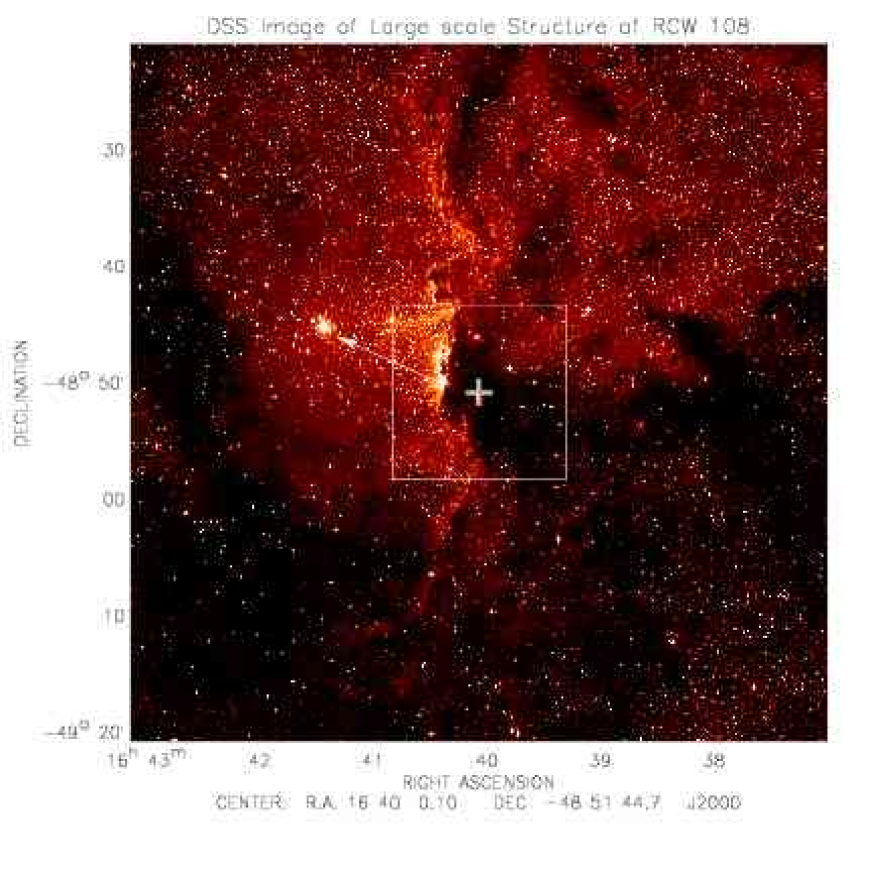
SFO 79 is a small molecular cloud on the edge of RCW 108, a bright HII region located at a heliocentric distance of 1.35 kpc (Georgelin et al. 1996). This cloud has been associated with the IRAS point source 16362–4845, which has the IRAS colours consistent with the presence of an embedded protostar or an UC HII region. RCW 108 is excited by two O stars, HD 150135 and HD 150136, located at a projected distance of 4.2 pc east from the edge of the bright rim of the cloud (Whiteoak 1963; Herbst & Havlen 1977; see Figure 1). The bright rim of the cloud marks the interface between the HII region and the dense dark material. These two stars are part of NGC 6193 forming the core of the Ara OB1 association (Whiteoak, 1963). The coincidence of the embedded IRAS point source with the several reflection nebulae that form the R association Ara R1 (Herbst 1974, 1975) has brought the question of active star formation in these molecular clouds to the fore. Since the detection of the H109α RRL (Wilson, 1970) toward the centre of the cloud SFO 79 has been the focus of some interest. Wilson (1970) reported the detection of a small unresolved region with an emission measure of 4.1 cm-6 pc, an electron temperature of 97003200 K and a VLSR=24.92.2 km s-1. Other radio wavelength observations include: H166α RRL (Cersosimo, 1982), H109α and H110α RRL (Caswell & Haynes, 1987), continuum emission at 5 GHz (Goss & Shaver, 1970) and 4.8 GHz (Wright et al., 1994), as well as OH and H2CO absorption at 1.667 and 4.830 GHz respectively (Caswell & Haynes, 1987; Whiteoak & Gardner, 1974), 12CO(J=1–0) emission at 115 GHz (Whiteoak et al. 1982; Arnal et al. 2003), and 13CO(J=1–0) 110 GHz (Yamaguchi et al. 1999). Walsh et al. (1997) attempted, unsuccessfully, to detect CH3OH maser emission toward the IRAS point source IRAS 16362-4845. All of the RRLs and absorption features observed toward SFO 79 have very similar VLSR, located at -242 km s-1. Straw et al. (1987) conducted a detailed study at both near and far-infrared wavelengths of the IRAS position and the surrounding area, reporting the possible detection of a protostellar object and a T-Tauri star.
All these single dish observations have large beam sizes (2.8′), or are comprised of a single-pointing only, and therefore only allow the global properties of the molecular cloud to be calculated and say little about the small-scale structure, or the nature of star formation, within the BRC. We have carried out high resolution radio continuum (at 3.6 and 6 cm) and CO observations toward SFO 79, including the hydrogen RRL H92α, to study the small-scale structure of the molecular gas and to determine the source of the radio emission reported in Paper I. These observations have been used to calculate the local parameters of the molecular gas and the compact radio source. The distribution of emission in both sets of observations have been used to evaluate the interaction between the compact HII region and the surrounding molecular gas. We combine our radio data with J, H and Ks photometric data obtained from 2 Micron All Sky Survey (2MASS; Cutri et al. 2003) and Midcourse Space eXperiment (MSX; Price et al. 2001) broadband mid-IR images to study the nature of star formation within SFO 79 and the large scale star formation in the surrounding region.
The structure of this paper is as follows: in Section 2 we will present the details of the radio and molecular line observations, and a description of the archival data included in this study. Results and analysis are presented in Section 3. In Section 4 we present a discussion of the results and explore the possibility that the present star formation could have been induced. A summary of our conclusions is presented in Section 5.
2 Observations and data reduction
2.1 Radio observations
Observations of SFO 79 were made using the Australia Telescope Compact Array (ATCA)111The Australia Telescope Compact Array is funded by the Commonwealth of Australia for operation as a National Facility managed by CSIRO., located at the Paul Wild Observatory, Narrabri, New South Wales, Australia. The first observation was carried out on the 22nd of September 2003 using the 750B array configuration. The second and third observations were carried out on the 27th and 28th of September 2003 using the EW357 array configuration. The ATCA consists of 622 m antennas, 5 of which lie on a 3 km east-west railway track with the sixth antenna located 3 km further west. This allows the antenna to be positioned in several configurations with a maximum baseline of 6 km. Each antenna is fitted with a dual feedhorn system allowing simultaneous measurements of two wavelengths, either 20/13 cm or 6/3.6 cm. The 6/3.6 cm receiver system was used for our observations.
The observations were made at two different frequency bands centred at 4800 and 8309 MHz (H92α) using bandwidths of 128 and 8 MHz respectively. The 8 MHz bandwidth was divided into 512 channels, giving a frequency resolution of 15.6 kHz and a velocity resolution of 0.56 km s-1. SFO 79 was observed on each occasion for a total of one hour, split into 610 minute snapshots spread out over a wide range of hour angles to optimise uv coverage. To correct for fluctuations in the phase and amplitude of these data caused by atmospheric and instrumental effects, the phase calibrator 1613–586 was observed for two minutes on either side of each snapshot observation of SFO 79. The primary flux calibrator 1934–638 was observed once during each set of observations to allow the absolute calibration of the flux density. To calibrate the bandpass the bright point source 1921–293 was also observed once during each set of observations. These observational parameters are summarised in Table 1.
| Parameter | H92αa | 6 cm |
|---|---|---|
| Rest frequency (MHz) | 8309 | 4800 |
| Total bandwidth (MHz) | 8 | 128 |
| Primary beam (arcmin) | 5 | 10 |
| Number of channels | 512 | 32 |
| Channel resolution (kHz) | 15.6 | — |
| Velocity resolution (km s-1) | 0.56 | — |
| Date of observations | 2003 Sept 22nd/27th&28th | |
| Total integration time (hr) | 3 | |
| Phase Centre | RA(J2000) | Dec.(J2000) |
| 16 | -48∘ 51′ 45″ | |
| Array configurations | 750B/EW357 | |
| Flux density calibrator | 1934–638 | |
| bandpass calibrator | 1921–293 | |
| Phase calibrator | 1613–586 | |
a We also produced the 3.6 cm continuum image from line-free channels.
The calibration and reduction of the data were performed using the MIRIAD reduction package (Sault, Teuben & Wright, 1995) following standard ATCA procedures. The task UVLIN was used to subtract the continuum emission in the 8309.383 MHz bandpass from the RRL H92α spectra in the uv plane. An image of the 3.6 cm radio continuum emission was produced from the line free channels of the H92α data. The data were CLEANed using a robust weighting of 0.5 to obtain the same sensitivity as natural weighting, but with a much improved beam-shape and lower sidelobe contamination. The data obtained from baselines including the 6th antenna were found to distort the processed images (due to the gap in uv coverage at intermediate baselines) and so were excluded from the final images. The CLEANed data were restored to produce images of the RRL H92α, 3.6 and 6 cm emission, which have synthesised beamwidths of 12″ and 20″ for the H92α, 3.6 and 6 cm emission respectively.
2.2 CO observations
SFO 79 was observed during June 2003 in the J=1–0 rotation lines of 12CO, 13CO and C18O using the Mopra 22-m millimetre-wave telescope operated by the Australia Telescope National Facility (ATNF). The half-power beam-width at these frequencies is 30′′ with a main beam efficiency of 0.4 (E. F. Ladd, private communication). Position-switching was used to subtract sky emission. Antenna pointing checks every two hours showed that the average pointing accuracy was better than 10′′ rms. The observed antenna temperatures TA were corrected for atmospheric absorption, ohmic losses and rearward spillover, by taking measurements of an ambient load (assumed to be 290 K) placed in front of the receiver following the method of Kutner & Ulich (1981). The standard calibrators Orion KL and M17SW were observed once each day to allow for absolute flux calibration. Hereafter all antenna temperatures quoted are on the corrected antenna temperature scale, T.
The receiver is a cryogenically cooled low-noise SIS mixer with a single sideband receiver noise temperature of 110 K. The system temperature was found to vary by approximately 10% due to weather conditions and telescope elevation. For all of our observations we used a bandwidth of 64 MHz with a 1024-channel digital autocorrelator, giving a frequency resolution of 62.5 kHz and a velocity resolution of 0.16–0.17 km s-1 over the 109–115 GHz frequency range. The correlator setup allows two different frequency bands to be observed. For the 12CO and 13CO observations the second band was tuned to 86.2 GHz (SiO maser frequency) to allow for pointing corrections to be performed during the observations. However, both bands were tuned to 109.782 GHz for the C18O observations in order to optimise the Signal to Noise Ratio (SNR). A summary of the CO observations parameters are presented in Table 2.
| Isotope | Frequency | Resolution | Grid | Integration |
|---|---|---|---|---|
| (J=1–0) | (GHz) | (km s-1) | size | time (s) |
| 12CO | 115.271 | 0.162 | 99 | 30 |
| 13CO | 110.201 | 0.170 | 99 | 30 |
| C18O | 109.782 | 0.170 | 33 | 120 |
The 12CO and 13CO observations consisted of a 99 grid map of the cloud centred on the IRAS point source identified by Sugitani & Ogura (1994), using a grid spacing of 15″. We observed each point for 30 seconds interleaved with observations of an off-source reference position for 90 seconds after each set of 9 pointings (off-source reference position (J2000) =16, (J2000)=-48∘ 18). The C18O maps were comprised of a smaller grid of 33 pointings with the same spacing, and were also centred on the IRAS position, with a total integration time of 2 minutes for each grid position.
The ATNF data reduction package SPC was used to process the individual spectra. Sky-subtracted spectra were obtained by subtracting the emission from the reference position from the on-source data. A correction was made to account for the change in the shape of the dish as a function of elevation. Gaussian profiles were fitted to the individual spectra to extract the peak antenna temperature, FWHM line widths and the velocity of the emission with respect to the local standard of rest (VLSR), listed in Table 6. Maps of the integrated emission of each of the three lines were produced to allow us to trace the distribution of the molecular gas. The integrated emission of the 13CO line is presented in Figure 5, contoured over the DSS image.
2.3 Archival data
To complement our radio and molecular line data we obtained archival data from both the 2MASS all-sky release atlas (Cutri et al. 2003) and the MSX Galactic Plane Survey222The 2MASS and MSX data were downloaded from the NASA/IPAC Infrared Processing and Analysis Center and NASA/IPAC Infrared Space Archive both held at http://www.ipac.caltech.edu. (Price et al. 2001). The 2MASS photometric data were used to search the cloud for possible protostars and T-Tauri stars, also known as class I and class II objects respectively. The MSX data were used to study the large scale structure of RCW 108, specifically to identify deeply embedded thermal objects and emission from Polycyclic Aromatic Hydrocarbons (PAHs). The hard radiation field within HII regions destroys PAHs, which can only survive within the shielded environment of molecular clouds on the edges of HII regions. UV photons penetrate the surface of molecular clouds, leading to the formation of a Photo Dominated Region (PDR) in the surface layers of the clouds. PAHs within the PDR are excited by the UV photons re-emitting their energy at mid-infrared wavelengths, particularly between 6-10 m. For this reason the MSX 8 m images are excellent tracers of PDRs, which themselves indicate the presence of a nearby high-mass star (Rathborne et al. 2002).
We obtained photometric measurements from the 2MASS Point Source Catalogue (Cutri et al. 2003) in the J(1.24 m), H(1.65 m) and Ks(2.16 m) bands. The 2MASS data have a photometric accuracy of between 1–2% and a positional accuracy of better than 1″. The limiting magnitudes are 15.8, 15.1 and 14.3 for J, H and Ks respectively. In order to concentrate on star formation within the BRC we obtained photometric data on a total of 34 sources from the 2MASS catalogue which lay within a 90″ radius of the position of the IRAS point source. We excluded any 2MASS sources that had a SNR less than 10 in any of the three wavebands.
We obtained one degree field images of RCW 108 in all four of the MSX wavebands, band A (8.3 m), band C (12.1 m), band D (14.7 m) and band E (21.3 m). Each MSX band covers a discrete bandpass of between 2–6 m wide, here we have only quoted the centre wavelength. Together these four images provide information about the large scale interaction between the OB stars and the surrounding molecular gas. The most useful wavebands for this study were band A and band E. The bandpass of band A includes several discrete PAH emission features (e.g. 7.7 and 8.6 m) as well as a thermal continuum component from hot dust at 400 K. The emission in band E arises due to warm dust at 100 K and is very useful for tracing warm dust and identifying deeply embedded objects such as YSOs and compact HII regions. Where the band A and band E emission are spatially well correlated we have assumed that the emission is dominated by warm dust, thus suggesting an embedded source. Conversely, where the emission in these bands is not spatially correlated, we have assumed that it is dominated by PAH emission.
3 Results and analysis
3.1 H92α radio recombination line
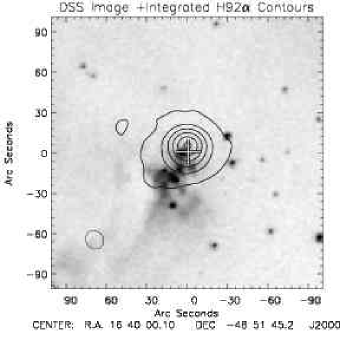
We detected bright emission from the H92α RRL toward IRAS 16362–4845, confirming the presence of an embedded compact HII region within SFO 79. The RRL was Hanning smoothed to improve the SNR, reducing the velocity resolution to 1 km s-1. A single Gaussian profile was fitted to a source averaged spectrum of the data using a least-squares fitting routine to obtain the line parameters (see Figure 2). The central velocity of the line (VLSR), the FWHM line width (V), and the peak line emission were found to be -24 km s-1, 24.6 km s-1 and 104 mJy respectively. The VLSR of the line compares very well with the value of -23 km s-1 determined from Hα observations by Georgelin et al. (1996) and we will therefore adopt their distance estimate to the HII region RCW 108 of 1.35 kpc as the distance to SFO 79. The line width compares well with values typically observed toward UC HII regions which range between 25-30 km s-1 (Wood & Churchwell, 1989).
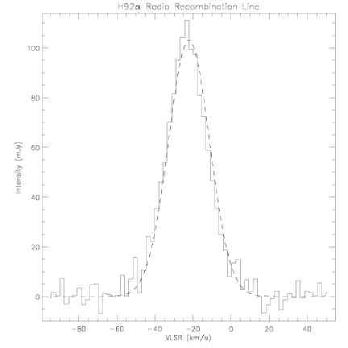
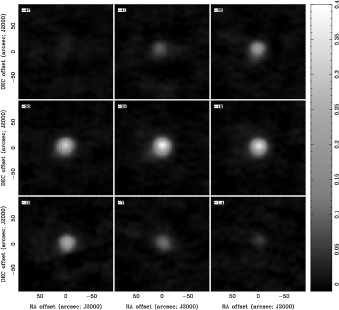
The line-to-continuum ratio, , was calculated by dividing a source summed spectrum by the source integrated 3.6 cm continuum emission and was found to be 0.109. The RRL can be used to derive the electron temperature () of the radio emission from the and linewidth. We used Eq. 1 from Garay et al. (1994) to calculate , making the following assumptions: the average ionised helium to hydrogen abundance (Y) for our galaxy is 0.0740.003 (Shaver et al. 1983); the emission from both the RRL and the continuum is optically thin; and the emission is thermal in origin and emitted under Local Thermodynamical Equilibrium (LTE) conditions. We determined to be 7700 K. A summary of the derived parameters and their associated errors can be found in Table 3. (The quoted errors are 1 errors associated with the Gaussian fit only). Figure 3 shows an integrated velocity image (-50 to 0 km s-1) and velocity channel maps of the RRL emission. The channel maps show the HII region to have spherical morphology at all velocities with the high velocity components lying in a direction parallel to our line of sight.
| H92α Parameter | Measurement |
|---|---|
| Tl/Tc | 0.1090.004 |
| VLSR (km s-1) | -240.3 |
| V (km s-1) | 24.62.4 |
| Te (K) | 77001200 |
3.2 Radio continuum emission
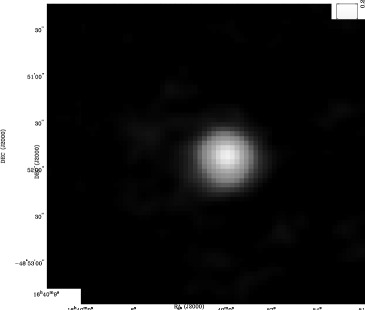
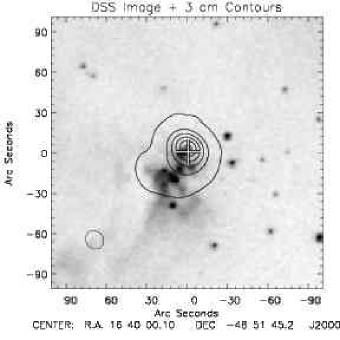
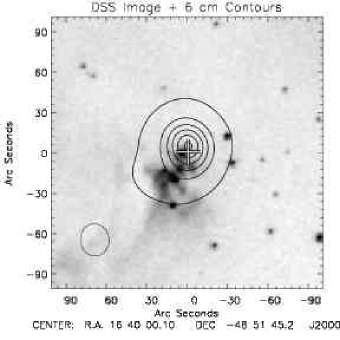
The radio continuum and integrated H92α emission images are presented in Figure 4 and the measurements of the peak and source integrated emission are summarised in Table 4. The image analysis has been performed using the visualisation package kvis, which is part of the Karma software suite (Gooch, 1996). The radio emission is very similar in each of the three close-up images in Fig. 4, although one difference can be seen between the continuum emission and the RRL emission; the emission distribution shown by the 3.6 and 6 cm continuum contours would suggest the compact HII region to have a core-halo morphology, however, this is not observed in the RRL emission, which would suggest a spherical morphology. This disagreement is most likely a sensitivity effect, as both of the continuum images are considerably more sensitive than the RRL observations and thus more likely to identify fainter emission from the halo (i.e. continuum map rms 4-9 mJy compared to RRL image rms 77 mJy). We consider that the higher sensitivity continuum images provide the most accurate means of determining the morphology of the HII region, and therefore, we have adopted a core-halo morphology for the HII region for the remainder of this paper.
The positions of the emission peaks at all three wavelengths agree with each other to within a few arc-seconds, and correlate well with the position of the IRAS point source, 16362–4845, which is offset to the south by 7″. Taking into account the IRAS beam size (0.5′–2′ between 12 and 100 m), we consider these to be in excellent agreement. Comparing the integrated flux with the flux measured by the Parkes-MIT-NRAO (PMN; source id. PMNJ1640-4851) survey (Wright et al., 1994) of 8.5 Jy (4.850 GHz) and that reported by Caswell & Haynes (1987) of 7.6 Jy, and because the spectrum is flat between 4.8 and 8.3 GHz ( -0.03, see next paragraph), we find that our observations miss 12–25% of the total flux density. This is because the Compact Array is an interferometer and as such works as a high spatial frequency filter, filtering out emission from large scale structure. However, we note that this difference in the flux density does not affect our measurement of the line to continuum ratio because both the line and continuum measurements are equally affected.
The spectral index () is defined by the relationship , where is the flux density of the source and is the frequency at which the emission is measured. For a thermal plasma we would expect to range from -0.1 to 2 depending on the optical thickness of the source, where -0.1 would infer that the plasma was optically thin (Mehringer, 1994). Using the 3.6 and 6 cm source integrated fluxes we have calculated the spectral index of the radio emission to be -0.027, therefore the emission is both thermal and optically thin.
| Image | FWHM restoring | Position | Peak | Integrated | Deconvolved Source | Physical | Image |
|---|---|---|---|---|---|---|---|
| beam | angle | Emission | Emission | FWHM | size | rms noise | |
| (arcsec) | (degrees) | (Jy/beam) | (Jy) | (arcsec) | (pc) | (mJy/beam) | |
| H92α | 12.714.3 | 30.6 | 0.18 | 0.24 | 11.2 | 0.07 | 77 |
| 3.6 cm | 12.714.3 | 38.7 | 2.6 | 6.8 | 16.6 | 0.11 | 4.5 |
| 6 cm | 20.524.0 | 6.4 | 4.3 | 6.9 | 17.5 | 12 | 8.8 |
To estimate the size of the emission regions at different frequencies we fit Gaussian profiles to the azimuthal flux averages of the three images, taking into account the beam sizes by assuming a simple convolution of our Gaussian source with a Gaussian beam, i.e., = where is the FWHM. The results of this analysis are also tabulated in Table 4. These angular diameters were used to calculate the physical diameter of the compact HII region, by assuming that the distance to RCW 108 and the compact HII region are the same (1.35 kpc). By taking the average of the observations at each wavelength we obtain an effective physical diameter Deff of 0.1 pc, which is typical for an UC HII region (Wood & Churchwell, 1989). UC HII regions are associated with bright radio and infrared sources that appear to be deeply embedded within their natal molecular clouds and therefore are thought to represent an early stage in the evolution of massive stars.
The equations of Mezger & Henderson (1967) and Panagia & Walmsley (1978) have been used to calculate the radio parameters of the UC HII region, namely the Emission Measure (EM), the electron density (ne) and the total mass of the ionised gas (MHII). The total ionising photon flux (Ni) has been calculated using the modified version of Eqn 7 from Carpenter et al. (1990) presented in Paper I;
| (1) |
where Ni is the total number of photons emitted per second, Sν is the integrated radio flux in mJy, D is the distance to the source in kpc and is the frequency of the observation in GHz. The results of these calculations for the two wavelengths were averaged and are presented in Table 5. By assuming that the expansion speed of the UC HII region is the same as the sound speed in an ionised gas (i.e., 11.4 km s-1 assuming an initial density of 102 cm-3 for the surrounding material (Thompson et al. 2004b), we estimate a lower limit of 104 yrs for the age of the UC HII region. The following assumptions have been made when calculating the UC HII region’s physical parameters: the HII region is ionisationally bounded, spherical, has a uniform density and UV absorption by dust grains is negligible. The combined effect of the core-halo morphology and absorption of UV by dust on our assumptions would lead to an underestimation of the value of Ni determined from the integrated flux. Therefore our calculated value for Ni should be considered as a lower limit.
| Parameter | Measurement |
|---|---|
| MHII (M⊙) | 0.22 |
| ne (cm-3) | 13800 |
| Log(Ni) | 48.06 |
| EM (cm-6 pc) | 9.9106 |
Assuming that the radio emission observed toward the embedded IRAS point source is produced by a single ZAMS star, we estimate the spectral type of the central star by comparing the derived value of the total number of ionising photons to values tabulated by Panagia (1973). From this comparison we estimate the spectral type of the star exciting the UC HII region to be O8.5–O9. This is slightly earlier than the spectral type suggested in Paper I due to the improved uv coverage and higher resolution of our observations. We find that our radio data inferred the presence of an O8.5–O9 star, which is three spectral classes later than the O6–O6.5 ZAMS star calculated by integrating the flux under an assumed blackbody curve fitted to the far-IR data (Straw et al. 1987). The difference between these two values may indicate the presence of a cluster of low to intermediate mass stars that are contributing to the infrared luminosity, or that a significant fraction of the UV radiation is being absorbed by the dust. Wood & Churchwell (1989) showed that for a realistic initial mass function the spectral type of the most massive member of a stellar cluster would be approximately 1.5–2 spectral classes lower than that calculated assuming the far-IR flux was from a single star. Therefore the difference between the spectral types calculated from the far-IR and radio fluxes is consistent with emission expected from a stellar cluster.
3.3 Molecular line data
Arnal et al. (2003) surveyed the whole region in 12CO(J=1–0). Their survey covered an area of 2.75∘3.00∘ with an angular resolution of 8.7′ (FWHM) and mapped the distribution of molecular material. The material associated with Ara OB1 was found to span a velocity range between -28 to -20 km s-1. The most negative radial velocities was found toward the interface between the RCW108 HII region and the dense material to the west of the HII region (see Figure 1).
The 12CO emission revealed a large molecular condensation toward SFO 79. The condensation is located at (J2000)=, (J2000)=-48∘ 55′ 2.1″ which has a VLSR of 23.5 km s-1, an excitation temperature of 9.5 K. Arnal et al. (2003) calculated the size of the condensation to be 4.7 pc2.7 pc with a mass of 3900 M⊙ and a particle density of 4.4 cm-3. Arnal et al. (2003) concluded that the 5 GHz radio continuum emission detected by Goss & Shaver (1970) and the bright IRAS point source 16362-4845 were both observational manifestations of an on-going star formation process within the molecular condensation and that the positional coincidence of other IRAS point sources with other nearby 12CO condensations may suggest that star formation is widespread throughout the whole molecular complex. We have made CO maps of a 2′2′ region within the molecular condensation identified by Arnal et al. (2003) in order to examine the star formation indicated by the presence of the IRAS point source and the radio continuum emission presented in Section 3.2.
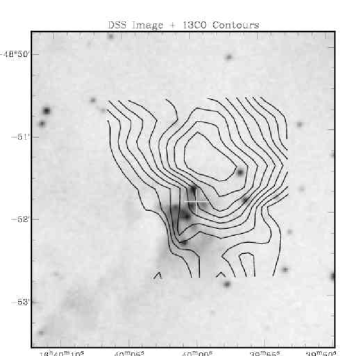
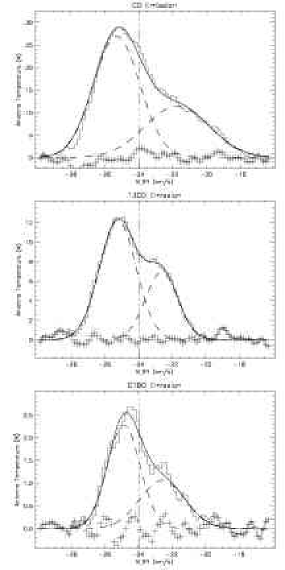
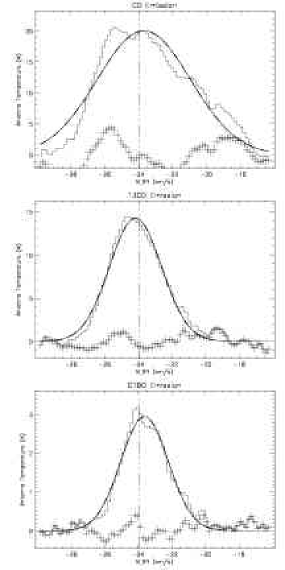
Figure 5 shows the integrated emission map of 13CO superimposed over a DSS image of SFO 79. The contoured image reveals the presence of a molecular condensation 30″ to the northwest of the IRAS position. We present spectra of the CO lines observed toward the molecular condensation and the IRAS point source in Figure 6. The vertical line in Fig. 6 represents the central line velocity of the H92α line observed toward the UC HII region. The spectra of all three isotopomers taken close to the position of the IRAS point source suggest the presence of two velocity components, at approximately -22 km s-1 and -25 km s-1 (see Figure 6). These velocity components lie on either side of the velocity of the UC HII region as measured from the H92 line (-24 km s-1). These CO spectra were found to be best fitted with a combination of two Gaussian profiles. The detection of two molecular components could be due to the expansion of the HII, the molecular gas on either side of the HII region being accelerated both toward and away from us along our line of sight. The spectra observed toward the molecular condensation are comprised of a single velocity component that has a peak velocity of 24 km s-1, correlating extremely well with the central velocity of the UC HII region. The peak antenna temperature (T), VLSR and the FWHM line width are presented in Table 6.
The 12CO and 13CO data display some evidence of moderate velocity non-Gaussian line wings (see Figure 6) indicative of molecular outflows over the 2′ field, however, outflow lobes were not observed in the channel maps or integrated intensity maps of either line. This is probably due to the insufficient resolution of the observations. Higher resolution molecular line observations are needed to obtain a clearer picture of the small scale structure of the molecular condensation and to detect the presence of a molecular outflow.
| Molecular | VLSR | FWHM | Peak T |
|---|---|---|---|
| Line | (kms-1) | (kms-1) | (K) |
| IRAS point source | |||
| 12CO | -25.3 | 1.3 | 25.2 |
| -22.1 | 2.1 | 12.1 | |
| 13CO | -25.2 | 1.1 | 12.3 |
| -22.6 | 1.0 | 6.9 | |
| C18O | -24.8 | 1.0 | 2.3 |
| -22.6 | 1.4 | 1.1 | |
| Molecular Condensation | |||
| 12CO | -23.7 | 2.8 | 20.1 |
| 13CO | -24.2 | 1.6 | 14.3 |
| C18O | -23.6 | 1.4 | 3.0 |
We have used the optically thin transition of C18O and the moderately optically thick (1) 13CO to determine the physical parameters of the molecular condensation. Unlike the 12CO transition, which is optically thick and therefore probes the conditions at the surface of unit optical depth, the C18O observations are optically thin, and are thus able to sample the molecular gas through the whole cloud. These lines are also free of self absorption and beam filling factors. The optical depth can be calculated numerically using the relationship between brightness temperature and optical depth,
| (2) |
where T13, T18 are the corrected antenna temperatures and , are the optical depths of the 13CO and C18O transition lines respectively. The optical depths are related to each other by their abundance ratio such that =X. We have assumed the abundance ratio between 13CO and C18O to be 10 (Tothill et al. 2002), that the molecular condensation is in LTE (and therefore the excitation temperature is the same for both transitions) and that the beam filling factors are similar.
Following the method described in Myers, Linke, & Benson (1983), we estimated the excitation temperature Tex 20 K and the column density N(C18O) 5.51015 cm-2. Assuming a fractional abundance of (C18O/H2)=1.710-7 (Goldsmith, Bergin, & Lis, 1996) we estimate the H2 column density to be N=3.31022 cm-2. The angular size of the molecular condensation was calculated from the FWHM of the azimuthally averaged 13CO integrated intensity map (see Figure 5) and was found to be 1′, which corresponds to a physical diameter of 0.4 pc at a distance of 1.35 kpc. Assuming the condensation to be spherical, and that emission from other sources along the line of sight can be neglected, we find the volume density to be n=2.7 cm-3. Multiplying this by the total volume of the condensation gives an upper limit for the mass. The following equation has been used to calculate the total mass of the condensation in units of M⊙,
| (3) |
where R is the radius of the condensation in parsecs, n is the molecular hydrogen volume density in cm-3, is the mean molecular weight (taken to be 2.3, assuming a 25% abundance of helium by mass), and mH is the atomic mass unit. The mass was calculated to be 51 M⊙, which is rather low for a high mass star forming region. However, this could be due to depletion of the CO molecules onto either dust grain ice mantles or via selective photo-dissociation. Comparing the core mass to those derived from sub-millimetre and CO observations of similar clouds Thompson et al. (2004b) found that, on average, masses obtained using CO data gave core masses roughly an order of magnitude lower than those produced from greybody fits to the IRAS and sub-millimetre data. We therefore would consider the derived mass of our condensation as a lower limit. The physical parameters derived for the molecular condensation are summarised in Table 7.
| Condensation’s Parameters | Measurement |
|---|---|
| 0.163 | |
| 1.3 | |
| Tex (K) | 20.5 |
| N(C18O) (cm-2) | 5.5 |
| N(H2) (cm-2) | 3.3 |
| Angular diameter (arcmin) | 1 |
| Physical diameter (pc) | 0.4 |
| n(H2) (cm-3) | 2.7 |
| Mass (M⊙) | 51 |
3.4 2MASS identification of YSO candidates
A total of 34 IR sources (SNR10) were identified from a search of the 2MASS Point Source Catalogue (Cutri et al. 2003) to be within a 90″ radius of the position of the IRAS point source. For each of these sources the J, H and Ks magnitudes obtained from the 2MASS Point Source Catalogue were used to calculate values for their J–H and H–Ks colours. The corresponding colour-colour diagram, following the method of Lada & Adams (1992), is presented in Figure 7. The photometric errors are indicated by the horizontal and vertical error bars. The thick solid lines represent the locus of both main-sequence and giant stars taken from Koornneef (1983). The thin solid line represents the Classical T-Tauri Star (CTTS) locus as determined by Meyer, Calvet, & Hillenbrand (1997).
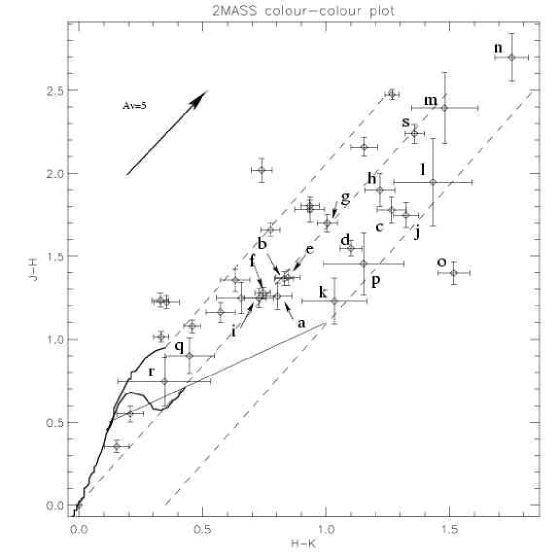
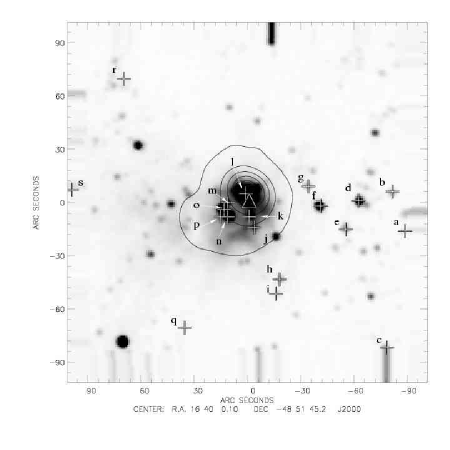
The dashed lines indicate the reddening tracks. The centre and left reddening tracks denote the boundary where main sequence and giant stars would be expected to lie taking account of extinction (Lada & Adams, 1992). The circumstellar disks surrounding CTTSs lead to the production of an excess of near-infrared emission, making T-Tauri stars appear more reddened than main sequence stars. Therefore sources found between the centre and right reddening tracks are candidate CTTSs (Meyer, Calvet, & Hillenbrand, 1997). The track farthest to the right indicates the truncation of the T-Tauri locus of Meyer, Calvet, & Hillenbrand (1997). We would expect sources to the right of this reddening track to be protostellar candidates, reddened still further by the protostellar envelopes surrounding the protostars. Inspection of Figure 7 reveals the presence of nineteen CTTS/protostar candidates (hereafter candidate YSOs). The positions of these sources have been plotted onto a 2MASS Ks band Quick look image of SFO 79 and are presented in the left panel of Figure 8 along with contours of the 3.6 cm radio continuum emission. The candidate CTTSs and protostar details are presented in Table 8.
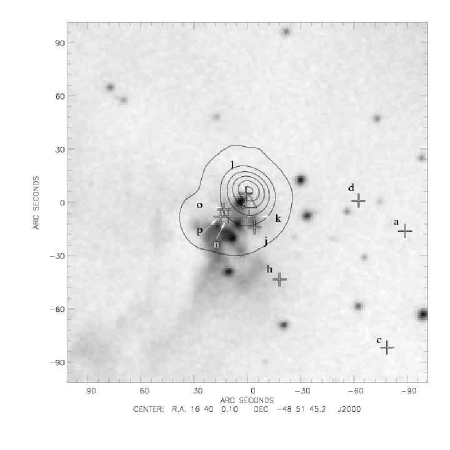
Figure 8 (left panel) reveals a fairly widespread distribution of candidate YSOs with the vast majority located to the west of the UC HII region. It is interesting to note the high concentration of candidate YSOs within the boundary of the UC HII region and that the HII region is extended toward them. Of the seventeen candidate YSOs identified, seven are located within the UC HII region indicated by the radio continuum emission contours. Taking our analysis a step further and excluding candidate YSOs where there is some ambiguity in their classification (sources that could potentially be reddened main sequence stars, i.e., b, e, f, g, i, m, q, r and s) we obtain ten sources that we can confidently consider to be genuine YSOs. These YSOs have been plotted onto the DSS image presented in the right panel of Figure 8. Of the ten remaining YSOs, six are located within the boundary of the UC HII region. Hereafter we will refer to these candidate YSOs as an IR cluster. The IR cluster contains the only class I protostar and all of the class I protostellar candidates in the region, these being o, and k, l, p respectively. Moreover, analysis of the extinction corrected reddening values reveals that the IR cluster contains the five source with the highest infrared excess, which would suggest that the IR cluster is relatively quite young, perhaps having a similar age to the that of the UC HII region.
| Source | 2MASS | Ra | Dec | Ks | J - H | H - Ks | Type |
|---|---|---|---|---|---|---|---|
| Id. | PSC ID | (J2000) | (J2000) | ||||
| a | 16395123-4852035 | 16:39:51 | -48:52:04 | 13.72 | 1.260.08 | 0.800.06 | class II |
| b | 16395182-4851415 | 16:39:52 | -48:51:41 | 12.17 | 1.370.04 | 0.830.04 | class II/RMS |
| c | 16395241-4853089 | 16:39:52 | -48:53:09 | 12.12 | 1.780.08 | 1.270.06 | class II |
| d | 16395370-4851461 | 16:39:54 | -48:51:46 | 10.30 | 1.550.05 | 1.100.05 | class II |
| e | 16395449-4852014 | 16:39:54 | -48:52:02 | 12.00 | 1.370.05 | 0.850.05 | class II/RMS |
| f | 16395598-4851482 | 16:39:56 | -48:51:48 | 9.72 | 1.280.04 | 0.750.03 | RMS/class II |
| g | 16395662-4851366 | 16:39:57 | -48:51:37 | 12.58 | 1.700.05 | 1.010.04 | RMS/class II |
| h | 16395828-4852287 | 16:39:58 | -48:52:29 | 12.62 | 1.900.10 | 1.220.06 | class II |
| i | 16395848-4852368 | 16:39:59 | -48:52:37 | 13.22 | 1.250.06 | 0.730.06 | RMS/class II |
| j | 16400012-4851404 | 16:40:00 | -48:51:40 | 7.74 | 1.750.08 | 1.320.05 | class II |
| k | 16395989-4851528 | 16:40:00 | -48:51:53 | 10.48 | 1.230.14 | 1.030.13 | class II/class I |
| l | 16395974-4851592 | 16:40:00 | -48:51:59 | 11.42 | 1.950.26 | 1.430.16 | class II/class Ia |
| m | 16400125-4851454 | 16:40:01 | -48:51:45 | 10.97 | 2.390.22 | 1.480.13 | class II/RMS |
| n | 16400155-4851484 | 16:40:01 | -48:51:49 | 9.37 | 2.700.15 | 1.750.07 | class II |
| o | 16400114-4851524 | 16:40:01 | -48:51:53 | 8.79 | 1.400.07 | 1.520.06 | class Ia |
| p | 16400163-4851532 | 16:40:02 | -48:51:53 | 11.60 | 1.460.19 | 1.150.16 | class II/class I |
| q | 16400381-4852547 | 16:40.04 | -48:49.08 | 14.37 | 0.900.11 | 0.450.10 | RMS/class II |
| r | 16400706-4850338 | 16:40:07 | -48:50:34 | 13.87 | 0.750.15 | 0.350.19 | RMS/class II |
| s | 16401019-4851356 | 16:40:10 | -48:51:36 | 11.76 | 2.240.06 | 1.360.04 | class II/RMS |
a Source l and o have been identified in Straw et al. (1987) as a candidate T-Tauri and a protostar respectively.
3.5 Mid-infrared data
Wide field MSX images were obtained to investigate the global star formation within the molecular cloud and the large scale structure of the whole region. The MSX band A image is dominated by PAH emission and can be used to infer the presence of a PDR. The morphology of the PDR seen toward the rim of SFO 79 is elongated along the length of the bright rim, and has a similar distribution to that seen in the DSS image, the sharp edges of both correlating extremely well, denoting the HII region/PDR boundary. The MSX band E image reveals the presence of three bright thermal sources embedded within the cloud, set back from the bright rim with respect to the ionising stars. One of these sources is coincident with the position of SFO 79, probably due to internal heating from an embedded main sequence star.
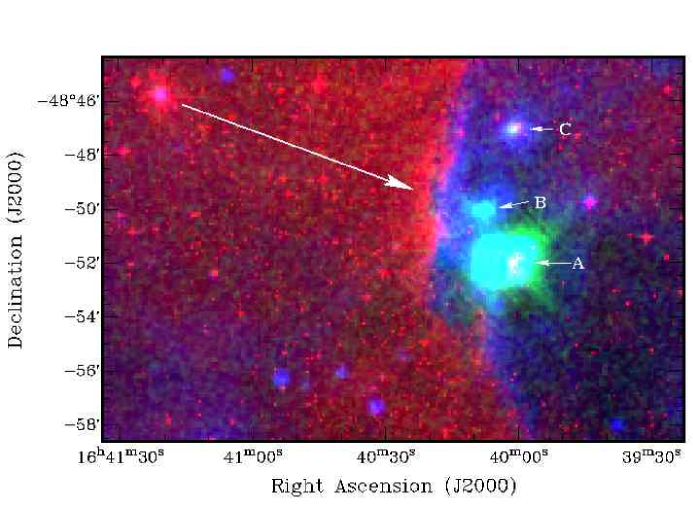
The MSX band A and E images were combined with the DSS image to produce a three colour image of the bright rim, the ionising stars and the surrounding region (see Figure 9). Combining these images together in this way allows us to study the distribution of the mid-IR and visible wavelength emission and the spatial correlation between features seen in each of the three individual images. We can also determine the relationship between the ionised gas, the PDR, and the embedded thermal sources on a global scale. The image is presented in Figure 9; band A traces emission from the PDRs in the region, band E traces thermal emission from warm dust, and the DSS emission traces the optically ionised gas; these three images are coloured blue, green and red respectively. The ionising stars can be clearly seen as the bright red emission in the upper left section of the image.
4 Discussion
In this Section we will draw together all the analyses presented in the previous Sections to investigate the star formation within SFO 79 as well as evaluating the global star formation in the surrounding region.
4.1 Structure and physical properties of SFO 79
4.1.1 The HII/molecular cloud interface
The interface between the HII region RCW 108 and the molecular cloud can be clearly seen in the DSS image (see upper left panel Figure 9) allowing us to trace the edge of RCW 108 in great detail. RCW 108 is ionised by two O stars located a projected distance of 4.2 pc from the edge of the bright rim. Analysis of the 2MASS data for the ionising stars would suggest they are situated in a region of low extinction (Av1), although the MSX band A emission which traces the PDR would suggest that the ionising stars are slightly in the background with respect to the cloud (see Section 4.2). No radio emission was detected toward the bright rim of the cloud, but the strong correlation between the DSS image and the MSX band A image supports the hypothesis that the surface of this cloud is being photoionised by the nearby O stars. Using the 6 cm image, an upper limit can be calculated for the impinging photon flux, which we compare to what we would expect from the ionising stars.
The effect of the photoionisation of the cloud’s surface by the OB stars is to produce a uniform density shell of ionised gas that surrounds the edge of the cloud known as an Ionised Boundary Layer (IBL). The effective thickness of this shell is R, where is a geometrical factor of 0.2 (Bertoldi, 1989) and R is the radius of the BRC in parsecs, estimated using the method described in Sugitani et al. (1991). Most of the ionising radiation is absorbed in the IBL with the ionising photon flux being effectively balanced by radiative recombination, shielding the underlying molecular material. It has been shown (Lefloch, Lazareff & Castets, 1997) that the free-free flux measured in an area of width (FWHM) can be expressed as a function of electron density, temperature and source size . In order to evaluate an upper limit to the incident ionising photon flux at the rim of the cloud we assume a 3 upper limit of 26.4 mJy at 6 cm. Rearranging Eqns 2 and 6 of Lefloch, Lazareff & Castets (1997), the following two equations for the total incident flux, (photons cm), and the electron density, ne (cm-3), are obtained:
| (4) |
| (5) |
where is the measured flux density in mJy and is the frequency of the observations in GHz. An average HII region electron temperature of Te104 K has been assumed. The upper limit on the impinging flux is 2.41010 photons cm-2 s-1. Comparing this to the combined theoretical flux expected at the interface from the O5 and O6.5 stars (2.9 photons cm-2 s-1; Paper I) we find agreement to within 20%. Therefore our observations were only sensitive enough to have detected radio emission from the bright rim if it and the ionising stars lie in the same plane in the sky, and if there was no significant attenuation of the photon flux due to absorption from dust or recombination along the cloud/stars line of sight. However, as already stated, the morphology of the PDR suggests that there is some displacement between the positions of the ionising stars and the cloud rim, with the stars lying in the background and the cloud in the foreground. Taking this into account it would seem that the non-detection of emission coincident with the rim is not significant and does not rule out the possibility of a IBL being present at the HII region/cloud interface. More sensitive radio observations are required to determine whether or not an IBL surrounds the bright rim, as suggested by the presence of the PDR.
The upper limit for the electron density was calculated to be 378 cm-3, considerably above the critical electron density (ncritical=25 cm-3, Lefloch, Lazareff & Castets 1997) necessary for an IBL to develop around the cloud rim. Using this value and again assuming a temperature of 104 K we have estimated an upper limit to the external pressure of the cloud, Pext, using Eqn 3 Paper I,
| (6) |
where kB is Boltzmann’s constant. This gives an upper limit to the external pressure of . The upper limit for the ionised gas pressure compares well to the average value of calculate from the measured ionised gas pressures of seventeen BRCs reported in Paper I.
4.2 Star formation within the SFO 79 molecular cloud
4.2.1 Morphology of the bright rim and embedded sources
There is a remarkable correlation between the morphology of the PDR (blue) and the optical gas (red) as seen in Figure 9. The extended MSX band A emission would suggest that the stars and the bright rim do not lie in the same plane of the sky, but that the stars are slightly in the background and the cloud in the foreground with the majority of the stars’ ionising flux impinging onto the far side of the cloud and thus the hidden face of the cloud. This hypothesis is supported by the sharp edge of the bright rim and the 8.3 m emission that extends through the cloud, presumably due to transmission through the cloud from the hidden face. Set back from the bright rim are three thermal sources: a large extended source that is coincident with the embedded UC HII region (described previously in Section 3.2), a smaller source approximately 2′ to the northeast; and a similarly sized source approximately 5′ directly north of the position of the UC HII region. These have been labelled A, B and C running south to north along the edge of the rim (see upper right panel Figure 9).
The largest of the thermal sources A is coincident with both the IRAS point source and the UC HII detected by the radio observations. This source is also identified in the MSX point source catalogue (MSX5C G336.4922-01.4746). We calculated the source size to be 34″ (FWHM) from emission seen in the band E image positioned at (J2000)=16, (J2000) =-48∘ 51′ 44″, only slightly larger than the UC HII region. The majority of the band E emission emanates from the central region, however, the remaining emission emanates from a much larger region surrounding the central source, suggesting the presence of a thick shell of warm diffuse dust roughly 2′ in diameter.
The second thermal source B is associated with the MSX point source MSX5C G336.5233-01.4643. This source was located within the primary beam of our radio observations described in Section 3.2, however, no radio emission was detected toward it (to a 3 rms 16 mJy). This could be due to the limited sensitivity of our observations; that this source does not contain an evolved high-mass star, or that this source is at an earlier stage of development than source A. Searches of astronomical databases failed to associate source B with any catalogued object and an analysis of 2MASS data failed to identify any embedded YSOs. This source was not identified in the IRAS point source catalogue, although there is some suggestion of a source in the IRAS HIRES 60 m image of this region, but it is not readily separable from source A, which dominates the image. The source of the thermal emission in this object is therefore uncertain and its identification depends upon future higher resolution near/mid IR and radio observations.
Thermal source C is the smallest of the three thermal sources, located at (J2000)= , (J2000)=-48∘ 47′ 2.41″ and has been identified in both the MSX and IRAS point source catalogues, MSX5C G336.5487-01.4240 and IRAS 16362-4841 respectively. An analysis of the IRAS fluxes reveals this source has the colour characteristics (e.g., log(F25)/log(F12)=1.5875 and log(F60)/log(F12)=2.75, where the latter is an upper limit) consistent with this source being an UC HII region (Wood & Churchwell, 1989). It is unclear why this source was not included in the SFO catalogue, given its position within the molecular cloud and its IRAS fluxes, since it fulfils all the criteria for being a star forming region. Unfortunately source C was located 5′ from the pointing centre of our radio observations, which places it on the very edge of the 6 cm ATCA primary beam, and thus we have no radio data. We consider this source to be a potential UC HII region.
4.2.2 Star formation associated with SFO 79
There is strong evidence for ongoing star formation toward the position of the embedded IRAS point source 16362-4845 (thermal source A) within SFO 79. Paper I reported strong 3 and 6 cm emission coincident with the position of the embedded IRAS point source leading the authors to suggest that this cloud contained a high mass main sequence star. Further observations reported in this paper have confirmed that the radio emission is associated with the IRAS point source. We have also resolved the source of the radio emission and found it to be consistent with the presence of a deeply embedded UC HII region. The analysis of the radio data has pointed to the presence of a high-mass star of spectral class O9 that is driving the UC HII region. We consider that the correlation of the UC HII region with the small IR cluster of candidate YSOs identified from the 2MASS data is suggestive of small scale sequential star formation induced by the expanding ionisation front and the proceeding photoionisation induced shocks that are driven into the surrounding molecular material. The identification of these candidate YSOs need to be confirmed by deeper photometric observations in J, H, Ks (and possibly L band, as suggested by Meyer, Calvet, & Hillenbrand, 1997).
The IRAS point source embedded within SFO 79 is located approximately 1.2 pc west of the bright rim, coincident with the northern edge of a small knot of emission indicative of a reflection nebula. This identification is supported by the 13CO image which reveals an area of very low emission to the southeast of the IRAS position. If this is indeed a reflection nebula it may indicate the presence of a cavity in the area to the southeast of the IRAS position in the direction of the IR cluster, possibly excavated by the expanding UC HII region or a bipolar outflow from one of the identified YSOs that make up the IR cluster.
The molecular line data have revealed the presence of a dense molecular condensation coincident with the IRAS point source and the UC HII region, offset slightly to the northwest (10″). The molecular condensation has a mass of 51 M⊙, an H2 density of 3104 cm-3, and a global temperature of 20 K. Although this condensation has similar characteristics to protostellar cores observed in similar clouds (e.g. Evans 1999) the condensation does not appear to be centrally-condensed, possibly indicating the presence of several protostellar cores that remain unresolved by the 30″ beam.
4.2.3 Could the star formation have been induced?
The morphology of the bright rim and the positions of the three thermal sources, located at a similar projected distance from the rim of the cloud, hints at the possibility of a causal link between the two. We suggest that the thermal sources are star-forming regions that may have been induced by the propagation of a plane parallel shock front into the cloud. A similar morphology has been suggested for the Orion bright bar by Omodaka et al. (1986) from high resolution CS (J=1–0) observations. This idea is supported by the association of two UC HII regions (one confirmed and another identified as a potential UC HII region) with thermal sources A and C. Given the relatively short lifetime of UC HII regions ( yrs) it seems unlikely to find two within the same cloud at the same time, unless there was a common casual link.
To address this question we need to calculate the time the cloud has been illuminated. If we assume that the distance between the ionising stars and the bright rim of the cloud is close to the projected distance (4.2 pc) and that the ionisation front expands at the sound speed of 11.4 km s-1 it would take approximately 3.6 years for the ionisation front to reach the cloud. In estimating this expansion time scale we have assumed a constant expansion speed (11.4 km s-1) and a density of 102 cm-3 for the intervening material between the ionising stars and the rim of the cloud. Given that OB stars have a typical lifetime of a few million years, it is possible that the cloud has been exposed to the ionising photon flux for a similar length of time. If we assume a typical shock velocity of 1.4 km s-1 for neutral gas with a H2 density of 4 cm-3 (Paper I, Thompson et al. 2004b), then the shock crossing time to the UC HII region would be years. Taken together, the time for the ionisation front to reach the cloud rim and the shock crossing time are 1.4 years, a considerable fraction of the OB stars’ lifetime. It is therefore highly likely that the UC HII regions postdate the arrival of the shock front and thus could have been induced.
Moreover, given that the dynamical timescale of a UC HII region is generally considered to be years and that the protostellar phase lasts for years the time scales involved are all consistent with the hypothesis that the expansion of the UC HII region could itself have gone on to trigger star formation in the surrounding region.
5 Summary and conclusions
We have made measurements of the RRL H92α and radio continuum using the ATCA, and CO observations with the Mopra telescope, toward the embedded IRAS point source 16362-4845 associated with SFO 79. We have combined these observational data with archival data obtained from both the MSX and 2MASS surveys. Strong continuum and RRL emission have been detected toward the embedded IRAS source and have allowed the source of the emission to be resolved, revealing the presence of a deeply embedded UC HII region. The molecular line observations have revealed the presence of a molecular condensation to the northwest of the UC HII region. Analysis of MSX images has revealed the presence of two other thermal sources, B and C, to the north of the IRAS point source 16362-4845, which was also positionally coincident with thermal source A. Thermal source C was found to have IRAS colours consistent with it also being a possible UC HII region. A SIMBAD search of the location of thermal source B failed to associate it with any IRAS point source or radio emission, therefore the origin of this emission is uncertain.
We draw the following conclusions from our analysis of the data:
-
1.
We have resolved the source of the spherical radio emission toward the embedded IRAS point source and have determined an average electron density of 1.4 cm-3, an emission measure of 1 cm-6 pc and a deconvolved physical size of 0.1 pc. As this source fulfils all the criteria set out by Wood & Churchwell (1989) to identify UC HII regions, we therefore confirm the presence of a deeply embedded UC HII region possessing a core-halo morphology. Using the integrated radio fluxes and making the simple assumption that the observed emission is due to the presence of a single OB star, we have determined an upper limit on the spectral type of the OB star that is powering the UC HII region. We estimate the spectral type of the OB star to be O9, however, if the UC HII region is being driven by a cluster, rather than a single star, the earliest star present would be one or two spectral classes later, i.e. a O9.5 or B0 star. A lower limit on the age of the UC HII region has been calculated to be 1 yrs, with a upper limit on the age set by the presence of the CTTSs, which have a typical age of several million years. The CO data have revealed the presence of a dense molecular condensation offset 30″ north of the peak position of the radio data and the IRAS point source.
-
2.
We report the unambiguous detection of a total of 10 candidate YSOs, including 8 previously un-reported, within a 90″ radius of the IRAS point source. Five of these YSOs form an IR cluster within the boundary of the UC HII region. Included in this IR cluster is the only protostar identified and all three of the IR sources that have been identified as possible protostellar candidates. Moreover, analysis of the extinction corrected reddening values would suggest that the IR cluster contains the most reddened YSO candidates detected in the region. All this points to the cluster being relatively young, considering the high number of potential protostars and the other two extremely reddened sources, we estimate the age to be of order of 105 yrs. The correlation of the IR cluster with the UC HII region, and the similarity in ages, leads us to suggest that the formation of these YSOs could have been triggered by the expanding ionisation front of the UC HII region. The presence of candidate YSOs toward SFO 79 identify this region as an active star forming region.
-
3.
The MSX band E image has revealed three thermal sources within the SFO 79 bright-rimmed cloud; we have labelled these three thermal sources A, B and C (see Figure 9 for details). Sources A and C are both associated with IRAS and MSX point sources and with radio emission. We have identified source A as an UC HII region and have found that source C has IRAS colour characteristics consistent with that expected from UC HII regions. All three sources are located approximately at the same distance back from the bright rim and lie along a line that follows the morphology of the bright rim. Although the alignment of all three thermal sources along the rim of the cloud could be purely circumstantial, it strongly suggests that the star formation within could have been induced by the passage of a plane parallel shock driven into the cloud by the ionising stars.
Acknowledgements.
The authors would like to thank the Director and staff of the Paul Wild Observatory, Narrabri, New South Wales, Australia for their hospitality and assistance during the Compact Array and Mopra observing runs. JSU would also like to thank Demitri Muna and Mark Price for reading an early draft of this manuscript and offering some useful suggestions. Finally we would like JSU and LKM are supported by a PPARC doctoral studentships and MAT is supported by a PPARC postdoctoral fellowship grant. This research would not have been possible without the SIMBAD astronomical database service operated at CDS, Strasbourg, France and the NASA Astrophysics Data System Bibliographic Services. The Digitised Sky Survey was produced at the Space Telescope Science Institute under U.S. Government grant NAG W-2166. The images of these surveys are based on photographic data obtained using the Oschin Schmidt Telescope on Palomar Mountain and the UK Schmidt Telescope. The plates were processed into the present compressed digital form with the permission of these institutions. This research makes use of data products from the Two Micron All Sky Survey, which is a joint project of the University of Massachusetts and the Infrared Processing and Analysis Center/California Institute of Technology, funded by the National Aeronautics and Space Administration and the National Science Foundation. This research also made use of data products from the Midcourse Space Experiment. Processing of the data was funded by the Ballistic Missile Defense Organization with additional support from NASA Office of Space Science. This research has also made use of the NASA/ IPAC Infrared Science Archive, which is operated by the Jet Propulsion Laboratory, California Institute of Technology, under contract with the National Aeronautics and Space Administration.
References
- Arnal et al. (2003) Arnal, E. M., May, J., & Romero, G. A. 2003, A&A, 412, 431
- Bertoldi (1989) Bertoldi, F. 1989, ApJ, 346, 735
- Bertoldi & McKee (1990) Bertoldi, F. & McKee, C. F. 1990, ApJ, 354, 529
- Carpenter et al. (1990) Carpenter, J. M., Snell, R. L., & Schloerb, F. P. 1990, ApJ, 362, 147
- Caswell & Haynes (1987) Caswell, J. L. & Haynes, R. F. 1987, A&A, 171, 261
- Caswell & Robinson (1974) Caswell, J. L. & Robinson, B. J. 1987, Australian J. Phys., 27, 597
- Cersosimo (1982) Cersosimo, J. C. 1982, Astrophys. Lett., 22, 157
- Cohen et al. (1981) Cohen, J. G., Persson, S. E., Elias, J. H., & Frogel, J. A. 1981, ApJ, 249, 481
- Cutri et al. (2003) Cutri, R. M., et al. 2003, VizieR Online Data Catalog, 2246, 0
- Dutra et al. (2003) Dutra, C. M., Bica, E., Soares, J., & Barbuy, B. 2003, A&A, 400, 533
- Evans (1999) Evans, N. J. 1999, ARA&A, 37, 311
- Garay et al. (1994) Garay, G., Lizano, S., & Gomez, Y. 1994, ApJ, 429, 268
- Georgelin et al. (1996) Georgelin, Y. M., Russeil, D., Marcelin, M., Amram, P., Georgelin, Y. P., Goldes, G., Le Coarer, E., & Morandini, M. 1996, A&AS, 120, 41
- Goldsmith, Bergin, & Lis (1996) Goldsmith, P. F., Bergin, E. A., & Lis, D. C 1996, IAU Symp. 170: CO: Twenty-Five Years of Millimeter-Wave Spectrocopy, 170, 113
- Gooch (1996) Gooch, R. 1996, ASP Conference Series, Vol. 101, Astronomical Data Analysis Software and Systems V, 5, 80
- Goss & Shaver (1970) Goss, W. M. & Shaver, P. A. 1970, Australian Journal of Physics Astrophysical Supplement, 14, 1
- Herbst (1974) Herbst, W. 1974, AJ, 79, 941
- Herbst (1975) Herbst, W. 1975, AJ, 80, 212
- Herbst & Havlen (1977) Herbst, W. & Havlen, R. J. 1977, A&AS, 30, 279
- Koornneef (1983) Koornneef, J. 1983, A&A, 128, 84
- Kutner & Ulich (1981) Kutner, M. L. & Ulich, B. L. 1981, ApJ, 250, 341
- Lada & Adams (1992) Lada, C. J. & Adams, F. C. 1992, ApJ, 393, 278
- Lefloch & Lazareff (1994) Lefloch, B. & Lazareff, B. 1994, A&A, 289, 559
- Lefloch & Lazareff (1995) Lefloch, B. & Lazareff, B. 1995, A&A, 301, 522
- Lefloch, Lazareff & Castets (1997) Lefloch, B., Lazareff, B., & Castets, A. 1997, A&A, 324, 249
- Mehringer (1994) Mehringer, D. M. 1994, ApJS, 91, 713
- Meyer, Calvet, & Hillenbrand (1997) Meyer, M. R., Calvet, N., & Hillenbrand, L. A. 1997, AJ, 114, 288
- Mezger & Henderson (1967) Mezger, P. G. & Henderson, A. P. 1967, ApJ, 147, 471
- Myers, Linke, & Benson (1983) Myers, P. C., Linke, R. A., & Benson, P. J. 1983, ApJ, 264, 517
- Omodaka et al. (1986) Omodaka, T., Hayashi, M., Suzuki, S., Hasegawa, T., & Miyawaki, R. 1986, Ap&SS, 118, 401
- Panagia (1973) Panagia, N. 1973, AJ, 78, 929
- Panagia & Walmsley (1978) Panagia, N. & Walmsley, C. M. 1978, A&A, 70, 411
- Price et al. (2001) Price, S. D., Egan, M. P., Carey, S. J., Mizuno, D. R., & Kuchar, T. A. 2001, AJ, 121, 2819
- Rathborne et al. (2002) Rathborne, J. M., Burton, M. G., Brooks, K. J., Cohen, M., Ashley, M. C. B., & Storey, J. W. V. 2002, MNRAS, 331, 85
- Sault, Teuben & Wright (1995) Sault, R. J., Teuben, P. J., & Wright, M. C. H. 1995, ASP Conference Series, Vol. 77, Astronomical Data Analysis Software and Systems IV, 4, 433
- Sharpless (1959) Sharpless, S. 1959, ApJS, 4, 257
- Shaver et al. (1983) Shaver, P. A., McGee, R. X., Newton, L. M., Danks, A. C., & Pottasch, S. R. 1983, MNRAS, 204, 53
- Straw et al. (1987) Straw, S., Hyland, A. R., Jones, T. J., Harvey, P. M., Wilking, B. A., & Joy, M. 1987, ApJ, 314, 283
- Sugitani et al. (1991) Sugitani, K., Fukui, Y., & Ogura, K. 1991, ApJS, 77, 59
- Sugitani & Ogura (1994) Sugitani, K. & Ogura, K. 1994, ApJS, 92, 163
- Thompson, Urquhart, & White (2004a) Thompson, M. A., Urquhart, J. S., & White, G. J. 2004a, A&A, 415, 627 (for reference Paper I)
- Thompson et al. (2004b) Thompson, M. A., White, G. J., Morgan, L. K., Miao, J., Fridlund, C. V. M., & Huldtgren-White, M. 2004b, A&A, 414, 1017
- Tothill et al. (2002) Tothill, N. F. H., White, G. J., Matthews, H. E., McCutcheon, W. H., McCaughrean, M. J., & Kenworthy, M. A. 2002, ApJ, 580, 285
- Walsh et al. (1997) Walsh, A. J., Hyland, A. R., Robinson, G., & Burton, M. G. 1997, MNRAS, 291, 261
- Wilson (1970) Wilson, T. L., Mezger, P. G., Gardner, F. F., & Milne, D. K. 1970, A&A, 6, 364
- Whiteoak (1963) Whiteoak, J. B. 1963, MNRAS, 125, 105
- Whiteoak & Gardner (1974) Whiteoak, J. B. & Gardner, F. F. 1974, A&A, 37, 389
- Whiteoak et al. (1982) Whiteoak, J. B., Otrupcek, R. E., & Rennie, C. J. 1982, Proceedings of the Astronomical Society of Australia, 4, 434
- Wood & Churchwell (1989) Wood, D. O. S. & Churchwell, E. 1989, ApJ, 340, 265
- Wright et al. (1994) Wright, A. E., Griffith, M. R., Burke, B. F., & Ekers, R. D. 1994, ApJS, 91, 111
- Yamaguchi et al. (1999) Yamaguchi, N., Mizuno, N., Saito, H., Matsunaga, K., Mizuno, A., Ogawa, H., & Fukui, Y. 1999, PASJ, 51, 775