THE POINT-AGAPE MICROLENSING SURVEY: FIRST CONSTRAINT ON MACHOS TOWARDS M31
To reveal the galactic dark matter in the form of machos (”Massive Astrophysical Compact Halo Objects”), the POINT-AGAPE collaboration is carrying out a search for gravitational microlensing towards M31. A clear microlensing signal is detected. The high-threshold analysis of 3-year data leads to 7 bright and short microlensing candidates. The preliminary estimation of the detection efficiency implies that less than 25% (60%) of standard halos can be composed of objects with a mass between and ( and ) at the 95% C.L. This result is compatible with previous microlensing results towards the Magellanic Clouds and gives the first constraints on machos for a distant spiral galaxy.
1 Introduction
1.1 The galactic dark matter
According to the first generation of microlensing experiments towards the Magellanic Clouds, in particular EROS and MACHO , it is now clear that the halo of the Milky Way is not full of machos (“Massive Astrophysical Compact Halo Objects”). However, galactic halos could still be partly composed of machos (brown dwarfs, Jupiter-like objects,…). Indeed, if the missing baryons belong to galactic halos, they could contribute typically up to 15% to the halo masses.
1.2 Gravitational microlensing towards M31
Microlensing surveys towards M31 probe the halos of M31 and the Milky Way. POINT-AGAPE and several other experiments are devoted to this line of sight. Although M31 is the nearest spiral galaxy, it is about 15 times further away than the Magellanic Clouds. The stars are not resolved and it is necessary to develop new analysis methods. As suggested by P. Baillon et al. (1993) , the AGAPE experiment implements the “pixel lensing” (i.e. the study of the CCD pixel lightcurves). As in most cases we do not have access to the magnitude of the sources, the Paczyński curve (i.e. the lightcurve of a microlensing event with a pointlike source and lens) has only 3 clearly observable parameters in each filter: the date of maximum magnification (), the timescale given by the Full-Width-At-Half-Maximum (), and the flux increase (). Unless the lightcurve is very well sampled with a good signal-to-noise ratio, this implies a degeneracy between the Einstein crossing time, the impact parameter and the flux of the lensed star. As the Einstein crossing-time contains the physical information about the lens, the estimation of the optical depth can only be made with additional priors (e.g. the luminosity function of stars ) and a good statistic.
2 The POINT-AGAPE collaboration
2.1 Presentation
The POINT-AGAPE collaboration carried out a photometric survey of M31 with the Wide Field Camera (WFC) on the m Isaac Newton Telescope (INT) at La Palma, Canary Islands. It observed two fields of about deg2 each, located North and South of the M31 center. The pixel size is and the survey is carried out in three filters: sloan g’, sloan r’ and sloan i’, similar to the SDSS filters. The 3 first years of data are analysed, consisting of 180 nights from August 1999 to January 2002, with typically one hour per night and seeing between and . The analysis of the fourth year is in progress.
2.2 High threshold analysis of a three-year baseline
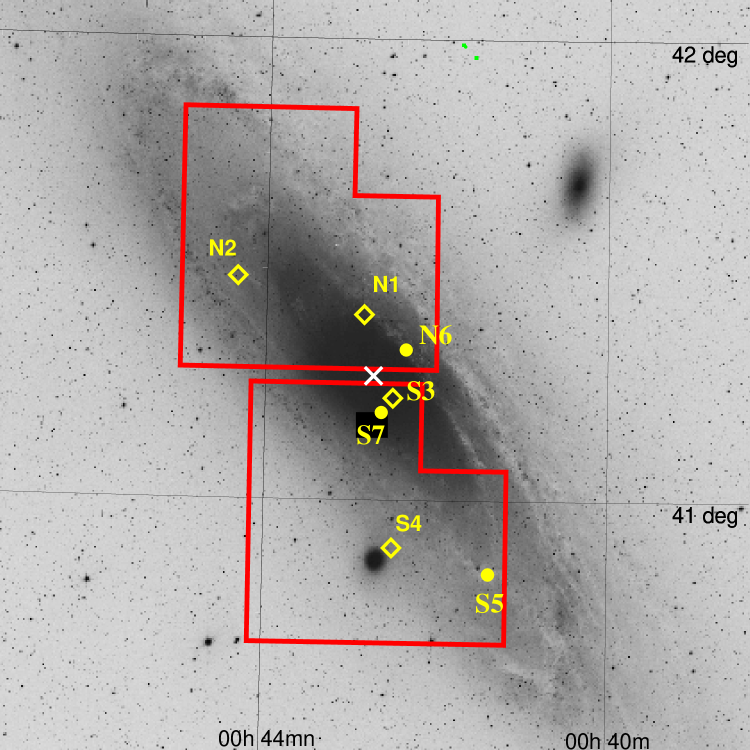
After the first steps of the data reduction, we set up a catalogue of fluctuating lightcurves with , and (where , and are: in the standard Jonhson-Cousins filters, and is the zero point). See also Darnley et al. (2004) for the specific search for novae. This catalogue contains variable stars and contains a ten of convincing microlensing events. We search for them by fitting the lightcurves to an achromatic Paczyński curve , demanding a minimum sampling and a single bump. The remaining Paczyński -like variable stars show a strong correlation between the timescale and the flux increase. In particular, bright () variations have timescales between days and days, whereas we expect more than of the microlensing events to be shorter than days (for machos lighter than few solar masses). So, for the moment, we focus on this best signal-to-noise ratio region: and days. This leads to 7 microlensing candidates: PA 99-N1 , PA 99-N2 (the most spectacular candidate, see figure 1), PA 00-S3 , PA 00-S4 , PA 00-S5 , PA 00-N6 and PA 99-S7 . Some of these lightcurves are shown on figure 2. Most of these candidates were confirmed by other collaborations . We are working on additional statistical criteria to search for fainter and/or longer events.

3 No evidence for machos
The detected microlensing signal is compatible with self-lensingaaaAs well as the macho-signal, we expect a self-lensing signal (when the lens is a star), clustered towards the M31 bulge., so there is no evidence for machos. The spatial distribution of the 7 microlensing candidates is shown on the right panel of figure 1. There are 4 events towards the bulge (PA 99-N1, PA 00-S3, PA 00-N6 and PA 99-S7), one event (PA 00-S4) towards M32 (a dwarf galaxy orbiting around M31) and 2 events (PA 99-N2 and PA 00-S5) towards the disk. To compute constraints on the content of M31 and the Milky Way halos, we consider the microlensing signal at more than from the M31 center and more than from M32. According to our preliminary estimation of the detection efficiency, we expect 1 self-lensing event in this area, and more than 20 (8) macho events for standard halos full of machos with masses between and ( and ). The existence of 2 possible macho events (PA 99-N2 and PA 00-S5) leads to the following upper limit: less than 25% (60%) of standard halos can be composed of objects with masses between and ( and ) at the 95% C.L. This first constraint on machos in a distant spiral galaxy is currently improved (by lowering the detection thresholds, improving the detection efficiency, and including the fourth year data) and will be submitted soon in Calchi Novati S., Paulin-Henriksson S. et al. .


References
References
- [1] Afonso C. et al. (2003), A&A, 400:951.
- [2] Alcock C. et al. (2000), ApJ, 542:281.
- [3] An J.H. et al. (2003), ApJ, 601:845.
- [4] An J.H. et al. (2004), MNRAS, 351:1071.
- [5] Aurière M. et al. (2001), ApJ, 553:L137.
- [6] Baillon P. et al. (1993), A&A, 277:1.
- [7] Calchi Novati S. et al. (2004), in progress.
- [8] de Jong J.T.A. et al. (2004), A&A, 417:L461.
- [9] Darnley M.J. et al. (2004), submitted to MNRAS, astro-ph/0403447.
- [10] Gondolo P. (1999), ApJ, 510:L29.
- [11] Paczyński B. (1986), ApJ, 304:1.
- [12] Paulin-Henriksson S. et al. (2002), ApJ, 576:L121.
- [13] Paulin-Henriksson S. et al. (2003), A&A, 405:15.
- [14] Riffeser A. et al. (2003), ApJ, 599:L17
- [15] ING web page: http://www.ing.iac.es