Dense Ionized and Neutral Gas Surrounding Sgr A⋆
Abstract
We present high resolution H41 hydrogen recombination line observations of the (3 pc) region surrounding Sagittarius A⋆ (Sgr A⋆) at 92 GHz using the Millimeter Array at the Owens Valley Radio Observatory (OVRO) with an angular resolution of and velocity resolution of 13 km s-1. New observations of H31, H35, H41 and H44 lines were obtained using the NRAO 12-m telescope, and their relative line strengths are interpreted in terms of various possible emission mechanisms. These NRAO 12-m measurements are the most extensive recombination line survey of this region to date. These OVRO data also represent the highest angular resolution and the highest sensitivity observations of Sgr A West in hydrogen recombination line and continuum emission at the millimeter (mm) wavelengths. Observations of HCO transition at 89 GHz are obtained simultaneously with a 40% improved angular resolution and 4-15 times improved sensitivity over the previously published results, and the distribution and kinematics of the dense molecular gas in the circumnuclear disk (CND) are mapped and compared with those of the ionized gas. The line brightness ratios of the hydrogen recombination lines are consistent with purely spontaneous emission from K gas with cm-3 near LTE condition. A virial analysis suggests that the most prominent molecular gas clumps in the CND have mean densities of order cm-3, sufficient to withstand the tidal shear in the Galactic Center region. Therefore, these clumps may survive over several dynamical times, and the CND may be a dynamically stable structure. We estimate a total gas mass of about for the CND. Our combined analysis of the new high resolution H41 and HCO+ images and our kinematic model demonstrates a widely spread physical and dynamical link between the molecular gas in the CND and the ionized gas, including along the eastern rim of the CND where a gap was previously suggested.
1 Introduction
Studying radio recombination lines (RRLs) is one of the most direct ways of probing ionized gas such as HII regions. Ionized gas properties such as kinematics, electron temperatures, and the geometrical filling factor can be directly constrained by the recombination line flux density, line width, free-free continuum flux density, and size of the line-emitting regions. At centimeter (cm) wavelengths, RRLs are primarily stimulated emission amplifying extended non-thermal synchrotron emission. Therefore, distinguishing emission arising from diffuse, low density gas from that from clumpy, high density gas is difficult. Also, pressure broadening of the line width can complicate the interpretation of the cm RRL observations. For instance, cm RRL emission from luminous starburst systems such as Arp 220 may be dominated by internally stimulated emission from diffuse ionized gas (Anantharamaiah et al., 1993; Zhao et al., 1996) while spontaneous emission process is important at higher frequencies (e.g. Anantharamaiah et al., 2000; Yun et al., 2003). Interpretation of recombination lines at millimeter (mm) wavelengths is more straightforward since stimulated emission and pressure broadening become negligible in most cases. Recent studies of mm RRLs in Galactic H II regions (Gordon & Walmsley, 1990; Martin et al., 1994; Gordon, 1994) and starburst galaxies (Seaquist et al., 1996; Puxley et al., 1997) found higher line fluxes than expected from the lower frequency measurements. A steep rise in line flux density with frequency, characteristic of optically thin spontaneous emission, is seen in nearby starburst galaxies M82 and NGC 253 (Seaquist et al., 1996; Puxley et al., 1997).
The central 1 parsec region surrounding the putative central source in our Galactic Center, Sgr A⋆, is a frequent target of multi-wavelength investigations primarily because it is the nearest and the best laboratory for studying the active galactic nucleus (AGN) phenomenon and its fueling process. Currently this region appears to be relatively gas free. However, immediately surrounding Sgr A⋆ is an array of ionized gas streamers (“Sgr A West”; see review by Yusef-Zadeh et al., 2000). These streamers have been previously studied in the 12.8 m [Ne II] (Lacy et al., 1980; Serabyn & Lacy, 1985), P (Scoville et al., 2003), and in cm RRL (Schwarz et al., 1989; Roberts et al., 1991; Roberts & Goss, 1993; Roberts, Yusef-Zadeh, & Goss, 1996), and they consist of several distinct kinematic features. The total mass of the ionized streamers is estimated to be less than 100 M⊙ in total. Recent IR and radio observations found evidence for neutral gas within this central “cavity” (Genzel et al., 1985; Jackson et al., 1993; Latvakoski et al., 1999; Herrnstein & Ho, 2002), suggesting a more substantial presence of gas in the central parsec region. Surrounding and closely interacting with the ionized streamers is the dense and clumpy molecular ring commonly referred to as the circumnuclear disk (CND). The CND is asymmetric about Sgr A⋆, indicating its possible origin related to a gravitational capture of a passing cloud or energetic disruption of a stable ring (Morris & Serabyn, 1996). This ring is believed to represent a circumnuclear accretion disk feeding the inner parsec although some have argued that the CND is not a complete ring (see Marshall et al., 1995; Wright et al., 2001). The ionized streamers in Sgr A West are explained as cloudlets from the clumpy ring that after losing momentum have fallen toward the center and thereby have stretched and have been ionized by photo-dissociation within the inner parsec (see Sanders, 1998). Sensitive imaging studies in cm RRL (Roberts et al., 1991) suggest high temperature ( K), with a possible radial temperature gradient increasing toward Sgr A⋆. The large proper motions of the stars very close to Sgr A⋆ suggest central dark mass of 2.5-4.1 M⊙ (Genzel & Eckart, 1999; Ghez et al., 2000, 2003).
Motivated by the detection of extragalactic mm RRLs and recent new observations of the Galactic Center region, we have imaged the H line at high angular resolution toward Sgr A⋆ in order to study the nature of the ionized streamers and their relation to the dense neutral gas in and around the CND. At high frequencies, most of the RRL and continuum emission comes from the densest ionized gas (see Brown et al., 1978; Mohan et al., 2001). One of the primary goals of this study is to examine the existence of ionized gas denser than that traced by cm-wavelength RRLs in this region. The nature of the radiation mechanism is investigated by analyzing the new H31, H35, H41, and H44 line observations obtained at the NRAO 12-m telescope at Kitt Peak, Arizona. We further examine whether any dense neutral gas is directly associated with the ionized streamers using our sensitive, high resolution HCO+ (1–0) images. Our HCO+ (1–0) data have superior sensitivity and angular resolution over the previously published observations of similar molecular species (Güsten et al., 1987; Marr et al., 1993; Wright et al., 2001). In addition, a detailed analysis of the spatial distribution and kinematics of the dense molecular gas and ionized gas in the CND is offered using a simple kinematical model.
2 Observations
2.1 OVRO Millimeter Telescope Array
The H41 and HCO+ (1–0) observations were made using the low, equatorial and high resolution configurations of the millimeter telescope array at Owens Valley Radio Observatory. The observational parameters from the multi-configuration observations conducted during the spring and fall 1998 are given in Table 1. The OVRO array consists of six 10.4 meter telescopes equipped with cooled SIS receivers. Interferometric measurements are made using a total of 45 independent baselines in order to maximize the sampling of the uv-plane and to achieve the highest imaging dynamic range possible. In the high resolution configuration the longest baseline used was 220 meters. The spectrometer modules were arranged so that each line was covered with a total of 60 channels at 4 MHz (13 km s-1) resolution centered at the velocity of km s-1. By setting the LO frequency at 90.5 GHz, H41 line at 92 GHz (upper sideband) and HCO+ (1–0) line at 89 GHz (lower sideband) could be observed simultaneously. The primary beam (field of view) is about at these frequencies. A nearby calibrator NRAO 530 was observed every 15 minutes to track the atmosphere and instrumental gain. The amplitude scaling is derived from the observations of 3C 273, whose flux density is monitored daily relative to Uranus and Neptune with an accuracy of about 20%.
The data were reduced using the OVRO data reduction program MMA (Scoville et al., 1993). Sgr A⋆ is a low declination source, , and the synthesized beam is highly elongated in the N-S direction. The resulting beam size is (FWHM). The data were imaged and analyzed using DIFMAP (Pearson et al., 1994) and Astronomical Image Processing System (AIPS) provided by the National Radio Astronomy Observatory (NRAO). Of the total 60 channels in the spectra, 15 line-free channels (60 MHz total) were used to construct the continuum image. Unresolved strong continuum source Sgr A⋆ ( Jy beam-1) and the ionized streamers were used for self-calibration in DIFMAP, and the continuum was subtracted from the spectral line channels. All spectral and continuum images were corrected for primary beam attenuation. Subsequent analysis of the spectral line data cubes were conducted using AIPS and Groningen Image Processing System (GIPSY).
2.2 NRAO 12-m Telescope
We have obtained the H31 (210.502 GHz), H35 (147.047 GHz), H41 (92.034 GHz), and H44 (74.645 GHz) hydrogen recombination line spectra of Sgr A West using the NRAO 12-m telescope at Kitt Peak during May 1998. The NRAO 12-m telescope is equipped with single sideband SIS receivers, and typical system temperature ranged between 250 and 400 K (SSB), despite the low elevation of the source. The beam size is inversely proportional to the frequency and is 69′′ at 92 GHz. Both the filter banks (500 MHz at 2 MHz resolution) and hybrid digital spectrometer (600 MHz at 0.78 MHz resolution) were used to record the data. A wide range of OFF positions were examined, mostly along the minima in CO and HCN surveys of the Galactic Center region. After an extensive investigation, it was determined that the hydrogen recombination line emission is highly localized around Sgr A⋆, and the final spectra presented here were obtained with a simple azimuth offset of .
From the observatory report on the telescope efficiency measurements, we adopt the corrected main beam efficiency of 0.48, 0.85, 0.90, and 0.95 for the four observed frequencies, respectively (Mangum, 2000). These efficiencies are used to convert the observed brightness temperature to the main beam temperature and then to flux density. The telescope efficiency measurements and the subsequent corrections are inherently uncertain, and we adopt an absolute uncertainty of 20% for the measured flux density.
3 RESULTS
3.1 Continuum at 92 GHz
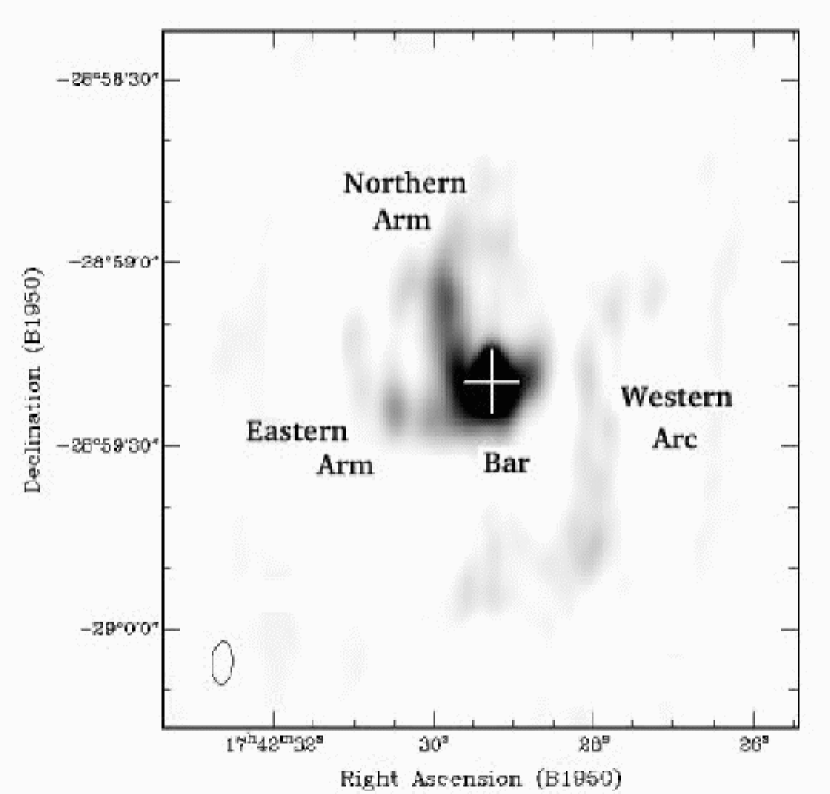
The 92 GHz continuum image of the Sgr A complex at the resolution of (PA = ) is shown in Figure 1. The major components of the Sgr A complex detected are the spiral structure known as Sgr A West and the compact central source Sgr A⋆, marked by a cross. The bright central source, Sgr A⋆, has peak flux density of Jy beam-1. The total 92 GHz continuum flux density detected inside the 85″ diameter region is 12 Jy. Some of the extended continuum emission may be missed by our observations as the 19-pointing mosaic image by Wright et al. (2001) reported a total flux of 15 Jy covering a slightly larger area while Wright & Backer (1993) reported a total flux of 27 Jy within a 2′ radius of Sgr A⋆ from a combination of BIMA and Nobeyama 45-m telescope data.
The major continuum features of Sgr A West are identified in Figure 1, and their observed and derived properties are tabulated in Table 2. The east-west oriented filamentary structure located immediately south of Sgr A⋆ is the bar of Sgr A West. The total continuum flux at 92 GHz from the bar is about 0.9 Jy with a peak brightness of 0.7 Jy beam-1. The bar appears to connect to the western arc and the eastern arc on each ends. Running almost perpendicular to the bar is the northern arm with higher total integrated flux density of about 1.1 Jy. The continuum flux is higher toward the southern part of the northern arm. To the west of the bar is the western arc that curves south. It also extends north almost reaching the northern arm. The continuum flux from the western arc is relatively weak. The eastern end of the bar curves along the eastern arm but is not detected further north. The morphology of the ionized gas around the Sgr A complex shown in Figure 1 is remarkably similar to the 8.3 GHz continuum image by Roberts & Goss (1993).
The peak flux density measured outside Sgr A⋆ range between 0.1 0.75 Jy beam-1 (see Table 2), which corresponds to peak brightness temperature of 1.1 6.0 K. Assuming this continuum is largely thermal free-free emission from 7000 K gas (see § 4.2), one can infer an optical depth of if the emitting region fills the beam with a unit filling factor. Even if the filling factor is not near unity, this inference of optically thin emission should be secure unless the continuum emission is entirely concentrated into discrete clumps with a diameter of 0.005 pc (1000 AU) or smaller. Continuum optical depth is given by
| (1) |
Assuming K, the emission measure () required to produce continuum opacity of at 92 GHz is cm-6 pc. If the thickness of the filaments along the line of sight is comparable to the apparent width ( pc), then the inferred mean electron density is cm-3 ( cm-2). If the ionized gas is clumped at much smaller scales, then the electron density would be correspondingly larger. In comparison, Lutz et al. (1996) derived cm-3 from their analysis of fine-structure line ratios. The consideration of collisional de-excitation of the observed [Ne II] emission places an upper limit on the electron density of about cm-3 (Jackson et al., 1993). Therefore the geometry of the ionized gas must be fairly smooth over 0.01-0.1 pc scales.
3.2 H41
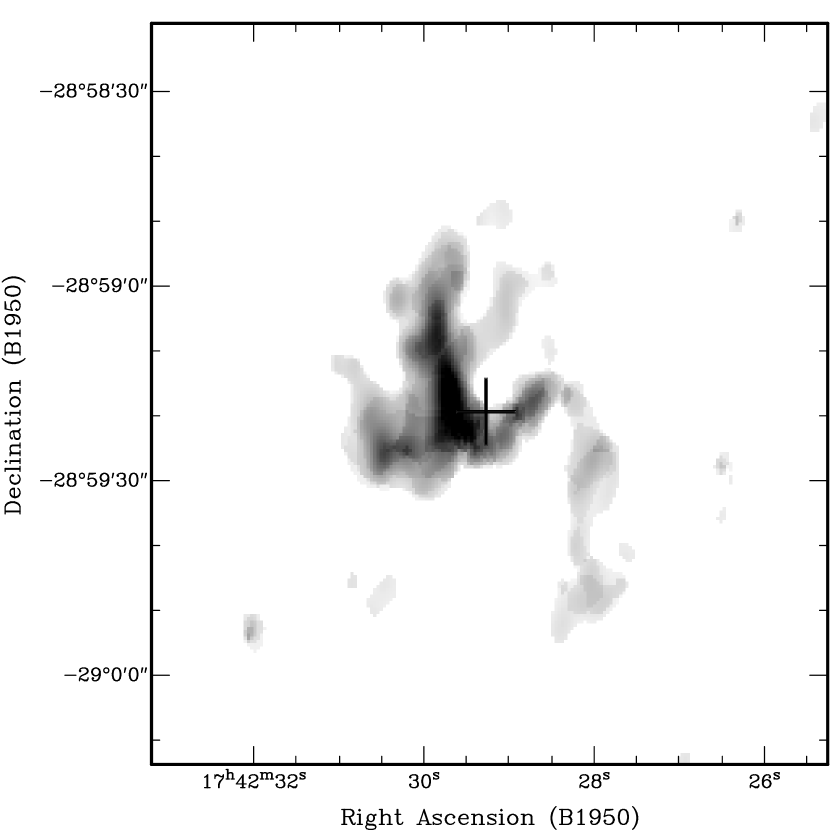
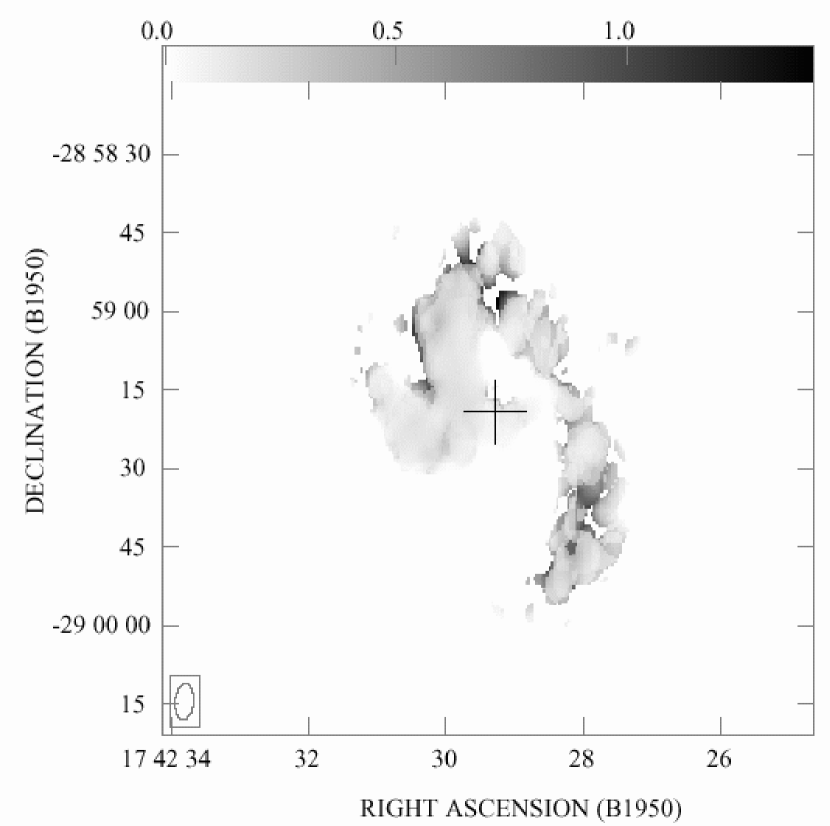
The velocity integrated line flux density (“moment zero”) image, shown in Figure 2, was generated by summing the continuum subtracted H41 image cube over all velocity channels with line emission (from km s-1 to +221 km s-1; see Figure 3). The cross marks the position of Sgr A⋆. The main features seen in the line emission map are very similar to the 92 GHz continuum map shown in Figure 1, except for the absence of the bright, compact source corresponding to Sgr A⋆. The emission from the western arc is weaker than seen in continuum. The northern arm is the brightest continuum feature besides Sgr A⋆, and the brightest H41 emission region also occurs in the northern arm just northeast of Sgr A⋆. The central bar shows a wide range of emission intensity and structures.
A summary of the measured parameters for all major features are given in Table 3. The sizes tabulated for the listed regions have been calculated assuming 1 = 2.5 pc (Reid, 1989). Unlike the 92 GHz continuum that peaks at Sgr A⋆, the brightest feature in H41 occurs in the northern arm with a peak brightness temperature of K. The western arc, however, appears relatively weak in H41 line. The peak line brightness for all H41 are K, and thus the H41 emission is also optically thin, (see below).
The spatially averaged H41 line profiles for the six prominent emission regions (identified with boxes) are shown in Figure 4. The GIPSY tasks PROFIL and PROFIT were used to calculate the line-to-continuum (L/C) ratios and to fit a Gaussian profile to the data using a least squares procedure. The crosses indicate the data points, the solid lines are the Gaussian profiles, and the dashed lines represent the residuals. Calculations of Gaussian profiles yield four parameters: peak line-to-continuum flux density ratio, velocity integrated line intensity, central velocity, and the line width. These parameters are summarized in Table 4 along with the derived LTE electron temperature derived from the L/C ratios (see further discussions in § 4.2). A typical L/C ratio along the northern arm is around 0.4. The L/C ratio is the largest () in the western arc while the L/C ratio in the bar drops from 0.6 to 0.03 within the 2 to 4 beam radii of Sgr A⋆.
The kinematics of the ionized gas traced by H41 shown in Figures 3 and 4 are generally consistent with that of rotation about Sgr A⋆, similar to that of the CND, in broad agreement with previous studies of SgrA West in RRLs (Roberts et al., 1991; Roberts & Goss, 1993) and in 12.8 m [Ne II] (Serabyn & Lacy, 1985). The central bar spans a very wide range of velocity, between +33 km s-1 and 293 km s-1 (see Figure 3), much larger than those associated with the northern arm (between +163 km s-1 and +7 km s-1) and the western arc (between 7 km s-1 and 111 km s-1). This large velocity gradient suggests that this gas is located deeper in the gravitational potential, much closer to the central mass concentration, than the rest of the ionized gas. Citing the relatively cool dust temperature along the bar, Latvakoski et al. (1999) have argued that the nearness of the bar to Sgr A⋆ is largely in projection only, but this large spread in velocity and the correspondingly large velocity gradient requires that this gas feature has to be located much closer to the central mass concentration than the northern arm and the western arc. Since the CND is already viewed with a large inclination (), placing a gas streamer in a more edge-on orbit can increase the line-of-sight velocity only by about 25%. Therefore a viewing geometry alone cannot account for the large observed velocity gradient. Neither the angular resolution nor the overall S/N of the new H41 data are better than the previous VLA H92 measurements, and the main new insight obtained is that the ionized gas traced in H41 emission share the same kinematics as the gas responsible for the H92 emission.
The H41 line widths of the ionized streamers range between 43 km s-1 and 347 km s-1 (see Table 4). The broadest line is seen toward Sgr A⋆ with V = km s-1 (see Figure 4, Box 4), but the S/N of this measurement is quite small in each individual channels. The next broadest line occurs in the vicinity of bright H41 region in the northern arm with V km s-1 (Box 6 in Figure 4). The narrowest line is seen toward the southern end of the western arc (Box 3 in Figure 4) with V km s-1. Using 2″ resolution VLA H92 images, Roberts & Goss (1993) have shown that crowding of distinct kinematical components along the line of sight can make the emission lines appear much broader than the intrinsic line width of about 50 km s-1. Combined with the large velocity gradient expected near the central mass concentration, the large line width we derive from H41 emission must be primarily the result of spatial averaging resulting from our large observing beam of . A typical line width measured in each pixel is between 40-75 km s-1. Given the low S/N of the data, it is not physically meaningful to deconvolve the individual kinematic components by fitting multiple Gaussians to the observed spectra. There is a clear trend of increasing L/C ratio with a decreasing line width. Such a trend is expected if the line and continuum emission arises from the same ionized gas clouds and the emitting gas has a narrow range of electron temperature (see § 4.2).
3.3 HCO
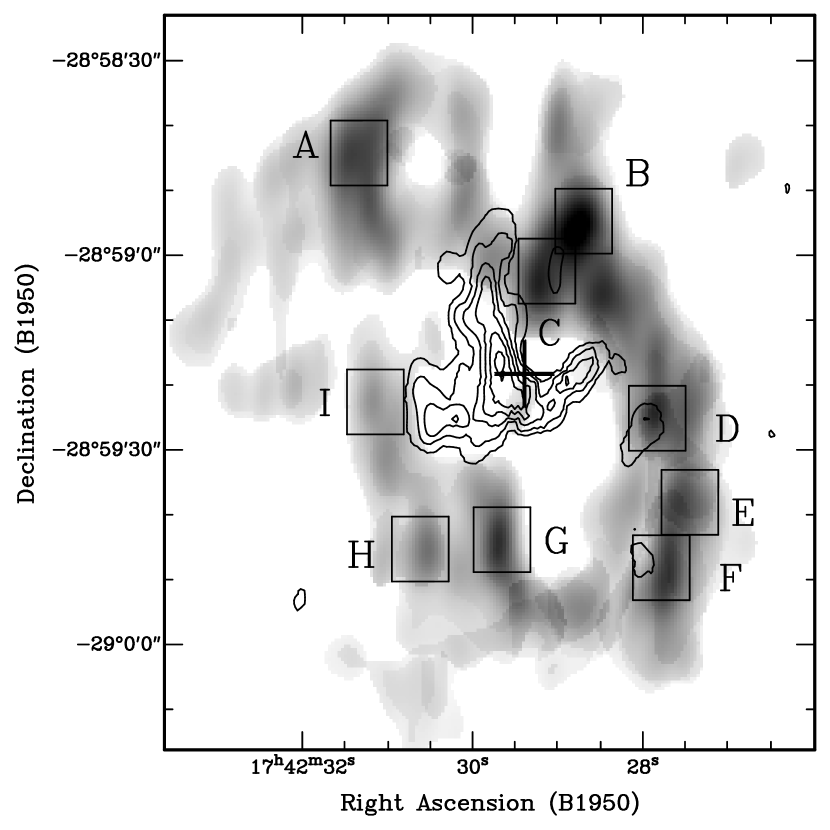
Figure 5 shows the high resolution image of the molecular ring in HCO+ emission (grey-scale) superimposed over the H41 (contour) emission. The circumnuclear ring traced in HCO+ appears more complete than seen in the previous HCN (Güsten et al., 1987) and HCO+ (Marr et al., 1992) images obtained using the BIMA array. More recently Wright et al. (2001) imaged HCN, HCO+, and H42 in a wider field of view using a 19-pointing mosaic, offering a much better overall picture of the molecular gas distribution in the 10 pc region surrounding the Sgr A⋆. However, the latest BIMA data by Wright et al. are not much better than the older BIMA data in resolution and sensitivity. These different images agree with each other broadly, but significant differences also exist in the details. One important difference is that the angular resolution of our new OVRO data is 40% better than those of Güsten et al. and Marr et al., and our sensitivity is also 4 and 15 times improved, respectively. The BIMA array is more sensitive to faint extended emission, and its data reduction procedure is tuned to emphasize such features. In contrast, our moment analysis is more sensitive to identifying bright emission clumps, and this accounts for the more complete appearance of the CND in Figure 5, consisting of many discrete features.
Determining whether any dense neutral gas is associated with the ionized streamers surrounding Sgr A⋆ is one of the major objectives for our study. While the new observations have revealed clear evidence for a close physical link between ionized and neutral molecular gas (as discussed later in §4.4), no HCO+ emission is found spatially and kinematically coincident with the ionized streamers traced in H41 (See Figure 3). Actually HCO+ absorption is seen in many channels, particularly at blueshifted velocities, but most of these features show little kinematic relation to the H41 emission. The spatial distribution of HCO+ absorption resembles the entire continuum structure, and therefore the absorbing gas must be located in the foreground, associated with the 100 pc scale molecular disk imaged by Tsuboi et al. (1999) and others. Among the redshifted velocity channels where little foreground absorption is present (e.g., +117 to +195 km/s), there is little evidence for HCO+ absorption at the locations of the H41 and continuum emission peaks. In these channels, the upper limit to the optical depth for HCO+ absorption is about 0.3 () at a spectral resolution of 13 km s-1. This limit corresponds to an upper limit on the HCO+ column density of cm-2. For an assumed HCO+ abundance of , this translates into an H2 column density of cm-2. If the HCO+ abundance appropriate for a translucent cloud (where ion chemistry is important, see Hogerheijde et al., 1995) is adopted, the inferred upper limit on the column density becomes as little as cm-2. These upper limits are close to or smaller than the column density of cm-2 inferred from the [O I]/[C II] far-IR line ratio (Jackson et al., 1993) and the mid-IR color analysis (Latvakoski et al., 1999). Using the calculations by Sternberg & Dalgarno (1989), Jackson et al. (1993) have proposed that most of the molecules in the neutral gas inside the central cavity with cm-2 are photo-dissociated and that the neutral gas is primarily atomic. Our HCO+ absorption measurements are consistent with these conclusions, and we conclude independently that Sgr A West filaments are either highly ionized or are largely atomic.
3.4 H31, H35, H41, and H44
The hydrogen recombination line spectra obtained at the NRAO 12-m telescope are shown in Figure 6, and the observing frequency and the measured line flux are summarized in Table 6. The mm frequency window is rich in spectral transitions, and studying faint emission lines in the Galactic Center region can be challenging. The H35 line is not shown because it is completely swamped by the much stronger CS line at 146.969 GHz, and no useful information could be derived.
The H44 spectrum, shown at the bottom of Figure 6, is the least confused and the highest S/N measurement among all transitions observed at the 12-m telescope. The observed line profile closely resembles the H41 spectrum derived from the OVRO interferometer data (shown with a solid line in the middle of Figure 6). The total velocity integrated line flux density is Jy km s-1 within the 84″ beam of the 12-m telescope at 74.645 GHz.
The H41 spectrum obtained using the NRAO 12m telescope, shown with a dotted line in the middle of Figure 6, shows a bright, narrow feature near +200 km s-1. This is not seen in the H41 spectrum obtained from the OVRO data (shown in solid line). We have mapped H41 emission in a 2′ by 3′ region centered on Sgr A⋆ in order to examine the spatial extent of this spectral feature. The broad emission feature seen in the OVRO data and in the H44 spectrum is spatially confined only to the central position while the bright, narrow feature appears everywhere with little velocity gradient. The narrow line width, little velocity gradient, and wide-spread distribution strongly indicate that this narrow component is a Galactic foreground emission. A likely identification is CH3CN, which has transitions at 91.959, 91.970, 91.980, 91.985, and 91.987 GHz. The total velocity integrated H41 line flux density from the OVRO data is Jy km s-1. This is a lower limit since some extended flux may be missed by the interferometer (see below).
The H31 spectrum shown at the top of Figure 6 is obtained by summing 8 independent spectra covering the whole Sgr A West complex. The telescope beam at 210.502 GHz is about 30″ and spatially resolves the Sgr A West structure. Therefore a 3 3 grid map was obtained at full beam sampling. The NE grid point was not observed, and the 8 spectra are summed together to derive the integrated H31 spectrum. The H41 channel maps (Figure 3) suggest that our H31 spectrum may be missing some redshifted emission at = 50 - 150 km s-1. Nevertheless, the summed spectrum closely resembles the H41 and H44 spectra, and we made no attempt to correct for any missing flux.
4 DISCUSSION
4.1 Massive Compact Molecular Clumps in the CND
The nine brightest HCO+ clumps within the CND are identified as localized peaks of velocity integrated HCO+ flux density map (Figure 5), and their physical sizes and emission characteristics are summarized in Table 5. The peak line brightness temperature, averaged over the (0.29 pc 0.15 pc) beam, ranges between 10 and 30 K. In comparison, the gas temperature derived from NH3 is 60-70 K (Coil & Ho, 2000) while the dust temperature of about 75 K is derived by Latvakoski et al. (1999) from the far-infrared observations. Since HCO+ emission is strongly absorbed by the foreground gas along the line of sight and the beam filling factor is likely less than unity, the gas temperature inferred from the observed line brightness is strictly a lower limit. The measured peak HCO+ line temperature is comparable to the values found by earlier BIMA studies (see § 3.3) with a lower angular resolution, and one can safely deduce that the optically thick molecular gas nearly fills the beam at pc scales in these CND clumps.
We have computed virial masses of the individual HCO+ emitting clouds as,
| (2) |
where is the radius of the cloud in pc and is the line width in km s-1. If these individual molecular gas clumps are self-gravitating, then their masses range between (see Table 5). Assuming a spherical geometry, the mean mass density () is between g cm-3 and mean H2 molecule density of cm-3. These densities are significantly larger than the values inferred from the excitation analysis ( cm-3, Genzel et al., 1985; Marr et al., 1993; Marshall et al., 1995). For a central source with a mass of (Ghez et al., 2003), the critical mass density required to survive the tidal shear at a radius of 1.5 pc is g cm-3 or cm-3. Contrary to the previous studies using excitation analysis, we conclude that the mean gas density inferred from the virial analysis is close to or exceeding the critical density for surviving the tidal shear if they are self-gravitating. Also, the CND may well be a structure that can survive several dynamical time scales ( years). The total gas mass for the CND inferred from our virial analysis is around , which is only a few per cent of the total dynamical mass for the central one parsec region. The virial mass of each of these clumps are about two orders of magnitude larger than that of the ionized gas associated with the whole ionized spiral (Sgr A West). Therefore, an infall of even a much smaller gas clump is sufficient to account for the observed ionized streamers. The new higher resolution 10-field mosaic observations of HCO+ and HCN emission by Christopher et al. (2004) suggest even higher mean density ( cm-3) for these dense neutral clumps.
4.2 Electron Temperature in Sgr A West
The 92 GHz continuum around Sgr A is primarily free-free emission, and a good spatial correspondence between the continuum (Fig. 1) and the H41 line (Fig. 2) emission is naturally expected. Despite the similar morphology, however, a comparison suggests that the line emission is significantly clumpier than the continuum, especially in the western arc. The central bar is also clumpier in the line emission. In addition, in the northern arm the line emission appears brighter than anywhere else with an increasing trend toward Sgr A⋆. These differences may not be intrinsic to the source. A lower signal-to-noise ratio in the line image probably accounts for some of the differences. In addition, the continuum image suffers more from the missing flux problem than the line images because of a larger effective source size.111A line emitting area is significantly smaller in size than the continuum emitting region in individual channel maps for an object with a large velocity gradient such as a rotating disk.
For optically thin gas in LTE emitting thermal continuum and negligible pressure broadening, LTE electron temperature can be derived from the line-to-continuum ratio as,
| (3) |
where is the observing frequency in GHz, is the velocity width (FWHM) in km s-1, and are continuum and line flux densities, respectively, and is the singly ionized helium abundance (Brown et al., 1978; Roberts & Goss, 1993). In the case of Sgr A West the aforementioned assumptions may be reasonably made along with the interpretation that the continuum at 92 GHz is largely free-free emission. The singly ionized helium abundance of 10% is assumed for Sgr A West (Roberts & Goss, 1993). The H41 line widths listed in Table 4 are larger than the typical H92 line widths of 40-50 km s-1 reported by Roberts & Goss (1993), and this is the direct consequence of a poorer angular resolution of the H41 observations. The resulting blending of emission features could conspire to produce unusual L/C ratios if gas temperature and density vary significantly along the ionized streamers. The high angular resolution observations by Roberts & Goss (1993) have shown that this is not the case, and the poorer angular resolution of our H41 observations should not affect our analysis in most cases.
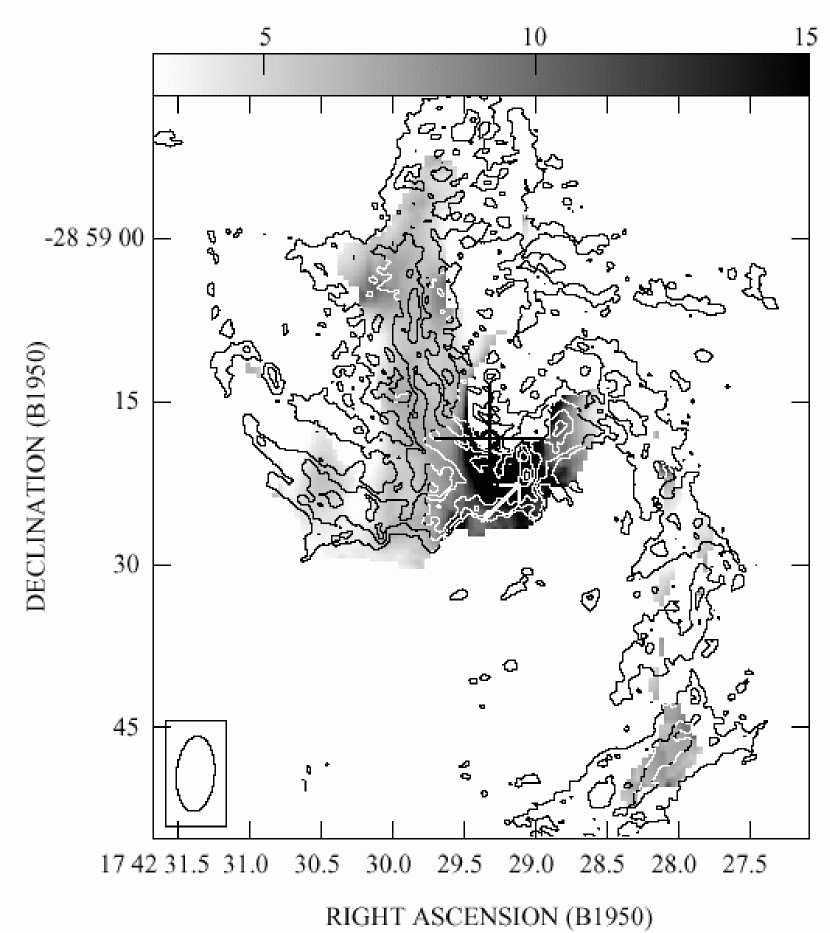
An electron temperature map can be derived from the 92 GHz continuum map (Fig. 1), the velocity integrated H41 map (Fig. 2), and the relation given in Eq. 3. The derived electron temperature map, shown in Figure 7, reveals a fairly uniform distribution of around 7000 K throughout the Sgr A West complex except near Sgr A⋆ (see Table 4). In general derived at higher frequencies tends to be larger because of diminishing contribution from stimulated emission. However, electron temperature derived with H41 line at 92 GHz agrees well with the derivation using H92 line at 8.3 GHz ( K, Roberts & Goss, 1993), suggesting that the contribution from stimulated emission is negligible even frequencies as low as 8.3 GHz. Detecting little H41 emission in the direction of the bright continuum source Sgr A⋆ is another clear evidence that stimulated emission is not important at 92 GHz (see § 4.3).
The higher electron temperature derived along the central bar just south of Sgr A⋆ has previously been noted by Schwarz et al. (1989) and Roberts et al. (1991), and whether this is a real effect or an artifact of data analysis has been a subject of recent debates. Citing the discovery of highly blueshifted line emission near km s-1 missed by these earlier studies, Roberts & Goss (1993) have suggested that the unusually low L/C ratio and thus the inferences of higher electron temperature may be erroneous. In general, a lower than expected L/C ratio can result from either (1) missing line flux or (2) extra continuum flux. The explanation by Roberts & Goss (1993) is the former, but a careful analysis using the actual measurements of the extremely blueshifted line by Roberts, Yusef-Zadeh, & Goss (1996) revealed that the missed flux alone cannot fully account for the low L/C ratio. In addition, Roberts, Yusef-Zadeh, & Goss (1996) noted the presence of two optically thick continuum sources IRS 2 and IRS 13 whose additional continuum flux should contribute to the unusually low L/C ratio (and higher ) observed. A broad coincidence of this position with that of the “mini-cavity” (Yusef-Zadeh et al., 1990) and its possible impact on the calculation of are discussed in detail by Roberts & Goss (1993). Presence of significant structures at scales smaller than our synthesized beam violates the simple geometrical assumption going into Eq. 3 (also see Brown et al., 1978), and this may account for part of the observed local “enhancement” in .
The local enhancement in electron temperature near the location of IRS 2 and IRS 13 is clearly seen in Figure 7 in the same manner as the seen in Figure 14 of Roberts & Goss (1993). The persistence of this feature at 92 GHz implies that the presence of the two continuum sources as suggested by Roberts, Yusef-Zadeh, & Goss (1996) does not offer a full explanation for the observed low L/C ratio. Roberts, Yusef-Zadeh, & Goss (1996) estimated an optical depth of and at 8.3 GHz for the continuum sources IRS 2 and IRS 13 by comparing their 8.3 GHz image with the 5 and 15 GHz VLA continuum images. Free-free optical depth scales as (see Eq. 1), and the continuum optical depth for IRS 2 and IRS 13 should be at 92 GHz. In comparison, optically thin free-free emission associated with the ionized filament should scale only as . As a result, the continuum contribution from IRS 2 and IRS 13 should be substantially reduced at 92 GHz, and the L/C ratio should reflect mostly the optically thin emission associated with the ionized gas filaments in SgrA West. However, the observed L/C ratio at 92 GHz is still noticeably lower at this location. The area of a lower L/C ratio is not centered on these two continuum sources either. If continuum opacities for these two sources are much larger than estimated by Roberts et al. (i.e., optically thick even at 92 GHz), then the explanation of IRS 2 and IRS 13 as additional sources of continuum is still plausible, although the spatial distribution is still a problem. In summary, the apparent enhancement in (a low L/C ratio) along the central bar just southwest of Sgr A⋆ is still not fully explained.
4.3 Nature of the Recombination Line Emission
The flux density ratio between H41 and H92 lines is shown in Figure 8. The overall structure of the northern arm, the bar, western arc, and eastern arm is almost identical at both frequencies, and the line ratio is nearly constant, . This similarity is remarkable given the order of magnitude difference in the frequencies of these lines. A slightly higher ratio is seen along the western arc and toward the top where the western arc arches into the northern arm, suggesting brighter emission at centimeter wavelengths. This trend of comparatively brighter emission at longer wavelength was also noted in the comparison of H92 to Br ratios by Roberts & Goss (1993). Roberts & Goss offered extinction of Br emission by dust in the CND as a possible explanation, but a higher ratio would require a different explanation. Since the derived distribution is fairly constant (see Fig. 7 and Table 4), the enhanced ratio is not likely caused by any changes in the physical characteristics of the gas. The comparison of the total integrated H41 line flux with those of other transitions measured with the NRAO 12-m telescope suggest that some extended flux is missed by the interferometer (see § 3.4). The shortest baseline in the OVRO observations of 3100 is about 4 times larger than that for the VLA observations (830 ), and the greater missing flux in the OVRO data offers a plausible explanation for the apparent enhanced ratio along the western arc.
The analysis of the 92 GHz continuum (§3.1) and the H41 emission (§3.2) suggests high electron density ( cm-3) and low optical depth () for the ionized streamers. Under these conditions, both internal and external stimulated emission should be negligible, and optically thin spontaneous emission should dominate the recombination line emission at millimeter wavelengths. For the optically thin case near LTE, Eq. 3 implies that the velocity integrated line flux density should increase linearly with frequency since for thermal free-free emission.222Using slightly different assumptions, Seaquist et al. (1996) derive a relation showing in their Eq. A9. However, the factor, which they treated as a “constant” term going from their Eq. A8 to Eq. A9, actually behaves like (), and this too leads to a linear relation, . A plot of the velocity integrated line flux density for H31, H41, H44, and H92 lines is shown as a function of frequency shown in Figure 9, and indeed a nearly linear trend is seen. Excluding the H41 measurement from the OVRO (which is a lower limit because of the missing flux), a best fit power-law slope is , which is nearly exactly the theoretically expected value.
The assumption of “near LTE” is not strictly correct, however. A general expression for recombination line brightness in comparison to the LTE value is
| (4) |
where is the LTE line brightness, is the departure coefficient, is continuum optical depth, and is the effective line absorption coefficient accounting for non-LTE stimulated emission in the line. For the range of physical conditions we derive for the Sgr A West ( K, cm-3), the computed values of these parameters are 0.7-0.9 and (Brocklehurst, 1970; Walmsley, 1990). Although the non-LTE factor in the line absorption coefficient is large, it has little impact on the observed line brightness because a small optical depth (, as shown in § 3.1) makes the second term in Eq. 4 negligible, i.e. . The net effect is that the observed recombination line brightness is reduced by a factor of from the LTE value (i.e., ). The linear slope of the the observed power-law relation between the velocity integrated line flux density and frequency is unaffected as long as . As a result, the average flux density of the recombination line should increase linearly with frequency even when some non-LTE effects are present as long as spontaneous emission dominates the radiation process.
The comparison of the H41 and H92 spectra obtained toward Sgr A⋆ (Figure 10) offers a definitive proof that the narrow H92 line seen near km s-1 by Roberts & Goss (1993) is indeed stimulated emission. Citing the nonthermal nature of the Sgr A⋆ continuum emission and the low observed L/C ratio, Roberts & Goss suggested that this H92 emission must be stimulated emission arising from diffuse foreground ionized gas. The H92 spectrum (shown in dotted line) and the H41 spectrum (shown in solid line) have essentially identical shape at a position along the Northern Arm, 7″ offset to the east of Sgr A⋆, suggesting the same ionized gas is responsible for both spectral features. At the location of Sgr A⋆, however, H92 spectrum shows a distinct narrow component near km s-1, not seen in the H41 spectrum. As shown in Eq. 1, the optical depth for H41 line is expected to be more than 100 times smaller than the H92 line, and H41 is expected to be smaller by this large factor for optically thin stimulated emission.
4.4 Physical Link between Neutral and Ionized Gas
A review of the recent literature yields a coherent but complex picture for the composition, geometry, and kinematics of the neutral and ionized gas found in the central few parsec of our Galaxy. The CND, traced in HCO+ and HCN, has a ring-like morphology with an inner radius of about 30″ (1.25 pc) and an outer radius of at least 45-60″ (1.8-2.5 pc) and is physically and kinematically linked with a larger scale disk with an extent of 10 pc or more (Wright et al., 2001; McGary et al., 2001; Christopher et al., 2004). It may be made of a multi-phase medium as the estimates of gas temperature (50-250 K) and density ( cm-3 and cm-3 in dense clumps, see § 3.3) range widely (Marr et al., 1993; Jackson et al., 1993; Marshall et al., 1995; Latvakoski et al., 1999). Within it lies the “central cavity” which actually contains the ionized streamers Sgr A West, made of about 100 of cm-3 gas at K and as much as 1000 of neutral gas which is thought to be mostly atomic with cm-3 and T = 100-300 K (Genzel et al., 1985; Roberts & Goss, 1993; Jackson et al., 1993; Telesco et al., 1996; Latvakoski et al., 1999, and see § 3.3). By obtaining the most sensitive and the highest angular resolution images of H41, 92 GHz continuum, and HCO+ (1–0) to date simultaneously, we are able to shed some new light on the physical link between the neutral and ionized gas in this region.
The clearest demonstration of the physical connection between the neutral and ionized gas is the presence of recombination line peaks along the western arc, just inside of the dense gas clumps within the CND as shown by the overlay of the velocity integrated H41 and HCO+ images (see Figure 5). This radial offset between the ionized streamers and the molecular ring has been noted previously (Roberts & Goss, 1993), and it is consistent with the suggestion that the western arc is the ionized inner edge of the molecular ring directly exposed to a central ionizing source (Telesco et al., 1996). Evidence for a similar link between neutral and ionized gas is also seen on the eastern rim of the CND, between the eastern arm and the clump I shown in Figure 5. From their comparison of the 8 GHz radio continuum map and the 30 m optical depth map, Telesco et al. (1996) postulated that the eastern arm is the ionized front of a protrusion of high-density material facing the central ionizing source. The clump I identified in Figure 5 may indeed be this previously unseen high-density material, revealed for the first time. The extinction map derived from the HST/NICMOS P observations by Scoville et al. (2003) shows a hole in the obscuring material towards the northern arm and western arm, but high extinction regions with surround this hole, including the HCN clump corresponding to our clump I. Possible ionizing source candidates range from the putative central engine Sgr A⋆ to hot UV stars near the Galactic center (see discussion by Zhao et al., 1999). A more exotic possibility suggested by Maeda et al. (2002) is that the central source was much brighter in X-ray some 300 years ago as a result of the accretion of infalling material pushed in by the forward shocks from the supernova explosion in Sgr A East, leading to the ionization of the streamers.
A close physical link between the neutral gas in the CND and the ionized gas in Sgr A West is a widely occurring phenomenon, and this fact can be demonstrated more convincingly in the comparison of the channel maps as shown in Figure 3. Within the velocity ranges of km s-1, the bulk of H41 and HCO+ features trace the same rotation-like kinematics about Sgr A⋆. More importantly, the H41 features frequently occur just inside of the HCO+ features (see the 91, 39, and +65 km s-1 channels). As in the comparison of the velocity integrated images (Figure 5), this physical link is more evident along the western arc. There is a tendency for the H41 features to show an azimuthal offset from the HCO+ features, particularly for the features closer to Sgr A⋆ (e.g. V=39 and V=+65 km s-1 channels). These azimuthal offsets and a broad total line width ( km s-1) for the H41 line are naturally explained if the gas follows nearly Keplerian orbits around a highly concentrated mass distribution. (see the discussion in § 4.5).
4.5 Modeling Gas Kinematics in the CND
Constrained by excellent high spatial resolution imaging data in 12.8 m [Ne II] and radio recombination lines, several plausible and detailed dynamical models for the ionized streamers have been constructed (e.g. Sanders, 1998; Vollmer & Duschl, 2000). Models of gas kinematics for the CND have also been constructed, mostly to explain the features identified in low resolution images () that are susceptible to confusion with ubiquitous foreground and background emission (e.g. Liszt et al., 1985; Marshall et al., 1995). Taking advantage of the new high (and matched) resolution spectroscopic imaging data in H41 and HCO+, we can now examine in detail the gas kinematics and the gravitational potential in the central few parsec radius region in a self-consistent manner. We have already concluded that some of the ionized gas is orbiting Sgr A⋆ in the plane defined by the CND (see § 4.4). Using the velocity information, we can also isolate and examine other kinematic features proposed to be associated with the CND, such as the “+50 km s-1 streamer” and the “+70 km s-1 feature” (see Jackson et al., 1993).
If a massive central source (2.5-4.1 M⊙, Genzel & Eckart, 1999; Ghez et al., 2000, 2003) dominates the gravitational potential in the central parsec region, the kinematics of the surrounding gas disk should be regular and well behaved. The neutral and ionized gas inside the CND contributes only about 1000 while we estimate the total mass of the CND to be about (see § 4.4). The mass of the central stellar cluster is more substantial and is highly centrally concentrated, doubling the enclosed total mass near 2 pc radius (Genzel et al., 2003). We adopt a mass distribution of the form similar to Eq. 3 of Vollmer & Duschl (2002), after updating it using the most recent mass estimates of the massive central source by Ghez et al. (2003) and the dynamical mass estimates for the central 10 pc radius by Genzel et al. (2003),
| (5) |
where is radius in pc. The resulting Keplerian-like rotation of the gas disk nicely reproduces the observed features in the channel maps such as the azimuthal displacement for radially distinct features as discussed in § 4.4. To examine whether our interpretations of the gravitational potential, the geometry of the CND, and the relationship between the ionized streamers and the dense neutral gas in the CND are correct, we have created simulated channel maps of the CND using a Monte Carlo realization. They are shown side-by-side in comparison with the observed channel maps in Figure 11.
Using Matlab software package, we created a disk of 3000 particles with a radial distribution. The model disk has a radial extent from 0.1 pc to 2.5 pc and has a radially dependent thickness with an opening angle of . This particular disk geometry is adopted to allow a finite thickness which may play a role in the apparent gas distribution and kinematics in the projected view, but it is not motivated any particular observational constraints.333The only estimate found in the literature is by Latvakoski et al. (1999) of opening angle, based on their own morphological and dust heating model. The model disk is viewed with an inclination angle of 68∘ and is rotated by 60∘ in the sky plane to match the aspect ratio and the position angle of the CND. Each disk particle is in rotation about the central potential described by Eq. 5 and has a Gaussian random velocity component of 10 km s-1. To produce the model channel maps shown in Figure 11, model disk particles with the line-of-sight velocity matching the particular channel velocity window are selected, and their distribution is convolved with the observing beam (, PA). The only adjustment made to the model was adding +13 km s-1 to the systemic velocity in order to match the highest velocity HCO+ features at km s-1 and +143 km s-1.
Even though our model disk is constructed for an illustrative purpose only and is not tuned to match the observations in detail, the side-by-side comparisons of the model and data shown in Figure 11 offer significant insights on the gas distribution and kinematics:
(i) As noted already, some of the ionized gas traced in H41 is sharing the same orbital plane as the dense neutral gas in the CND (see §4.4). The model disk has no knowledge of temperature or ionization information, but presumably the inner part () of the disk is either atomic or ionized. The clumps of the H41 emission shown in contours on both panels in Figure 11 are frequently overlaying the model emission regions shown in grey-scale, especially in the channels with velocities between 91 km s-1. The northern arm is sometimes modeled as being displaced from the plane defined by the CND (e.g., Latvakoski et al., 1999), but a large fraction of the northern arm gas seen in the velocity range between 0 and +143 km s-1 closely follow our kinematical model.
(ii) The same comparison also shows that the gas in the eastern arm and the central bar do not follow the model. This leads us to believe that the ionized gas in the bar and the eastern arm is largely concentrated in a different orbital plane as suggested by others previously (e.g., Vollmer & Duschl, 2000).
(iii) The similarity between the observed HCO+ emission and the model disk emission is more striking. Except for the channels with km s-1 V km s-1 where foreground absorption has severely altered the appearance of the emission features, most of the HCO+ emission seen in the channel maps have matching features in the model. The HCO+ emission arising from the CND is frequently asymmetric about its major axis, unlike the model, and the CND is probably not a solid ring or a solid disk and is likely highly clumped. Two channels show substantial HCO+ emission not predicted by our model, and these channels correspond to velocities for the “+50 km s-1 streamer” and the “+70 km s-1 feature” that are already known to deviate from the CND rotation (see below).
The +50 km s-1 streamer is a band of emission running nearly east-west at a slightly oblique angle in the V = +39 km s-1 and V = +65 km s-1 channels, previously noted by Jackson et al. (1993) and others. This feature extends well beyond the field of view of the OVRO interferometer and is several arcmin in length in the single dish HCN (3–2) channel maps of Marshall et al. (1995). This is clearly a structure much larger than the CND in size, and thus the +50 km s-1 streamer is most likely a foreground or a background structure, not directly associated with the CND.
The +70 km s-1 streamer is the “7” shaped feature present in the V = +91 km s-1 channel. This structure is also seen in the single dish HCN (3–2) channel maps of Marshall et al. (1995), but it is more compact than the +50 km s-1 streamer. Although this may be a chance projection, this feature lies nearly exactly over the CND. However, its velocity differs from the CND rotation by about 130 km s-1. It is not as certain that the +70 km s-1 streamer is another foreground structure. Its long, linear appearance is suggestive of a large scale shock in origin. It is not seen in H41 or in continuum to offer any further clues, and the lack of any ionized gas at the corresponding velocity is an important argument against the +70 km s-1 streamer being part of the CND.
One of the key arguments against the CND being a coherent disk or a ring is the apparent gap along its eastern side in the previous HCN and HCO+ maps. This gap now appears filled with several compact gas clumps such as the clump I in our new HCO+ image shown in Figure 5. In addition, neutral gas with higher temperature and density also fills this gap as inferred by the observations of [C II] and NH3 (see Jackson et al., 1993; Herrnstein & Ho, 2002). Therefore earlier arguments based on the apparent morphology in the lower sensitivity HCN and HCO+ maps are no longer valid. The mean velocity of the warm molecular gas found by Herrnstein & Ho (their clump D) is slightly redshifted ( km s-1) than expected from our simple rotation model, but this velocity shift is in the correct sense if their average spectrum includes the emission from the entire north-south extent of their clump D.
In summary, we have successfully demonstrated the continuity in the distribution and kinematics of the ionized and the neutral gas within the central 3 pc diameter region surrounding Sgr A⋆ using our new observational data and a simple kinematical model. Our kinematical model reproduces many of the observed neutral and ionized gas features, as shown in Figure 11. The success of this simple model strengthens the notion that most of the gas found in the central parsec of Sgr A⋆ partake in a simple rotation around the central source within the disk plane defined by the CND. Our kinematical model also identifies very clearly which gas components do not follow this simple rotation. In addition, our model suggests that some of the subtle observed effects such as the slight asymmetry between the near and far side of the disk are the products of the finite size, asymmetric observing beam and projected viewing of the 3-D CND structure (e.g., see km s-1 channel). The overall picture of the gas distribution and kinematics in the central 3 pc surrounding Sgr A⋆ is not yet complete because information on the distribution and kinematics of atomic gas inside the CND is quite incomplete. Future arcsecond resolution imaging of dense atomic gas tracers such as [C II] will provide important clues for completing our understanding of the gaseous environment in this region.
5 SUMMARY
The OVRO millimeter array observations of the H41 and 92 GHz continuum emission from the ionized streamers around Sgr A⋆ (Sgr A West) and the HCO+ (1–0) emission from the circumnuclear disk (CND) are presented along with a new survey of the hydrogen recombination lines at millimeter wavelengths (H31, H41, and H44) obtained using the NRAO 12-m telescope. These observations are compared with the VLA H92 and the 8.3 GHz continuum data by Roberts & Goss (1993). We summarize our results as following:
1. The 92 GHz continuum image is essentially identical to the VLA continuum image at 8.3 GHz in morphology. The total continuum flux detected inside the 85″ diameter is about 12 Jy, but some extended flux associated with structure larger than about 30″ is missed. The brightest feature, Sgr A⋆, is unresolved at 3″ resolution of our observations and has a peak flux density of Jy beam-1. Assuming the 7000 K electron gas fills our 0.005 pc (1000 AU) beam, we infer average continuum optical depth of and electron density cm-3.
2. The kinematics and the morphology of H41 emission are very similar to those observed in H92 and 12.8 m [Ne II] lines. The brightest emission occurs along the north arm with a peak line brightness temperature of less than 10 K. This suggests a H41 optical depth of averaged over the 13 km s-1 channel width. The emission along the central bar displays a line-of-sight velocity ranging over 300 km s-1, and this gas may be located in the deepest part of the gravitational potential within the CND region.
3. The molecular CND is imaged in HCO+ with a 40% improvement in resolution and 4-15 times better sensitivity over the previous BIMA observations made in HCN and HCO+. The CND consists of several discrete concentrations, and their peak brightness ranging between 10 and 30 K averaged over the 0.1 pc synthesized beam suggests that they originate from the warm (60-100 K) gas responsible for NH3 and dust continuum emission in the CND. A virial analysis suggests that these clouds have mean density of cm-3, sufficient to withstand the tidal shear in the region, and the CND may be a long lived structure. We estimate a total gas mass of about for the CND. Our non-detection of HCO+ absorption along the Sgr A West places an upper limit to the gas column density of cm-2, or the neutral gas within the CND is depleted of molecules.
4. A line-to-continuum ratio analysis under the LTE assumption yields a fairly uniform electron temperature of about 7000 K along the ionized streamers in the Sgr A West complex, in an excellent agreement with the electron temperature calculated at 8.3 GHz using the H92 observations (Roberts & Goss, 1993). Evidence for increased (or an unusually low L/C ratio) along the central bar just southwest of Sgr A⋆ is found in our data as well even though our data include all line emission within km s-1. The low L/C ratio we find at 92 GHz challenges the optically thick continuum sources IRS 2 and IRS 13 as additional sources of continuum emission as suggested by Roberts, Yusef-Zadeh, & Goss (1996). Therefore, the elevated (a lower L/C ratio) seen near the location of IRS 2 and IRS 13 is still not fully understood.
5. A comparison of the velocity integrated line flux densities for H31, H41, H44, and H92 emission from the Sgr A West complex shows line ratios characteristic of spontaneous emission from optically thin gas near LTE. A detailed analysis reveals that observed recombination line brightness is reduced by 10-30% (i.e., ) from the LTE value.
6. A combined analysis of the new high resolution H41 and HCO+ images and a kinematic model clearly demonstrates a widely spread, close physical and dynamical link between the molecular gas in the CND and the ionized gas, including along the eastern rim where a gap in the CND was previously reported. The same analysis also clearly identifies several features that do not follow the disk rotation. We conclude that the “+50 km s-1 streamer” is not directly associated with the CND. The morphology of “+70 km s-1 streamer” is suggestive of its association with the CND, but its kinematics and absence of any ionized gas challenge the idea of their close association.
References
- Anantharamaiah et al. (1993) Anantharamaiah, K. R., Zhao, J., Goss, W. M., & Viallefond, F. 1993, ApJ, 419, 585
- Anantharamaiah et al. (2000) Anantharamaiah, K. R., Viallefond, F., Mohan, N. R., Goss, W. M., & Zhao, J. 2000, ApJ, 537, 613
- Brocklehurst (1970) Brocklehurst, M. 1970, MNRAS, 148, 417
- Brown et al. (1978) Brown, R. L., Lockman, F. J., & Knapp, G. R. 1978, ARA&A, 16, 445
- Christopher et al. (2004) Christopher, M. H., Scoville, N. Z., Stolovy, S. R., Yun, M. S. 2004, AJ, submitted.
- Cocker & Melia (1997) Cocker, R. F., & Melia, F. 1997, ApJ, 488, L149
- Coil & Ho (2000) Coil, A. L., & Ho, P. T. P. 2000, ApJ, 533, 245
- Genzel et al. (1985) Genzel, R., Watson, D. M., Crawford, M. K., & Townes 1985, ApJ, 297, 766
- Genzel & Eckart (1999) Genzel, R., & Eckart, A. 1999, in The Galactic Center Black Hole, The ASP Conference Series, Vol. 186, 3
- Genzel et al. (2000) Genzel, R., Pichon, C., Eckart, A., Gerhard, O. E., & Ott, T. 2000, MNRAS, 317, 348
- Genzel et al. (2003) Genzel, R., Schöedel, R., Ott, T., Eisenhauer, F., Hofmann, R. et al. 2003, ApJ, 594, 812
- Ghez et al. (2000) Ghez, A. M., Morris, M., Becklin, E. E., Tanner, A., & Kremenek, T. 2000, Nature, 407, 349
- Ghez et al. (2003) Ghez, A. M. et al. 2003, ApJ, 586, 127
- Gordon (1994) Gordon, M. A. 1994, ApJ, 421, 314
- Gordon & Walmsley (1990) Gordon, M. A., & Walmsley, C. M. 1990, ApJ, 365, 606
- Güsten et al. (1987) Güsten, R., Genzel, R., Wright, M. C. H. Wright, Jaffe, D., Stutzki, J., & Harris, A. I. 1987, ApJ, 318, 124
- Herrnstein & Ho (2002) Herrnstein, R. M., & Ho, P. T. P. 2002, ApJ, 579, L83
- Hogerheijde et al. (1995) Hogerheijde, M. R., de Geus, E. J., Spaans, M., van Langervelde, H. J., van Dishoeck, E. F. 1995, ApJ, 441, L93
- Jackson et al. (1993) Jackson, J. M., Geis, N., Genzel, R., Harris, A. I., Madden, S. et al. 1993, ApJ, 402, 173
- Kardashev (1959) Kardashev, N. S. 1959, Soviet Astr., 3, 813
- Lacy et al. (1980) Lacy, J. H., Towbes, C. H., Geballe, T. R., & Hollenbach, D. J. 1980, ApJ, 241, 132
- Latvakoski et al. (1999) Latvakoski, H. M., Stacy, G. J., Gull, G. E., & Hatward, T. L. 1999, ApJ, 511, 761
- Liszt et al. (1985) Liszt, H. S., Burton, W. B., van der Hulst, J. M. 1985, A&A, 142, 237
- Lutz et al. (1996) Lutz, D., Feuchtgruber, H., Genzel, R, Kunze, D., Rigopoulou, D. et al. 1996, A&A, 315, L269
- Maeda et al. (2002) Maeda, Y., Baganoff, F. K., Feigelson, E. D., Morris, M., Bautz, M. W., Brandt, W. N., Burrows, D. N., Doty, J. P., Garmire, G. P., Pravdo, S. H. et al. 2002, ApJ, 570, 671
- Mangum (2000) Mangum, J. G. 2000, in User’s Manual for the NRAO 12 Meter Millimeter-Wave Telescope
- Marr et al. (1992) Marr, J. M., Rudolph, A. L., Pauls, T. A., Wright, M. C. H., & Backer, D. C. 1992, ApJL, 400, L29
- Marr et al. (1993) Marr, J. M., Wright, M. C. H., & Becker, D. C. 1993, ApJ, 411, 667
- Marshall et al. (1995) Marshall, J., Lesenby, A. N., & Harris, A. I. 1995, MNRAS, 277, 594
- Martin et al. (1994) Martin-Pintado, J., Neri, R., Planesas, P., & Bachiller, R. 1994, A&A, 286, 890
- McGary et al. (2001) McGary, R. S, Coil, A. L., Ho, P. T. P. 2001, ApJ, 559, 326
- Mohan et al. (2001) Mohan, N. R., Anantharamaiah, K. R., & W. M. Goss 2001, ApJ, 557, 659
- Morris & Serabyn (1996) Morris, M., & Serabyn, E. 1996, ARAA, 34, 645
- Pearson et al. (1994) Pearson, T. J., Shepherd, M. C., Taylor, G. B., & Myers, S. T. 1994, BAAS, 185.0808
- Puxley et al. (1997) Puxley, P. J., Mountain, C. M., Brand, P. W. J. L., Moore, T. J. T., & Nakai, N. 1997, ApJ, 485, 143
- Reid (1989) Reid, M. J. 1989, in The Distance to the Galactic Center, IAU Symp. 136 (Kluwer Academic Publishers, Dordrecht) p.37
- Roberts et al. (1991) Roberts, D. A., Goss, W. M., van Gorkom, J. H., & Leahy, J. P. 1991, ApJ, 366, L15
- Roberts & Goss (1993) Roberts, D. A., & Goss, W. M. 1993, ApJS, 86, 133
- Roberts, Yusef-Zadeh, & Goss (1996) Roberts, D. A., Yusef-Zadeh, F., & Goss, W. M. 1996, ApJ, 459, 627
- Sanders (1998) Sanders, R. H. 1998, MNRAS, 294, 35
- Schöedel et al. (2003) Schöedel, R., Ott, T., Genzel, R., Eckart, A., Mouawad, N., Alexander, T. 2003, ApJ, 596, 1015
- Schwarz et al. (1989) Schwarz, U. J., Bregman, J. D., & van Gorkom, J. H. 1989, A&A, 215, 33
- Scoville et al. (1993) Scoville, N. Z., Carlstrom, J. E., Chandler, C. J., Phillips, J. A., Scott, S. L., Tilanus, R. P. J., & Wang, Z. 1993, PASP, 105, 1482
- Scoville et al. (2003) Scoville, N. Z., Stolovy, S. R., Rieke, M., Christopher, M., & Yusef-Zadeh, F. 2003, ApJ, 594, 294
- Seaquist et al. (1994) Seaquist, E. R., Kerton, C. R., & Bell, M. B. 1994, ApJ, 429, 612
- Seaquist et al. (1996) Seaquist, E. R., Carlstrom, J. E., Byrant, & Bell, M. B. 1996, ApJ, 465, 691
- Serabyn & Lacy (1985) Serabyn, E., & Lacy, J. H. 1985, ApJ, 293, 445
- Serabyn et al. (1988) Serabyn, E., Lacy, J. H., Townes, C. H., & Bharat, R. 1988, ApJ, 326, 171
- Serabyn et al. (1997) Serabyn, E., Carlstrom, J., Lay, O., Lis, D. C., Hunter, T. R., Lacy, J. H., & Hills, R. E. 1997, ApJ, 490, 177
- Sternberg & Dalgarno (1989) Sternberg, A., Dalgarno, A. 1989, ApJ, 338, 197
- Telesco et al. (1996) Telesco, C. M., Davidson, J. A., & Werner, M. W. 1996, ApJ, 456, 541
- Tsuboi et al. (1999) Tsuboi, M., Handa, T., & Ukita, N. 1999, ApJS, 120, 1
- Vollmer & Duschl (2000) Vollmer, B., & Duschl, W. 2000, New Astronomy, 4, 581
- Vollmer & Duschl (2002) Vollmer, B., & Duschl, W. 2002, A&A, 388, 128
- Walmsley (1990) Walmsley, C. M. 1990, A&AS, 82, 201
- Wright & Backer (1993) Wright, M. C. H., & Backer, D. C. 1993, ApJ, 417, 560
- Wright et al. (2001) Wright, M. C. H., Coil, A. L., McGary, R. S., Ho, P. T. P., & Harris, A. I. 2001, ApJ, 551, 254
- Yun et al. (2003) Yun, M. S., Scoville, N. Z., Shukla, H. 2003, in The Neutral ISM in Starburst Galaxies, ASP Conference Series, in press
- Yusef-Zadeh et al. (1990) Yusef-Zadeh, F., Morris, M., Ekers, R. D. 1990, Nature, 348, 45
- Yusef-Zadeh et al. (2000) Yusef-Zadeh, F., Melia, F., & Wardle, M. 2000, Science, 287, 85
- Zhao et al. (1996) Zhao, J., Anantharamaiah, K. R. Goss, W. M., & Villefond, F. 1996, ApJ, 472, 54
- Zhao et al. (1999) Zhao, J., & Goss, W. M. 1999, ASP Conf. Series, 186, 224


| Rest Frequency of H41 line | 92.034 GHz |
|---|---|
| Rest Frequency of HCO line | 89.188 GHz |
| Primary beam (HPBW) | 85 |
| Phase center | |
| Center LSR velocity | 0.0 km s-1 |
| Synthesized beam (HPBW) | (PA) |
| Spectrometer settings | MHz (13 km s-1) |
| RMS noise | 0.13 Jy beam-1 (0.21 K) |
| Feature | Size | |||
|---|---|---|---|---|
| (pc) | (Jy Beam-1) | (K) | (Jy) | |
| Northern Arm | 0.9 | |||
| Sgr A⋆ | 0.1 | |||
| Bar | 1.1 | |||
| Western Arc | 1.5 | |||
| Eastern Arm | 0.4 |
| Region | Size | |||
|---|---|---|---|---|
| (pc) | (Jy Beam-1) | (K) | (Jy) | |
| Northern Arm | 0.9 | |||
| Bar | 1.1 | |||
| Western Arc | 1.5 | |||
| Eastern Arm | 0.4 |
| Region | Box Center | / | Temperature | ||
|---|---|---|---|---|---|
| (J2000) | (km s-1) | (km s-1) | (K) | ||
| 1 | 78 5 | 0.50 0.04 | 6394608 | ||
| 2 | 213 18 | 0.18 0.02 | 6473891 | ||
| 3 | 43 5 | 0.80 0.13 | 74701372 | ||
| 4 | 347 48 | 0.03 0.01 | 188064770 | ||
| 5 | 70 5 | 0.66 0.07 | 5528623 | ||
| 6 | 101 6 | 0.26 0.02 | 9057825 |
| Clump | Size | |||||
|---|---|---|---|---|---|---|
| (pc) | (Jy Beam-1) | (K) | ( km s-1) | (M⊙) | (cm-3) | |
| A | 0.4 | 20.7 | 2.1 | |||
| B | 0.3 | 17.3 | 1.1 | |||
| C | 0.3 | 12.0 | 0.5 | |||
| D | 0.4 | 29.9 | 4.5 | |||
| E | 0.2 | 11.6 | 0.3 | |||
| F | 0.3 | 19.4 | 1.4 | |||
| G | 0.6 | 16.1 | 1.9 | |||
| H | 0.4 | 19.0 | 1.8 | |||
| I | 0.2 | 13.0 | 0.4 |
| Line | ||
|---|---|---|
| (GHz) | (Jy km s-1) | |
| H31 | 210.502 | |
| H35 | 146.969 | – |
| H41 | 92.034 | – |
| H44 | 74.645 | |
| H92 | 8.309 |