Planetary Nebulae Kinematics in M31
Abstract
We present kinematics of 135 planetary nebulae in M31 from a survey covering 3.9 deg2 and extending out to 15 kpc from the southwest major axis and more than 20 kpc along the minor axis. The majority of our sample, even well outside the disk, shows significant rotational support (mean line-of-sight velocity 116 km/s). We argue that these PN belong to the outer part of M31’s large bulge. Only five PN have velocities clearly inconsistent with this fast rotating bulge. All five may belong to tidal streams in M31’s outer halo. One is projected on the Northern Spur, and is counter-rotating with respect to the disk there. Two are projected near the major axis at kpc and have M32-like velocities; they could be debris from that galaxy. The remaining two halo PN are located near the center of the galaxy and their velocities follow the gradient found by Ibata et al. (2004), implying that these PN could belong to the Southern Stream. If M31 has a non-rotating, pressure-supported halo, we have yet to find it, and it must be a very minor component of the galaxy.
1 Introduction
The wealth of information resulting from highly detailed studies of the old stellar populations of the Galaxy (Eggen, Lynden-Bell, & Sandage, 1962; Searle & Zinn, 1978; Gilmore & Reid, 1983; Edvardsson et al., 1993) have been a catalyst for theories of galaxy evolution; as the nearest large galaxy to us, M31 is a proving ground for those theories. M31 offers a variety of stellar populations in a galaxy of earlier Hubble type, providing important leverage in testing formation scenarios. Especially important are the faint, old populations of the halo, which have proven difficult to study directly in more distant galaxies (Morrison, 1999; Zepf et al., 2000). Halos contain the first stars, and the ages and abundances of these stars reflect the properties of the protogalactic fragments that are the building blocks of galaxies (e.g. Oey, 2000). The kinematics of halo populations tells us about the dynamical evolution of the galaxy, and provide constraints on hierarchical formation theories (Helmi et al., 1999; Ivezić et al., 2000; Yanny et al., 2000; Dohm-Palmer et al., 2001).
How can we describe M31’s old populations? What can their properties tell us about how M31 formed and evolved? The old stellar populations in the Milky Way have often been used as a guide to these populations in other disk galaxies because of the richness of spatial and velocity data for the Milky Way. In the Milky Way, the metal-poor, old stars of the halo dominate a few kpc away from the plane and the galactic center. The field stars and globular clusters have a power-law density profile (Zinn, 1985; Saha, 1985; Ivezić et al., 2000) and pressure-supported kinematics with little or no rotation (also see Beers et al., 2000, for a recent summary of halo kinematics in the Milky Way).
This density profile differs from that of M31’s spheroid, which has an profile extending unchanged for a remarkably large distance along the minor axis (20 kpc, Pritchet & van den Bergh 1994; hereafter PvdB; 30 kpc, Durrell, Harris, & Pritchet 2004). Color-magnitude diagram studies of red giants have shown that, although there is a weak (10–20%) metal-poor component, the dominant stellar population at these halo-like distances is about 1 dex more metal-rich than its Milky Way counterpart, or than the M31 globular clusters at the same radius (Mould & Kristian, 1986; Durrell, Harris, & Pritchet, 1994; Couture et al., 1995; Rich et al., 1996; Durrell, Harris, & Pritchet, 2001). This led Mould (1986) and Freeman (1996) to suggest that the bulge dominates even at these very large distances from the galactic center.
The Milky Way’s bulge is quite different. It is less luminous and its inner 1-2 kpc are dominated by a bar, which has a vertical exponential distribution with scale height of around 350 pc (Weiland et al., 1994). Small bulges like the Milky Way’s may have formed by secular processes involving central bars (Pfenniger & Norman, 1990; Courteau et al., 1996), tying the evolution of the bulge to the disk. M31’s bulge is too large to have formed by this mechanism.
The question of the difference between a large bulge with moderate rotational support and a non-rotating halo is not just one of taxonomy: the formation processes of these two populations are quite different. A kinematically hot, non-rotating stellar halo is most simply formed after the aggregation of the galaxy’s dark halo — this explains the lack of correlation between the angular momenta of the halo and the disk (Freeman, 1996). This scenario is supported by growing evidence that the Milky Way halo was populated, at least in part, by the accretion and destruction of small satellites (Majewski, Munn, & Hawley, 1994; Helmi et al., 1999; Ivezić et al., 2000; Yanny et al., 2000; Dohm-Palmer et al., 2001). The Sgr dwarf (Ibata, Gilmore, & Irwin 1994) and its tidal streams give a present-day example of this process.
But the accretion history of the Milky Way may be dramatically different from that of a galaxy of earlier Hubble type like M31. An profile is a result of violent relaxation such as occurs, for example, in major mergers. We note that both accretion and merging involve interaction between galaxies, but the mass ratios are very different: in the merger which forms an law profile, the mass ratio is at most a few to one, while the mass ratio for the accretion of small satellites to form a hot halo is more typically 100:1 or more. As a result, major mergers have a strong effect on the galaxy disk while the accretions have almost none.
Does M31 actually have a kinematically hot halo? If so, how much luminosity does it contribute? Accurate kinematic data for halo objects are needed to quantify the relative importance of this process in populating the outer regions of M31. However, the difficulty in isolating the halo from the bulge and in obtaining accurate velocities for halo populations has precluded a definitive answer to these questions. Spectroscopy of single field stars in M31 is very challenging, even for giant-branch tip stars using Keck, as samples are dominated by contamination by foreground stars from the Milky Way (Reitzel, Guhathakurta, & Gould 1998; Reitzel & Guhathakurta 2002).
Globular clusters have been the halo tracer of choice thus far, but present several difficulties. Cluster velocities derive from absorption spectra, and accurate velocities (errors 20 km/s) are only now becoming available (Perrett et al. 2002; P. Seitzer 2002, private communication). Thus, early studies of M31 cluster kinematics concluded that its halo had little rotation (Huchra, Brodie, & Kent, 1991; Huchra, 1993), while more recent studies find greater rotational support (Perrett et al., 2002). In the Milky Way, the field stars and globular clusters share a similar metallicity distribution (Zinn, 1985; Laird et al., 1988; Ryan & Norris, 1991) and ”hot” kinematics (Norris, 1986; Beers et al., 2000). However, in M31, the abundance distribution of the clusters and the field stars at similar radii are quite different; the clusters are more metal-poor in the mean than the field stars (Durrell et al. 2001; Barmby et al. 2000). Because cluster metallicities differ, cluster kinematics also may not be entirely representative of the stellar halo properties.
Planetary nebulae (PN), in contrast, trace stellar populations with ages 1–10 Gyr and readily give accurate velocities with 4m-class telescopes, because almost all their energy output is concentrated in a few emission lines. The techniques for detecting PN have been well-documented by G. Jacoby and collaborators (Jacoby et al., 1989). PN have been used extensively as kinematic tracers in normal ellipticals (Hui et al., 1995; Arnaboldi et al., 1996; Méndez et al., 2001), and in the luminous members of the Local Group (Nolthenius & Ford, 1986, 1987). Nolthenius & Ford (1987, hereafter NF87) presented kinematics of 37 M31 planetary nebulae, with distances along the major axis of up to 40 kpc and distances from the major axis of up to 17 kpc. Although it is possible to identify the signatures of disk and bulge in their data and find a few objects with clear halo kinematics, the small size of their sample precludes strong conclusions.
Here we present the results of a kinematic survey of 135 PN in one quadrant of M31’s outer bulge/halo. The survey extends to 20 kpc along the minor axis, well into the canonical halo regions of M31, and 20 kpc along the southwest major axis. We have used both the spatial and kinematic information for the PN to distinguish the bulge population from the halo population. With this larger number of PN and the accurate velocities (errors of 5–10 km/s) resulting from the follow-up Hydra spectroscopy, we have a clearer picture of M31’s spheroid. Using the Milky Way as a guide, we expected to find only a small degree of rotational support in the populations far from the major axis, similar to the Milky Way’s stellar halo. Instead, we find that the bulge dominates out to the limits of our survey, and that very few objects belong to a non-rotating, pressure-supported halo like the Milky Way’s.
In Section 2 we describe the survey which identified our PNe and the spectroscopic follow-up to obtain velocities. In Section 3 we present the PN kinematics and discuss the spatial and kinematic signatures of the thin disk, halo and bulge in M31 with relation to these results, concluding that a thin disk and a dominant bulge best explain our data. In Section 4, we interpret the kinematics in the context of formation scenarios for these populations.
2 Observations
2.1 PN Detection and Photometry
Our PN detection relies on the fact that PN have a very strong OIII emission line at 5007and relatively little continuum emission. Distant PN can therefore be detected via narrow-band imaging at 5007. Exposures at a nearby but offset wavelength can be used to discriminate PN from stars.
Imaging of M31 was carried out at the CWRU Burrell Schmidt on the nights of 23-30 September 2000. The camera at the Schmidt has a SITe 2K4K back-illuminated CCD with 15 micron pixels and a pixel scale of ″/pixel. It covers a 40′(E-W) 80′(N-S) field. The readnoise during the Schmidt imaging run was and the gain was /ADU. The seeing (2–2.5″) was typical for the Schmidt.

The choice of filter depends on several factors, and some issues regarding filters are discussed in Jacoby et al. (1992). The [OIII] 5007 filter should be narrow enough to minimize the sky contribution, yet wide enough to accommodate the potentially large range of velocities. It should also be well-matched to the observed wavelength of the [OIII] 5007 emission line. M31’s systemic velocity is –300 km/s (de Vaucouleurs et al., 1991), so that the [OIII] 5007 line is shifted blueward to 5002Å. A blueward shift of 13 Å in the filter response results from the Burrell Schmidt’s f/3.5 beam (this accounts for a shift of 10Å), and the temperature difference between the lab where the filter response curve published by NOAO was measured and the observing conditions (Å). For Fields 1 and 2, we used filter KP1590 with = 5022 Å and for Field 3, filter KP1467 with = 5008 Å.
The filter transmission for a velocity of 400 km/s with respect to M31’s systemic velocity (the likely worst case) is 70% in all cases (Figure 1). We note that the filter used for Field 3 has a 15% gradient across the velocities of interest. Detection of disk PN is unaffected, as the field is located on the approaching side of the galaxy and the emission is blueshifted into the higher sensitivity region of the transmission curve. Also, the gradient across disk velocities will be negligible due to the relatively low dispersion of disk PN (100 km/s). Detection of halo objects may have been slightly biased against those with velocities more than 200 km/s greater than the systemic velocity in that field. Although we have not quantified this effect, it would not alter our final conclusions.
We placed our fields to sample halo PN and to measure their rotation. Fields 1 and 2 lie along the minor axis of M31, and Field 3 covers a region at larger radius which includes the major axis. Figure 2 shows their placement on an image of M31 kindly provided by Rene Walterbos. Field 1 was observed under photometric conditions; Fields 2 and 3 were observed during periods of thin cirrus and occasional heavy cloud. Fortunately, these observations are still usable because the focus of this project is the PN velocities rather than the photometry. We followed standard image reduction procedures. The images were bias-subtracted and flatfielded, and then registered using bright stars in the field. We averaged them using IRAF111IRAF is distributed by the National Optical Astronomy Observatories, which is operated by the Association of Universities for Research in Astronomy, Inc. (AURA) under cooperative agreement with the National Science Foundation. imcombine with ccdclip rejection.
Because we were primarily interested in the kinematics of the halo and populations, we wanted to exclude HII regions from our sample as much as possible, as they belong to the young, thin disk. The geometry discussed in Section 3.1.1 shows that HII regions confined to the disk should be rare more than about 3 kpc from the major axis. Therefore, we limited our selection of PN from the Schmidt data to those more than 3 kpc from the major axis near the center of the galaxy. At larger radius, where the background light from the disk was fainter, it was easier to distinguish point-like PN from more extended HII regions and we allowed the sample to extend to the major axis. Jacoby, Ford & Hui kindly shared positions for some of the objects from their earlier survey of the M31 disk and bulge (Hui, Ford, & Jacoby, 1994). During the follow-up spectroscopy run, we assigned spare fibers to these objects, some of which are nearer the center than the Schmidt sample.
To identify PN candidates, we generally followed the procedure outlined by other PN studies such as Ciardullo et al. (1989). For our project, however, it was not possible to perform photometry on a difference of the on-band image and the appropriately scaled off-band image. This is because the PSF varies across the field of view of the Schmidt – due to the curved focal plane – and depends sensitively on the seeing and focus. Large residuals on the difference image would lead to many false detections. Instead, we used DoPHOT (Schechter, Mateo, & Saha, 1993) on the combined on- and off-band images separately and matched the resulting object lists. We then matched the position of objects in the on-band image with objects in the off-band image within a 2 pixel radius. Objects in the on-band image which had no counterpart in the off-band object list were classified as PN candidates.
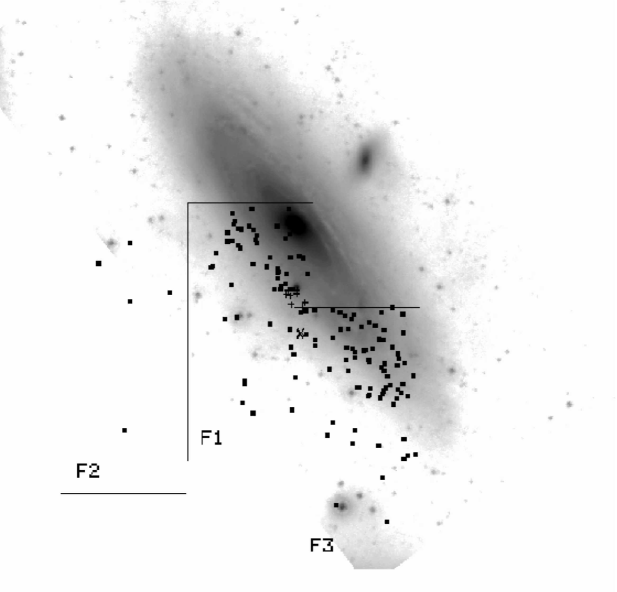
All candidates were visually verified. To be included in our list of spectroscopic targets, a point-source in the on-band image should have no discernible flux at the same position in the off band image. Faint candidates were also required to have at least some signal present in each of the four exposures taken under the most transparent conditions. We ranked the PN candidates by the degree to which they satisfied all the criteria. As we will discuss below, of our first priority PN candidates were confirmed spectroscopically, validating our selection criteria. Figure 3 shows the PN luminosity functions for confirmed PN in Fields 1 and 3. The rough calibration is based only on assigning the brightest PN to = –4.5 (Ciardullo et al., 1989). We reached basically to equal depths of 1.5–2 magnitudes down the PN luminosity function in these two fields. There were only 5 objects in Field 2, and their photometry is consistent with the other two fields.
2.2 Astrometry
The WIYN222The WIYN Observatory is a joint facility of the University of Wisconsin-Madison, Indiana University, Yale University, and the National Optical Astronomy Observatory. Hydra fiber spectroscopy of these candidates requires positions accurate to better than 1″. We identified astrometric standards from the USNO-A 2.0 astrometric catalog (Monet et al., 1998) in each of our three fields. From these reference stars, we computed the transformation between the DoPHOT coordinates and the celestial coordinate system using the tfinder and ccmap packages in IRAF. With reference stars in each field and the high accuracy of the catalog positions, an accurate transformation was possible even over the large field of the Schmidt. The rms error in the calculated positions was less than 0.3 ″ in all fields.
2.3 Spectroscopy
The spectroscopic observations were obtained with the WIYN Hydra fiber spectrograph on the night of 7 September 2001. The conditions were clear with good seeing, and we were able to obtain spectra for all of our candidates. For the instrument configuration, we used the red fiber set with the 600 lines/mm grating in first order. This provided a wavelength range from 4800 to 6800 Å, a dispersion of 1.4 Å per pixel, and a resolution of 2.9 Å.
The three Schmidt fields were divided into 6 separate Hydra fiber setups. For each setup, we took a series of four 600s exposures and a Copper-Argon (Cu-Ar) lamp exposure. At the beginning of the night, we took a series of dome lamp flatfield exposures at a neutral position. More accurate flatfielding was unnecessary, as the PN in our sample are relatively bright and we are only interested in velocities. The spectra were overscan subtracted, trimmed and bias subtracted via standard IRAF routines. The individual fiber spectra were extracted using the fiber apertures determined from the dome flats. We then coadded spectra from the individual exposures to make the single deep spectrum for each object.

Highly accurate velocities depend upon careful wavelength calibration of the spectra. We used the adjacent Cu-Ar lamp exposure for each setup to wavelength calibrate the individual spectra. A fifth order Legendre function was used to fit 60–70 lines in the Cu-Ar spectrum to determine the spectral solution. The rms error in the fits was always less than 0.2 Å, or 10 km/s. The bench-mounted spectrograph minimizes the spectral shift. We confirmed this by cross-correlating the comparison lamp spectra from different pointings, and found that the spectra shifted by less than 0.05 Å over the course of the night. Figure 4 shows three typical spectra from our sample.
Unlike studies of PN kinematics in distant galaxies where only [OIII] 5007 is detected (e.g. Hui et al., 1995; Arnaboldi et al., 1998; Méndez et al., 2001), the proximity of M31 PN allows us to easily detect 5007 and 4959 in nearly all of our candidates, and H in most. Local Group PN studies which have used all three lines independently (e.g. Nolthenius & Ford 1987; Ford, Jacoby, & Jenner 1977) have found that they lead to systematically different velocities. We opt instead to use all three lines simultaneously, thus improving the accuracy of our derived radial velocities.
We used the rv package in IRAF to derive radial velocities using the cross-correlation of the object spectra with a template. Initially we created an artificial PN spectrum to serve as the template spectrum (three lines matched to the instrumental PSF at 5007, 4959, and H), but found that we were able to reduce the internal velocity errors significantly by using a spectrum created by combining real PN spectra as a template. We selected the 8 highest signal-to-noise spectra from the PN in the first pointing. After continuum-subtracting them, we shifted them to zero velocity by fitting a Gaussian to the 5007 line profile. The final template was created by coadding these 8 spectra. The radial velocities are derived by calculating the cross-correlation function of the template and continuum-subtracted PN spectra in the spectral region including 5007, 4959, and H, using fxcor in IRAF. In general, we did not sky subtract the PN spectra as there were no significant sky lines or stellar absorption lines in this spectral region. The resulting radial velocities and errors are listed in Table 1.
2.4 Velocity Errors
All the PN were observed on the same night with the same instrument, making systematic differences within the PN sample highly unlikely. We observed 11 PN from our sample in multiple pointings. The mean difference in velocity for these PN is –1.2 km/s with a standard deviation of 4 km/s. These results are consistent with the typical internal velocity error estimates from fxcor of 3–7 km/s. We estimate an additional 5 km/s of error in the velocities due to systematics effects.

There have been several earlier studies of emission-line objects in or near M31, and this allows us to assess the systematic error in our velocities. We have spectra for three HII regions in the dwarf galaxy And IV (objects 3, 4 and 6 from Ferguson, Gallagher, & Wyse 2000). The velocities for objects 4 and 6 agree within 5 km/s (250 5.2 and 270.8 39.2, respectively compared to 250 and 273 km/s from Ferguson et al. (2000). For object 3, we find a velocity of km/s compared to 244 km/s, a difference of 11 km/s. Our sample and that of NF have 11 PN in common. The mean difference is 10.4 km/s. This is the same systematic difference that NF87 note between their velocities and those of Ford et al. (1977) for the Galactic PN velocity standards used in the two studies. Given the good agreement between our velocities and those of Ferguson et al. (2000), and the disagreement between the NF87 and Ford et al. (1977) velocities, we conclude that there is a systematic offset in the NF87 velocities. In the remaining discussion, we have offset their velocities by +10.4 km/s to agree with ours.
3 Results
3.1 Overview of PN Kinematics
Although M31 is the primary target of our survey, M32 and the dwarf galaxy And IV are also located in the survey region. Membership for several objects is ambiguous and was decided based on position and velocity.
The three emission line objects we identified in And IV are HII regions, resolved in HST images (Ferguson et al., 2000). Although PN commonly have [OIII]/H, values nearer to 1 are possible, so that for PN and high-excitation HII regions overlap significantly. This ambiguity prevents distinguishing PN from HII regions solely with our spectra; such a distinction requires nebular modelling which relies on faint lines beyond our wavelength range. The inclusion of the And IV HII regions in our sample raises the question of substantial numbers of M31 HII regions in the sample. However, this is unlikely for several reasons. The And IV HII region spectra have 1/3, much less than the rest of our sample. And IV is significantly more distant than M31 (5 Mpc; Ferguson et al. 2000). Bright M31 HII regions are more likely to be resolved, and we considered only point sources as candidates. Also, though the value of ranged from 1–3 (excluding the And IV HII regions), objects with values as low as 1 are rare in our sample (10%). With this in mind, we refer to the emission line objects in M31 as PN throughout the rest of the discussion.
M32 PN are clumped in position and in velocity near M32’s radial velocity of –197 km/s (Huchra et al., 1999). For M32, 50 km/s and the tidal radius is kpc (Mateo, 1998). Nine PN in the sample have velocities within 50 km/s of M32’s systemic velocity and are located within 1 kpc of M32’s center. PN membership is summarized in Tables 1, 2 and 3. Each table lists the positions and heliocentric radial velocities for the emission line objects in M31, M32 and And IV, respectively. We have excluded M32 and And IV objects from the analysis that follows.
The positions of the PN relative to the center of M31 are shown in Figure 5. We have assumed a distance of 770 kpc to M31 (Freedman & Madore, 1990). is distance in the major axis direction, and is the distance in the minor axis direction. The positions have been rotated through M31’s position angle ( de Vaucouleurs, 1958) so that the major axis defines . All velocities are plotted relative to M31’s systemic velocity and coded by symbol size. We have enlarged our sample of PN by adding the objects from NF87 which are not already in our sample.

The depth and spatial sampling of the survey is not uniform and must be taken into account when interpreting the spatial distribution of the PN. Only Field 3 intersects the major axis (compare Figure 2 and Figure 5). Fields 1 and 2 had a sizable gap between them and this can be seen in Figure 5 around kpc. Fields 1 and 3 are of comparable depth, while Field 2 is shallower. Finally, the objects nearest the center of the galaxy, where we did not attempt to identify PN in the Schmidt images, are PN from the sample of Hui, Ford, & Jacoby (1994) used to fill spare fibers, as mentioned previously.
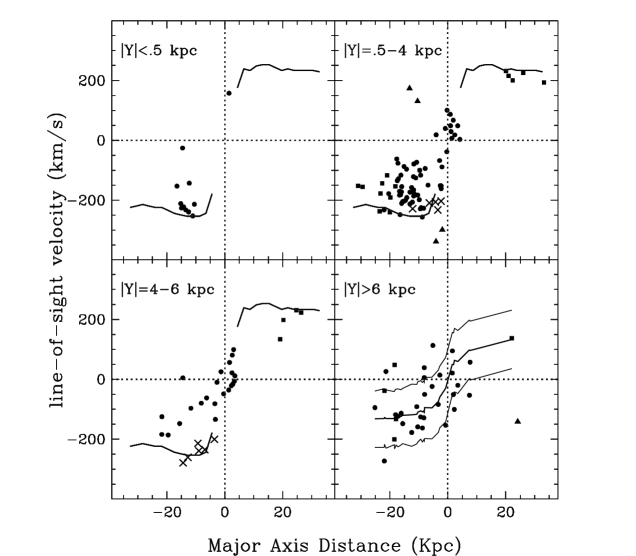
The various populations in M31 can be isolated by splitting the sample in . Figure 6 shows plots of distance along the major axis vs. the line-of-sight velocity for several ranges of . The disk dominates at kpc, where the upper limit on the PN velocities is the HI rotation curve (Kent, 1989). A mixture of disk and bulge objects are seen at kpc. Bulge PN near the minor axis of the galaxy have velocities of –150 to 150 km/s relative to M31’s systemic velocity, consistent with the large bulge central velocity dispersion of 100–150 km/s (McElroy, 1983; Richstone & Shectman, 1980). Some of the highest velocity objects in this region (crosses) may be associated with the newly discovered satellite And VIII (Morrison et al., 2003b). We expect to find bulge and halo objects at kpc. We discuss the distinction between these regions further in Section 3.2.
A striking feature of Figure 6 is the very small number of PN occupying the “forbidden” quadrants for disk objects, even at large . This lack of objects in the two non-disk quadrants is the signature of a rotationally supported population, which clearly dominates our sample.
Disentangling the various stellar populations in M31 is complicated by the galaxy’s inclination ( from face-on) which causes objects in the outer disk to appear in projection away from the major axis. Disk, bulge and halo populations therefore overlap spatially and kinematically. The combination of position and velocity data, however, offers the potential to isolate the different populations. The allowed velocities for a given PN position will depend on the kinematic population to which it belongs. In the discussion that follows, we present an overview of the expected spatial and kinematic signatures of the disk and bulge, then use simple kinematic models to distinguish between them, as well as identify halo candidates. We adopt the following definitions: and are the observed, line-of-sight velocity and dispersion, respectively; for a given population, is the rotation velocity and is the radial velocity dispersion; is the circular velocity of the disk, which reflects the mass distribution, and which we take to be the HI , roughly 250 km/s.
3.2 M31’s Inclined Disk
3.2.1 Spatial Extent of the Disk
The spatial signature of the disk will depend on the size and thickness of the disk, as well as the degree of warping and the radius at which the warp begins. However, we can draw some simple conclusions from basic geometry. The radial extent of the optical stellar disk was estimated by WK88 to be 26 kpc. There are now two very deep star count images that can be used to check this result, from Ferguson et al. (2002)and Zucker et al. (2004). These images reach to of order 30 V mag/arcsec2, and are thus very sensitive tests for the extent of the disk. In both images it can be seen that the brighter portions of the outer disk extend to the WK88 value, there are some fainter regions which extend to R=35 kpc and may be associated with tidal streams or with the outer disk, and that there is no starlight beyond 35 kpc to very sensitive limits. We have thus assumed =26 kpc and consider the effect of a larger when relevant in the discussion that follows.
If the disk were planar and non-warped, its edge would project to a distance of 5.6 kpc from the major axis because of M31’s inclination. Near the minor axis, the disk and bulge contribute roughly equally to the luminosity from 2–5 kpc (see Figure 3 of WK88). We can therefore expect the bulge and halo PN to dominate beyond 5 kpc from the major axis. These rough geometrical arguments are supported by observations. On the side of the major axis covered by our survey, the outer optical isophotes of the galaxy ( ) extend 4.4 to 6.6 kpc (20–30 arcmin) from the major axis (WK88); HII regions are found up to 4 kpc (Pellet et al., 1978).
However, the assumption of a perfectly planar disk is not justified. Neutral hydrogen studies (Roberts & Whitehurst, 1975; Cram, Roberts, & Whitehurst, 1980; Brinks & Shane, 1984) have found two distinct velocity systems for many lines of sight through M31’s disk. This suggests that the line of sight is crossing the disk twice. Brinks & Burton (1984) interpreted the dual kinematics as a warp signature. In their model, the geometry of the galaxy is such that the line of nodes is nearly aligned with the major axis and the warp bends over back toward the major axis on the near (NW) side, so that the warp is nearly edge-on (Brinks & Burton, 1984, Figure 2a). The unwarped HI has a radius of 16 kpc, which would project to a height of 4 kpc from the major axis.
Brinks & Burton (1984) introduce a flare of increasing scale height in their model of the HI warp. The flare crosses the line of sight to the major axis and accounts for the two velocity systems there. Flares are common in the outer HI disks of galaxies (Sancisi & Allen, 1979; Kulkarni et al., 1982; Olling, 1996), but the evidence for flared stellar disks is conflicting. Studies of other galaxies have generally found a constant stellar scale height at all radii (van der Kruit & Searle, 1981; Morrison, Boroson, & Harding, 1994). Recent in situ analyses of Milky Way stars, however, suggest that its stellar disk may be flared (Lopez-Corredoira et al., 2002; Drimmel & Spergel, 2003). Drimmel & Spergel (2003) find that a flare parameter of 6.6 pc/kpc slightly improves their model fits. However, this amounts to an increase of less than 0.25 kpc over the entire length of the disk. This is is a relatively small increase, and would be indistinguishable from an unflared disk in our data.
Braun (1991) analyzed existing HI data and concluded that the warp model is too simple. He suggested that the data were better explained by a more complex change in position of the HI disk’s midplane, perhaps caused by gravitational perturbations from M32. In this model, the position of the disk midplane varies from 500 pc above the nominal plane to 1 kpc below it (see Braun, 1991, Figure 10). If M31’s disk had been disturbed by M32’s passage, dynamical evolution may have thickened the stellar disk to an even larger scale height. However, the cold disk kinematics of some globular clusters rules out a major interaction, making a disk thickened in this way unlikely (Morrison et al., 2003a). Based on these arguments, we expect that the disk’s luminous influence should have waned entirely by kpc.
3.2.2 Kinematic Signature of the Disk
The disk’s distinctive kinematic signature can be illustrated by first considering a simple edge-on disk with zero velocity dispersion and constant circular velocity; a schematic is shown in Figure 7. The line of sight through a given major axis distance, , intersects the disk at different radii resulting in different projections of the rotation velocity, , into the line of sight. At a single value of , any velocity between that at A and that at C is allowed. The lowest velocity allowed decreases towards the center of the disk where the line-of-sight velocity, , is zero. Corresponding simulated velocity-distance diagrams are shown in Figure 8. Disk objects will be found in only two of the four quadrants of the velocity-distance diagram, corresponding to the approaching and receding sides of the disk.


Because the disk is inclined rather than exactly edge-on, distance from the major axis correlates with position in the disk. For example, lines of sight through the major axis intersect the orbital tangent point (left panel); is the component of projected into the line of sight through the inclination. Lines of sight through the disk between B and C (right panel) exclude the major axis points and can have only lower values down to the lowest allowed by the edge of the disk. This basic geometry also holds for a more realistic, hotter disk with some velocity dispersion, although the velocity dispersion tends to smooth out sharp features.
3.3 Disk PN Kinematics
PN near the major axis are those most likely to be disk objects (Figure 6, upper left panel). There are 10 PN with and . One object near kpc has = –25 km/s, more than 200 km/s from the HI rotation velocity, and probably belongs to the bulge or halo, so we have excluded it from the disk sample. The 9 remaining PN have an average of 215 km/s with = 39 km/s.333These values have been corrected for M31’s inclination. We have dropped the negative sign indicating rotation toward the observer throughout the remainder of the paper. is dominated by the component of the velocity ellipsoid on the major axis, implying 55 km/s.
However, these values of and are very uncertain. First, the inclusion of off-axis PN in the average systematically reduces the measured mean . Second, the sample is very small, and the statistics do not take into account the possible inclusion of bulge PN. At this distance along the major axis, the bulge contributes % of the total luminosity (WK88), or potentially 1–2 PN of the 9 in this sample. Two PN have velocities more than 100 km/s from the HI rotation and removing those increases the average to 234 km/s, and reduces to 20 km/s. Third, the disk rotation velocity is not a secure measurement and is uncertain at the 10-20 km/s level; see the discussion in Morrison et al. (2003a).
With this sample, we cannot distinguish between a thin and thick disk, and more disk PN are needed (Merrett et al., 2003, D. Hurley-Keller et al., in preparation). Morrison et al. (2003a) show that a large subsample of globular clusters which project on to the disk have thin disk kinematics. This suggests there has been no merger with M31 large enough to disrupt its thin disk since the formation of the clusters and is compelling evidence against a thick disk in M31.
3.4 Beyond the Disk: Bulge and Halo
At kpc, the PN kinematics are still dominated by rotation (Figure 6, lower right panel). The mean of the PN with and is 116 km/s, with = 79 km/s. These PN clearly do not belong to a high velocity dispersion, non-rotating halo like that of the Milky Way. To what population do they belong?
3.4.1 Overview of Kinematic Models
To answer this, we constructed simple kinematic models of disk and bulge populations as described in Morrison et al. (2003a). Briefly, for each PN, and are known, but the line-of-sight depth is not. Using a Monte Carlo method, we choose a likely line-of-sight position based on the density distribution and iterate until a detectable PN results. Once we have a line-of-sight depth, we randomly generate an appropriate velocity for that position in the disk. The velocity is then projected into the line of sight. The result is a predicted velocity for each PN position given a specific kinematic model.
For the thin and thick disks, we assume an exponential surface brightness distribution in R and Z;
where is the cylindrical radius and is the height above the galaxy plane.
For disk parameters of scale height, scale length and maximum radius, we have used the Milky Way and other spiral galaxies as templates. We adopted a scale height of 0.3 kpc for the thin disk, comparable to that of the Milky Way thin disk. For the thick disk, we chose a scale height of 1 kpc; increasing this to 2 kpc has no effect on our conclusions. The thin and thick disk scale length and maximum radius are fixed at 5.9 kpc and 26 kpc respectively, values taken from WK88 and scaled for our assumed distance to M31 of 770 kpc. Although thick disks in other galaxies have larger scale lengths than the thin disks (Morrison, 1999; Neeser, Sackett, De Marchi, & Paresce, 2002), varying the thick disk scale length by 20% had no measurable effect on the models we discuss in the next section. Thus far, the few attempts to constrain the cutoff radius of thick disks suggest that thin and thick disks in a given galaxy have the same extent (Pohlen, Balcells, Lütticke, & Dettmar, 2004).
At the large values of under consideration, can be treated as constant, and we fix at 250 km/s, a representative value based on the HI data. We have adopted a relationship between and derived from the van der Kruit & Freeman (1984) and Bottema (1993) studies of galaxy disks:
This relationship can be normalized to match the Milky Way thin and thick disk values of at the solar radius, taken from reviews by Norris (1999) and Morrison (1999) and listed in Table 4. The equation becomes:
The velocity ellipsoid follows from the epicycle approximation (e.g. Binney & Tremaine, 1987):
(,,)
For the bulge model, we use an surface brightness profile, with an axial ratio of b/a=0.55 (PvdB), and adopt an isotropic velocity ellipsoid ( = = ) , with constant rotation at these large values of . This simplification is not unreasonable. As yet, little is known about the behavior of bulges at large radii; some bulges exhibit cylindrical rotation, while others show a decrease in with distance from the midplane (Kormendy & Illingworth, 1982). In the current sample, there are too few PN to test a more detailed model.
We have chosen an axisymmetric model for the bulge, although some authors suggests that M31’s inner bulge is triaxial (Braun, 1991; Stark & Binney, 1994; Berman & Loinard, 2002). We note that the 2MASS image of the M31 bulge (Jarrett et al., 2003) shows considerably less isophote twisting than the optical images, suggesting that the disk warp may have contributed to earlier impressions of a triaxial bulge. The HI rotation curve of Braun (1991) shows a strong central peak which he attributes to non-circular gas orbits, suggesting a triaxial potential. However, the CO rotation curve of Loinard et al. (1999) has a smaller central peak than the HI curve of Braun (1991). Thus, the bulge may not be strongly triaxial.

3.4.2 Modeling Results
Representative thin disk, thick disk, and bulge models for the outer PN are shown with the data for comparison in Figure 9. The important properties of these models are summarized in Table 5. Only a small fraction of the PN have positions which can be fit by the thin disk model. Most of the PN (20 of 33) at would deproject to radii beyond the optical edge of the disk at 25–35 kpc. Perhaps more convincingly, the PN velocities are also incompatible with this model. Because velocity dispersion falls off with radius in a disk of constant scale height (van der Kruit & Freeman, 1984; Bottema, 1993) and is low ( km/s) for a thin disk at all radii, the disk at this large radius has a low line-of-sight velocity dispersion. This kinematic discrepancy between the model and the data holds regardless of the maximum radius of the model disk used.
The thick disk model could account for the PN at kpc; however, the velocity dispersion along the minor axis in the model is significantly less than observed, because PN this far from the major axis would belong to the outer disk where the dispersion is relatively low. By 25 kpc, has fallen to km/s in our model of the thick disk. The contribution of the thick disk is vanishingly small by kpc, and the thirteen PN beyond this (see Figure 5) are not fit by the thick disk model. Those thirteen PN have a significant rotation component, with an average of 70 km/s.
Occam’s razor is an appropriate consideration here – there is no need to introduce a new stellar population in M31. The thirteen PN beyond kpc already represent a rotating population which are not explained by the thick disk model. No convincing evidence of a thick disk in M31 has yet emerged, and the cold kinematics of many M31 clusters suggests that M31 has not experienced a merger massive enough to form a thick disk since the birth of the globular clusters (Morrison et al., 2003b); only satellites with 10% of the disk mass significantly heat the disk (Quinn & Goodman, 1986; Walker, Mihos, & Hernquist, 1996).
The bulge, however, offers a ready explanation. Existing star counts have already hinted that the bulge extends far into the canonical halo. The minor axis profile is well-fit by a single profile as far out as it has been measured (20 kpc; PvdB). In Figure 10, we have binned the complete subsample of Field 1 PN along the minor axis (3 kpc) by isophotal radius, assuming that the bulge has an axial ratio of 0.55. We determined the complete subsample by fitting the known PN luminosity function to the histogramed data, similar to Ciardullo et al. (1989). At some point, the number of PN observed falls off from the predicted number of PN and this determines our completeness limit. The two PN from Field 2 which are included in this minor axis sample are the two most distant bins in the histogram. The inner three bins are affected by our exclusion of PN very near the center of the galaxy, as described earlier.
The minor axis PN distribution is well fit by the prediction of the PvdB surface brightness profile, assuming the M31 PN production rate of Ciardullo et al. (1989) for the upper magnitudes of the PN luminosity function. It has been suggested that a drop in the PN production rate can be caused by both extreme old age and very low metallicity (Ciardullo, 1995; Jacoby et al., 1997; Magrini et al., 2003), as expected in a halo population. We see no dramatic change, however, in the PN production rate along the minor axis out to at least 12 kpc. This suggests no sudden decrease in metallicity or age of the dominant population, but rather continuity from the central bulge out to at least 12 kpc.

With this in mind, we feel justified in considering whether the outer PN velocities are consistent with bulge kinematics. Like the bulges of other early-type spirals, which have (Kormendy & Illingworth, 1982; Davies & Illingworth, 1983), M31 has a moderate degree of rotational support in the inner regions. The central bulge has a large velocity dispersion (100 km/s) and a rotation curve which rises to 80 km/s by about 1 kpc (Richstone & Shectman, 1980). This is significantly less rotation than seen in the data (116 km/s), and a kinematic model based on the central bulge characteristics proves incompatible with our data (Figure 11).

However, this is not a fair comparison. The properties of the central bulge are based on the nuclear observations of Richstone & Shectman (1980) and the stellar absorption data of McElroy (1983), which only extend to about 2 kpc along the major axis, less than 1 for the M31 bulge. These data are on the rising portion of McElroy’s rotation curve, and in fact show an increase in mean velocity with distance from the center in his Figure 7. Therefore, the bulge rotation could reasonably flatten out at 150 to 200 km/s beyond 6 kpc on this side of the galaxy.
Recent observations of low luminosity ellipticals (Rix, Carollo, & Freeman, 1999) show a similar increase in the degree of rotational support at large radii (), with = 2–3 in many cases. M31’s bulge occupies the same region of the fundamental plane as low luminosity ellipticals (Kormendy, 1985, 1987; Kormendy & Bender, 1999), and we might therefore expect that they have common kinematic properties.
The low-luminosity elliptical data are derived from stellar absorption spectra along the major axis, while our outer PN are far off-axis. In order to make a better comparison, we have used our kinematic models to predict the value of and that we would expect to observe along the major axis if our PN belong to a bulge with increasing rotational support. We generated 1000 realizations for each of a set of models covering a range of possible and values, and compared the resulting probability distributions for our variables to our observed values.
We found from our models that the line-of-sight dispersion is independent of the rotation velocity in the range of interest, and that = 50 – 90 km/s bracketed the range of reasonable values (Figure 12). For those values, = 130 to 170 km/s matched (Figure 13). Our final best estimate is = 150 20 km/s and = km/s, where the uncertainties cover the range of model parameters that led to a match with the measured values of and . In the lower right panel of Figure 6, we have plotted the range of velocities generated for each PN position in the 1000 model runs of this best model. Only one outer PN is never fit by the bulge model, in contrast to the disk models. The dark line is the average rotation curve for all the PN with 6, and the lighter lines are the model 10% confidence limits for these PN. Most fall within the limits – their velocities are consistent with our bulge model.
Interestingly, Reitzel et al. (2004) find evidence of a population with similar rotation in a field 34 kpc along the major axis. Roughly two-thirds of their sample of 23 M31 red giants have velocities relative to M31 of 150 km/s, in good agreement with our model-based estimate for the major axis rotation for the outer bulge. However, the dispersion is low, only 27 km/s, and Reitzel et al. (2004) reason that these giants may belong to the disk, or cold substructure in the halo. More velocities covering a wider area will be needed to disentangle these populations.
For the outer PN, the model suggests = 150/70 = 2.1444We use in the same sense as Rix, Carollo, & Freeman (1999): a simple quotient of the line-of-sight velocity and velocity dispersion at a given position, well within the range covered by the low-luminosity ellipticals (Rix, Carollo, & Freeman, 1999). If we accept that these PN belong to the M31 bulge based on the surface brightness profile, then the velocities imply that M31’s bulge shares kinematic as well as photometric properties with low luminosity ellipticals. This strengthens the evolutionary connection between these types of galaxies, and may provide an important clue to understanding the formation of large spirals like M31.


3.5 The Halo
Regardless of how we interpret the large rotation velocity of the outer PN, it seems clear that most do not belong to a kinematically hot, canonical halo. Are there any PN in our sample which could? Without recourse to more detailed models than justified by the data, the best we can do is identify PN which cannot belong to either the disk or the bulge. At all , a few objects can be found that have velocities which are inconsistent with either of these populations, and their coordinates and velocities are listed in Table 6. As a group, their spectra do not systematically differ from the other PN.
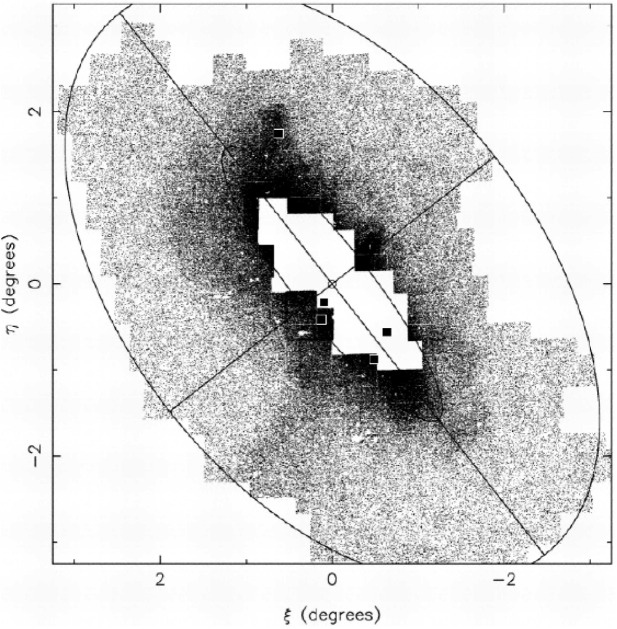
The suprising conclusion we draw from the PN velocities and Figure 14, where we have overplotted their positions on Figure 2 from Ferguson et al. (2002), is that all five halo PN probably belong to tidal streams in M31’s outer halo. One is projected on the Northern spur, and is counter-rotating with respect to the disk there. Two are projected near the major axis at kpc; their velocities are similar to M32’s systemic velocity and they could be debris from that galaxy. All three of these halo PN have velocities in the “forbidden” quadrants.
The remaining two halo PN are located near the center of the galaxy. Their velocities are within 40 km/s of each other ( km/s) and are at least 3 times the central bulge dispersion (100 km/s). Orbits suggested by Merrett et al. (2003) and Ibata et al. (2004) for the Southern Stream (Ibata et al., 2001; Ferguson et al., 2002) project near the position of these PN. Their velocities follow the gradient found by Ibata et al. (2004), implying that these PN could belong to the Southern Stream. Finding PN in low surface brightness streams is somewhat unexpected, as PN are intrinsically rare objects (only 30/; Ciardullo et al. 1989). Velocities in the streams will provide constraints on the orbits of their progenitors, and deeper observations are planned to detect more stream PN. We will revisit these possible streams in a later paper.
We have yet to find the M31 analog to the hot component of the Milky Way inner halo. If the PN production rate per unit luminosity is the same as for other M31 populations, we would expect to see of order 20–30 PN if we covered the entire halo of M31 at the depth of our survey and its luminosity is of order , the approximate luminosity of the Milky Way halo (Morrison & Harding, 1993). Depending on the density distribution of the halo stars, we have surveyed one quarter or less of the halo, so very roughly 5-7 PN would be expected in our sample from such a halo. Yet all 5 of our halo PN candidates belong to kinematically cold features in the halo.
On the surface, this suggests that the M31 halo does not have a kinematically hot component analogous to the inner Milky Way halo. However, if the hot component of the M31 halo is as old and metal-poor as the Milky Way halo, the PN production rate could be lower by a factor of 5 or more (Magrini et al., 2003). This would be consistent with a total lack of hot halo objects in our sample. Studies in search of these objects must reach farther down the PN luminosity function by several magnitudes.
Spectroscopic surveys of red giant stars, because of the larger sample size, may be needed to find the hot halo, especially if the PN production rate is significantly lower for old populations. Reitzel & Guhathakurta (2002) found a high dispersion of 150 km/s in a sample of M31 red giants in a field 19 kpc along the minor axis. This field is further out than our PN sample and may have reached, at last, a region where the halo dominates.
4 Discussion
4.1 Bulge vs. Halo
The extent of M31’s bulge has been a topic of debate in the literature. Some previous studies of M31 stellar populations suggested that fields as far out as 20 kpc were still dominated by the bulge (Mould & Kristian 1986; Durrell et al. 2001; Freeman 1996) primarily because of two important findings: first, the higher metallicity of the stars compared to the Milky Way halo at comparable radius (Durrell et al. 1994, 2001; Holland, Fahlman, & Richer 1996), and second, its surface brightness profile which extends smoothly out to at least 20 kpc on the minor axis (PvdB). We add to this evidence the discovery that PN at 6 kpc, in regions typically associated with the halo, have a = 116 km/s and = 79 km/s. This rotation is very different from the behavior of the Milky Way halo populations at similar radii and suggests that the bulge light dominates even out to 20 kpc on the minor axis.
M31 globular clusters also differ significantly from their Milky Way counterparts. As a system, the clusters have a large rotation, km/s on average(Perrett et al., 2002). This holds for both the metal-rich and the metal-poor subsets, implying that neither have clear “halo” kinematics, although the precise velocity dataset of Perrett et al. (2002) was confined to inner regions and may select against halo objects. Morrison et al. (2003a) demonstrate that % of M31 clusters projected on the disk actually have thin disk kinematics. No analogous population is known among the Milky Way globular clusters. In contrast, studies of the Milky Way globular clusters have found that metal-poor clusters belong to the halo (Zinn, 1985), while the central metal-rich clusters have either bulge or thick disk kinematics (Frenk & White, 1982; Minniti, 1995; Côté, 1999; Armandroff, 1989).
If canonical M31 halo regions are actually dominated by the bulge, then further comparisons with the Milky Way halo are misleading. Instead, these M31 halo regions provide a baseline for comparison to more distant early type spiral bulges. How does a bulge with moderate rotational support form? In major mergers, angular momentum can migrate outwards in the dark halo as it is assembled (Quinn & Zurek, 1988). Thus, a bulge which formed in the very early stages of galaxy formation simultaneously with the dark halo assembly would have the law profile characteristic of violent relaxation as well as increased rotation at large radii. PN studies of the outer regions of some large ellipticals show this expected increase in rotation with radius (e.g. Hui et al., 1993).
Dissipationless mergers of disk galaxies of unequal mass (ratio 3:1) can also lead to disky remnants with more rotational support in the inner regions and law profiles (Naab, Burkert, & Hernquist, 1999; Bendo & Barnes, 2000) as the larger disk partly survives the interaction. We find that the kinematics of M31’s outer bulge is in rough agreement with the low-luminosity elliptical observations. A comparison of M31’s bulge kinematics with these observations is complicated because velocities for the ellipticals were measured along the major axis. Nonetheless, we find that = 2.1 by 5, based on the outer bulge PN kinematics in M31 (assuming =2.4 kpc on the major axis; PvdB), similar to values for the low luminosity ellipticals, suggesting an evolutionary kinship.
4.2 The Elusive Halo Remains Elusive
In our entire survey, we only find a handful of PN in the combined sample with halo-like kinematics. Ideally, these are the sample we should compare to the Milky Way halo; however, our PN spectra are not suitable for abundances, and tell us nothing about ages. In principle, they offer the possibility of comparing the luminosities of the M31 and Milky Way halos, because the PN are direct tracers of the underlying stars. However, this is a difficult comparison to make for several reasons. First, uncertainties in the PN production rate make it difficult to translate the number of PN to stellar luminosity. Second, hot halo objects can have any velocity, and confusion with the disk and bulge prevent us from unambiguously identifying those not in the forbidden quadrants. Third, the Milky Way halo luminosity is only approximately known, and depends strongly on the density of the little-studied inner halo, because the halo density distribution is extremely centrally concentrated, with a globular cluster density proportional to (Zinn, 1985).
Perhaps most important, a generalization from our survey to the entire halo is not appropriate if M31’s halo is clumpy. In fact, we know this to be an important issue, as substructure in field star counts has been detected in M31’s halo (Ibata et al., 2001; Ferguson et al., 2002). The clumpiness of the Milky Way halo is now accepted, based on the disruption of the Sgr dSph (Ibata et al., 1994; Ivezić et al., 2000; Yanny et al., 2000; Dohm-Palmer et al., 2001) and on studies of velocity substructures among the metal-poor halo giants in the solar neighborhood (Helmi et al., 1999).
The PN observations thus far tell us more about the bulge than the halo, as do other studies of the stellar populations in these fields. The results of such studies can now be associated with the bulge; for example, estimates of a suprisingly high halo luminosity (Reitzel, Guhathakurta, & Gould 1998), an intermediate-age component (Brown et al., 2003), and moderate flattening (PvdB; Ferguson et al. 2000).
5 Summary
Our search for M31’s halo has led to a picture of that galaxy very different from that of the Milky Way. PN at large distances from the M31 major axis have significant rotation and small velocity dispersion, in contrast to the large velocity dispersion of the Milky Way halo. We conclude that these objects do not belong to the halo, but to the outer reaches of the bulge.
If this is the case, then among other characteristics, M31’s bulge shares the rotation properties of low-luminosity ellipticals; namely, that the amount of rotational support increases with radius. This suggests an evolutionary kinship with low-luminosity ellipticals, which are believed to have formed via hierarchical merging of objects of nearly equal mass, in contrast to the Milky Way halo which formed from the on-going accretion of very small satellites.
Any kinematically hot halo in M31 is represented by a very small number of objects in our sample. Yet given the rarity of PN, even these few could imply a halo luminosity comparable to that of the Milky Way, if they belong to a smooth inner component. However, their projection on M31 suggest they may instead belong to tidal streams in a clumpy halo. We are not claiming that that M31 does not have a Milky-Way like halo. Rather we support, as some earlier researchers have surmised, that the halo is dominated by the bulge out to 20 kpc and farther; preliminary star counts of red giants in a field at 30 kpc reveal a similar metallicity distribution function to that of nearer regions (P. Durrell 2003, private communication).
Sorting out M31’s evolutionary history will require more data, and PN provide the means. With a larger sample of PN velocities, we can clarify the distinction between bulge and halo by connecting the kinematics to the spatial distribution. Most important, abundances can be derived for our sample of halo objects. This is a great advantage of PN; they can ultimately provide a large number of abundances (e.g. Jacoby & Ciardullo, 1999), where this is costly in telescope time for field stars (Reitzel & Guhathakurta, 2002). The ability to tie abundance to kinematics is a connection which has been critical to our understanding of the stellar populations of the Milky Way.
6 Acknowledgements
We thank Rene Walterbos for providing the surface photometry of M31 and the image used in Figure 2; Annette Ferguson for the use of Figure 2 from Ferguson et al. (2002); John Feldmeier and Chris Mihos for many useful discussions. H.L.M acknowledges the support of NSF CAREER grant AST-9624542. D.H.K. is supported by an NSF Astronomy and Astrophysics Postdoctoral Fellowship under award AST-0104455.
References
- Armandroff (1989) Armandroff, T. E. 1989, AJ, 97, 375
- Arnaboldi et al. (1996) Arnaboldi, M. et al. 1996, ApJ, 472, 145
- Arnaboldi et al. (1998) Arnaboldi, M., Freeman, K. C., Gerhard, O., Matthias, M., Kudritzki, R. P., Mendez, R. H., Capaccioli, M., & Ford, H. 1998, ApJ, 507, 759
- Barmby et al. (2000) Barmby, P., Huchra, J. P., Brodie, J. P., Forbes, D. A., Schroder, L. L., & Grillmair, C. J. 2000, AJ, 119, 727.
- Beers et al. (2000) Beers, T. C., Chiba, M., Yoshii, Y., Platais, I., Hanson, R. B., Fuchs, B., & Rossi, S. 2000, AJ, 119, 2866
- Bendo & Barnes (2000) Bendo, G. J. & Barnes, J. E. 2000, MNRAS, 316, 315
- Berman & Loinard (2002) Berman, S. & Loinard, L. 2002, MNRAS, 336, 477
- Binney & Tremaine (1987) Binney, J. & Tremaine, S. 1987, Galactic Dynamics (Princeton: Princeton University Press)
- Bottema (1993) Bottema, R. 1993, A&A, 275, 16
- Braun (1991) Braun, R. 1991, ApJ, 372, 54
- Brinks & Shane (1984) Brinks, E. & Shane, W. W. 1984, A&AS, 55, 179
- Brinks & Burton (1984) Brinks, E. & Burton, W. B. 1984, A&A, 141, 195
- Brown et al. (2003) Brown, T. M., Ferguson, H. C., Smith, E., Kimble, R. A., Sweigart, A. V., Renzini, A., Rich, R. M., & VandenBerg, D. A. 2003, ApJ, 592, L17
- Ciardullo et al. (1989) Ciardullo, R., Jacoby, G. H., Ford, H. C., & Neill, J. D. 1989, ApJ, 339, 53
- Ciardullo (1995) Ciardullo, R. 1995, in IAU Highlights of Astronomy 10, ed. I. Appenzeller (Dordrecht:Kluwer), 507
- Côté (1999) Côté, P. 1999, AJ, 118, 406
- Courteau et al. (1996) Courteau, S., de Jong, R. S., & Broeils, A. H. 1996, ApJ, 457, L73
- Couture et al. (1995) Couture, J., Racine, R., Harris, W. E., & Holland, S. 1995, AJ, 109, 2050
- Cram, Roberts, & Whitehurst (1980) Cram, T. R., Roberts, M. S., & Whitehurst, R. N. 1980, A&AS, 40, 215
- Cretton et al. (2001) Cretton, N., Naab, T., Rix, H., & Burkert, A. 2001, ApJ, 554, 291
- Davies & Illingworth (1983) Davies, R. L. & Illingworth, G. 1983, ApJ, 266, 516
- Deharveng & Pellet (1975) Deharveng, J. M. & Pellet, A. 1975, A&AS, 19, 351
- de Vaucouleurs (1958) de Vaucouleurs, G. 1958, ApJ, 128, 465
- de Vaucouleurs et al. (1991) de Vaucouleurs G., de Vaucouleurs A., Corwin H. G., Jr., Buta, R. J., Paturel, G., & Fouqu , P. 1991, Third Reference Catalogue of Bright Galaxies (New York: Springer)
- Dohm-Palmer et al. (2001) Dohm-Palmer, R. C. et al. 2001, ApJ, 555, L37
- Dressler & Richstone (1988) Dressler, A & Richstone, D. 1988, ApJ, 324, 701
- Drimmel & Spergel (2003) Drimmel, R., & Spergel, D. N., 2003, ApJ, 556, 181
- Durand, Acker, & Zijlstra (1998) Durand, S., Acker, A., & Zijlstra, A. 1998, A&AS, 132, 13
- Durrell, Harris, & Pritchet (1994) Durrell, P. R., Harris, W. E., & Pritchet, C. J. 1994, AJ, 108, 2114
- Durrell, Harris, & Pritchet (2001) Durrell, P. R., Harris, W. E., & Pritchet, C. J. 2001, AJ, 121, 2557
- Durrell, Harris, & Pritchet (2004) Durrell, P. R., Harris, W. E., & Pritchet, C. J. 2004, AJ, 128, 260
- Edvardsson et al. (1993) Edvardsson, B., Andersen, J., Gustafsson, B., Lambert, D. L., Nissen, P. E., & Tomkin, J. 1993, A&A, 275, 101
- Eggen, Lynden-Bell, & Sandage (1962) Eggen, O. J., Lynden-Bell, D., & Sandage, A. R. 1962, ApJ, 136, 748
- Ferguson et al. (2000) Ferguson, A. M. N., Gallagher, J. S., & Wyse, R. F. G. 2000, AJ, 120, 821
- Ferguson et al. (2002) Ferguson, A. M. N., Irwin, M. J., Ibata, R. A., Lewis, G. F., & Tanvir, N. R. 2002, AJ, 124, 1452
- Ford et al. (1977) Ford, H. C., Jacoby, G., & Jenner, D. C. 1977, ApJ, 213, 18
- Freedman & Madore (1990) Freedman, W. L. & Madore, B. F. 1990, ApJ, 365, 186
- Freeman (1987) Freeman, K. C. 1987, ARA&A, 25, 603
- Freeman (1988) Freeman, K. C. 1988, IAU Symp. 130: Large Scale Structures of the Universe, 130, 301
- Freeman (1996) Freeman, K. C. 1996, ASP Conf. Ser. 92: Formation of the Galactic Halo…Inside and Out, 3
- Frenk & White (1982) Frenk, C. S. & White, S. D. M. 1982, MNRAS, 198, 173
- Gilmore & Reid (1983) Gilmore, G. & Reid, N. 1983, MNRAS, 202, 1025
- Helmi et al. (1999) Helmi, A., White, S. D. M., de Zeeuw, P. T., & Zhao, H. 1999, Nature, 402, 53
- Holland, Fahlman, & Richer (1996) Holland, S., Fahlman, G. G., & Richer, H. B. 1996, AJ, 112, 1035
- Huchra, Brodie, & Kent (1991) Huchra, J. P., Brodie, J. P., & Kent, S. M. 1991, ApJ, 370, 495
- Huchra (1993) Huchra, J. P. 1993, ASP Conf. Ser. 48: The Globular Cluster-Galaxy Connection, 420
- Huchra et al. (1999) Huchra, J. P., Vogeley, M. S. & Geller, M. J. 1999, ApJS, 121, 287
- Hui et al. (1993) Hui, X., Ford, H. C., Ciardullo, R. & Jacoby, G. H. 1993, ApJ, 414, 463
- Hui, Ford, & Jacoby (1994) Hui, X., Ford, H., Jacoby, G. 1994, AAS, 26, 938
- Hui et al. (1995) Hui, X., Ford, H. C., Freeman, K. C., & Dopita, M. A. 1995, ApJ, 449, 592
- Ibata et al. (1994) Ibata, R. A., Gilmore, G., & Irwin, M. J. 1994, Nature, 370, 194
- Ibata et al. (2001) Ibata, R., Irwin, M., Lewis, G., Ferguson, A. M. N., & Tanvir, N. 2001, Nature, 412, 49
- Ibata et al. (2004) Ibata, R., Chapman, S., Ferguson, A. M. N., Irwin, M., Lewis, G., & McConnachie, A. 2004, preprint (astro-ph/0403068)
- Ivezić et al. (2000) Ivezić, Z. et al. 2000, AJ, 120, 963
- Jacoby et al. (1989) Jacoby, G. H., Ciardullo, R., Booth, J., & Ford, H. C. 1989, ApJ, 344, 704
- Jacoby et al. (1992) Jacoby, G. H. et al. 1992, PASP, 104, 599
- Jacoby et al. (1997) Jacoby, G. H., Morse, J. A., Fullton, L. K., Kwitter, K. B., & Henry, R. B. C. 1997, AJ, 114, 2611
- Jacoby & Ciardullo (1999) Jacoby, G. H. & Ciardullo, R. 1999, ApJ, 515, 169
- Jarrett et al. (2003) Jarrett, T. H., Chester, T., Cutri, R., Schneider, S. E., & Huchra, J. P. 2003, AJ, 125, 525
- Kent (1989) Kent, S. M. 1989, AJ, 97, 1614
- Kormendy & Illingworth (1982) Kormendy, J. & Illingworth, G. 1982, ApJ, 256, 460
- Kormendy (1985) Kormendy, J. 1985, ApJ, 295, 73
- Kormendy (1987) Kormendy, J. 1987, Nearly Normal Galaxies. From the Planck Time to the Present, 163
- Kormendy (1988) Kormendy, J. 1988, ApJ, 325, 128
- Kormendy & Bender (1999) Kormendy, J. & Bender, R. 1999, ApJ, 522, 772
- Kulkarni et al. (1982) Kulkarni, S. R., Heiles, C. & Blitz, L. 1982, ApJ, 259L, 63
- Laird et al. (1988) Laird, J. B., Carney, B. W., Rupen, M. P., & Latham, D. W. 1988, AJ, 96, 1908
- Loinard et al. (1999) Loinard, L., Dame, T. M., Heyer, M. H., Lequeux, J., & Thaddeus, P. 1999, A&A, 351, 1087
- Lopez-Corredoira et al. (2002) Lopez-Corredoira, M., Cabrera-Lavers, A., Garzon, F., & Hammersly, P. L., 2002, A&A, 394, 883
- Magrini et al. (2003) Magrini, L. et al. 2003, astro-ph/0305105
- Majewski, Munn, & Hawley (1994) Majewski, S. R., Munn, J. A., & Hawley, S. L. 1994, ApJ, 427, L37
- Mateo (1998) Mateo, M. L. 1998, ARA&A, 36, 435
- McElroy (1983) McElroy, D. B. 1983, ApJ, 270, 485
- Méndez et al. (2001) Méndez, R. H., Riffeser, A., Kudritzki, R.-P., Matthias, M., Freeman, K. C., Arnaboldi, M., Capaccioli, M., & Gerhard, O. E. 2001, ApJ, 563, 135
- Merrett et al. (2003) Merrett, H. R., et al. 2003, MNRAS, 346, 62
- Minniti (1995) Minniti, D. 1995, AJ, 109, 1663
- Monet et al. (1998) Monet, D. et al. 1998, The USNO-A2.0 Catalogue, (U.S. Naval Observatory, Washington DC)
- Morrison & Harding (1993) Morrison, H. L. & Harding, P. 1993, PASP, 105, 977
- Morrison, Boroson, & Harding (1994) Morrison, H. L., Boroson, T. A., & Harding, P. 1994, AJ, 108, 1191
- Morrison et al. (1997) Morrison, H. L., Miller, E. D., Harding, P., Stinebring, D. R., & Boroson, T. A. 1997, AJ, 113, 2061
- Morrison (1999) Morrison, H. L. 1999, ASP Conf. Ser. 165: The Third Stromlo Symposium: The Galactic Halo, 174
- Morrison et al. (2003a) Morrison, H. L., Harding, P., Jacoby, G. & Hurley-Keller, D. A., ApJ, in press
- Morrison et al. (2003b) Morrison, H. L., Harding, P., Jacoby, G. & Hurley-Keller, D. A., ApJ, in press
- Mould (1986) Mould, J. 1986, Stellar Populations, 9
- Mould & Kristian (1986) Mould, J. & Kristian, J. 1986, ApJ, 305, 591
- Naab, Burkert, & Hernquist (1999) Naab, T., Burkert, A., & Hernquist, L. 1999, ApJ, 523, L133
- Neeser, Sackett, De Marchi, & Paresce (2002) Neeser, M. J., Sackett, P. D., De Marchi, G., & Paresce, F. 2002, A&A, 383, 472
- Nolthenius & Ford (1986) Nolthenius, R. & Ford, H. 1986, ApJ, 305, 600
- Nolthenius & Ford (1987) Nolthenius, R. & Ford, H. C. 1987, ApJ, 317, 62. (NF87)
- Norris (1986) Norris, J. 1986, ApJS, 61, 667
- Norris (1999) Norris, J. 1999, Ap&SS, 265, 213
- Oey (2000) Oey, M. S. 2000, ApJ, 542L, 25
- Olling (1996) Olling, R. 1996, AJ, 112, 457
- Pellet et al. (1978) Pellet, A., Astier, N., Viale, A., Courtes, G., Maucherat, A., Monnet, G., & Simien, F. 1978, A&AS, 31, 439
- Perrett et al. (2002) Perrett, K. M., Bridges, T. J., Hanes, D. A., Irwin, M. J., Brodie, J. P., Carter, D., Huchra, J. P., & Watson, F. G. 2002, AJ, 123, 2490
- Pfenniger & Norman (1990) Pfenniger, D. & Norman, C. 1990, ApJ, 363, 391
- Pohlen, Balcells, Lütticke, & Dettmar (2004) Pohlen, M., Balcells, M., Lütticke, R., & Dettmar, R. J. 2004, A&A, 422, 465
- Pritchet & van den Bergh (1994) Pritchet, C. J. & van den Bergh, S. 1994, AJ, 107, 1730
- Quinn & Goodman (1986) Quinn, P. J. & Goodman, J. 1986, ApJ, 309, 472
- Quinn & Zurek (1988) Quinn, P. J. & Zurek, W. H. 1988, ApJ, 331, 1
- Reitzel et al. (1998) Reitzel, D. B., Guhathakurta, P., & Gould, A. 1998, AJ, 116, 707
- Reitzel & Guhathakurta (2002) Reitzel, D. B. & Guhathakurta, P. 2002, AJ, 124, 234
- Reitzel et al. (2004) Reitzel, D. B., Guhathakurta, P, & Rich, R. M. 2004, AJ, in press
- Rich et al. (1996) Rich, R. M., Mighell, K. J., Freedman, W. L., & Neill, J. D. 1996, AJ, 111, 768
- Richstone & Shectman (1980) Richstone, D. O. & Shectman, S. A. 1980, ApJ, 235, 30
- Rix, Carollo, & Freeman (1999) Rix, H., Carollo, C. M., & Freeman, K. 1999, ApJ, 513, L25
- Roberts & Whitehurst (1975) Roberts, M. S. & Whitehurst, R. N. 1975, ApJ, 201, 327
- Ryan & Norris (1991) Ryan, S. G. & Norris, J. E. 1991, AJ, 101, 1865
- Saha (1985) Saha, A. 1985, ApJ, 289 310
- Sancisi & Allen (1979) Sancisi, R. & Allen, R. J. 1979, å, 74, 73
- Schechter, Mateo, & Saha (1993) Schechter, P. L., Mateo, M., & Saha, A. 1993, PASP, 105, 1342
- Searle & Zinn (1978) Searle, L. & Zinn, R. 1978, ApJ, 225, 357
- Stark & Binney (1994) Stark, A. A. & Binney, J. 1994, ApJ, 426L, 31
- van der Kruit & Freeman (1984) van der Kruit, P. C. & Freeman, K. C. 1984, ApJ, 278, 81
- van der Kruit & Searle (1981) van der Kruit, P. C. & Searle, L. 1981, A&A, 95, 105
- Walker, Mihos, & Hernquist (1996) Walker, I. R., Mihos, J. C., & Hernquist, L. 1996, ApJ, 460, 121
- Walterbos & Kennicutt (1988) Walterbos, R. A. M. & Kennicutt, R. C. 1988, A&A, 198, 61 (WK88)
- Weiland et al. (1994) Weiland, J. L. et al. 1994, ApJ, 425, L81
- Yanny et al. (2000) Yanny, B. et al. 2000, ApJ, 540, 825
- Zepf et al. (2000) Zepf, S. E., Liu, M. C., Marleau, F. R., Sackett, P. D., & Graham, J. R. 2000, AJ, 119, 1701
- Zinn (1985) Zinn, R. 1985, ApJ, 293, 424
- Zucker et al. (2004) Zucker, D., et al. 2004, preprint (astro-ph/0401098)
| ID | RA (2000) | Dec (2000) | ||
|---|---|---|---|---|
| HKPN 1 | 0:38:41.29 | 39:47:40.1 | –532.3 | 4.0 |
| HKPN 2 | 0:38:44.19 | 40:17:58.9 | –452.8 | 5.1 |
| HKPN 3 | 0:38:54.97 | 40:10:16.2 | –362.1 | 1.9 |
| HKPN 4 | 0:38:56.63 | 39:47:14.2 | –425.1 | 12.6 |
| HKPN 5 | 0:39:02.52 | 40:22:50.5 | –511.2 | 3.1 |
| HKPN 6 | 0:39:03.40 | 39:45:58.4 | –484.0 | 3.4 |
| HKPN 7 | 0:39:03.76 | 39:53:29.0 | –477.9 | 3.5 |
| HKPN 8 | 0:39:04.46 | 40:34:30.3 | –512.3 | 3.0 |
| HKPN 9 | 0:39:05.33 | 40:41:46.0 | –378.6 | 5.3 |
| HKPN 10 | 0:39:06.60 | 40:14:59.8 | –548.2 | 4.3 |
| HKPN 11 | 0:39:09.32 | 40:11:21.0 | –428.2 | 2.5 |
| HKPN 12 | 0:39:14.80 | 40:24:28.6 | –325.5 | 6.4 |
| HKPN 13 | 0:39:15.00 | 40:26:34.5 | –522.1 | 5.9 |
| HKPN 14 | 0:39:15.80 | 40:12:38.5 | –470.1 | 4.5 |
| HKPN 15 | 0:39:15.84 | 40:12:39.3 | –482.9 | 5.3 |
| HKPN 16 | 0:39:16.29 | 40:22:12.8 | –526.1 | 5.6 |
| HKPN 17 | 0:39:18.51 | 40:09:19.0 | –376.3 | 4.1 |
| HKPN 18 | 0:39:24.53 | 40:07:02.4 | –434.4 | 2.7 |
| HKPN 19 | 0:39:26.12 | 40:44:26.0 | –373.1 | 27.7 |
| HKPN 20 | 0:39:27.26 | 40:29:03.6 | –532.4 | 12.6 |
| HKPN 21 | 0:39:31.62 | 40:14:19.9 | –510.4 | 3.6 |
| HKPN 22 | 0:39:36.66 | 40:17:51.3 | –503.8 | 3.4 |
| HKPN 23 | 0:39:38.40 | 39:21:45.6 | –394.5 | 8.8 |
| HKPN 24 | 0:39:40.38 | 40:13:24.7 | –454.4 | 3.1 |
| HKPN 25 | 0:39:42.80 | 40:22:49.2 | –490.9 | 8.0 |
| HKPN 26 | 0:39:43.99 | 40:35:42.0 | –465.7 | 12.1 |
| HKPN 27 | 0:39:44.64 | 40:19:59.2 | –500.1 | 3.1 |
| HKPN 28 | 0:39:44.79 | 40:12:04.2 | –472.0 | 6.5 |
| HKPN 29 | 0:39:45.40 | 40:31:42.6 | –538.9 | 4.6 |
| HKPN 30 | 0:39:46.14 | 40:11:01.7 | –416.1 | 2.1 |
| HKPN 31 | 0:39:46.71 | 39:38:42.6 | –573.1 | 3.2 |
| HKPN 32 | 0:39:49.08 | 40:42:39.5 | –168.8 | 28.6 |
| HKPN 33 | 0:39:49.62 | 40:21:25.1 | –396.2 | 4.0 |
| HKPN 34 | 0:39:52.56 | 40:09:32.4 | –481.1 | 6.4 |
| HKPN 35 | 0:39:53.93 | 40:31:56.5 | –442.7 | 24.6 |
| HKPN 36 | 0:39:54.23 | 39:51:00.0 | –486.0 | 3.3 |
| HKPN 37 | 0:40:01.81 | 40:37:28.7 | –552.4 | 10.6 |
| HKPN 38 | 0:40:07.65 | 40:28:34.1 | –457.4 | 5.3 |
| HKPN 39 | 0:40:12.82 | 40:13:02.4 | –387.3 | 4.3 |
| HKPN 40 | 0:40:13.97 | 40:10:26.4 | –504.0 | 2.3 |
| HKPN 41 | 0:40:14.24 | 40:23:23.9 | –126.1 | 2.5 |
| HKPN 42 | 0:40:14.51 | 40:38:50.7 | –513.4 | 12.2 |
| HKPN 43 | 0:40:15.29 | 40:24:13.6 | –472.9 | 4.4 |
| HKPN 44 | 0:40:16.20 | 40:09:59.7 | –447.9 | 6.9 |
| HKPN 45 | 0:40:20.85 | 40:28:08.9 | –506.0 | 2.9 |
| HKPN 46 | 0:40:26.61 | 40:27:59.3 | –472.2 | 26.9 |
| HKPN 47 | 0:40:30.80 | 40:36:54.4 | –482.6 | 2.6 |
| HKPN 48 | 0:40:33.70 | 40:13:46.8 | –295.0 | 4.7 |
| HKPN 49 | 0:40:37.96 | 40:13:35.5 | –578.9 | 3.3 |
| HKPN 50 | 0:40:43.39 | 39:57:02.3 | –423.4 | 2.7 |
| HKPN 51 | 0:40:44.02 | 40:25:08.7 | –528.2 | 36.7 |
| HKPN 52 | 0:40:44.24 | 40:27:11.2 | –485.8 | 6.1 |
| HKPN 53 | 0:40:45.33 | 40:41:30.3 | –524.9 | 5.1 |
| HKPN 54 | 0:40:46.82 | 39:51:48.5 | –418.1 | 6.9 |
| HKPN 55 | 0:40:47.30 | 40:28:25.6 | –479.4 | 7.7 |
| HKPN 56 | 0:40:49.58 | 40:39:46.8 | –416.1 | 18.7 |
| HKPN 57 | 0:40:56.88 | 40:20:09.0 | –560.5 | 3.9 |
| HKPN 58 | 0:40:57.23 | 40:36:07.8 | –498.2 | 8.6 |
| HKPN 59 | 0:41:00.28 | 40:28:50.0 | –425.2 | 2.4 |
| HKPN 60 | 0:41:01.86 | 40:24:20.3 | –421.1 | 23.5 |
| HKPN 61 | 0:41:03.72 | 40:41:13.6 | –556.1 | 6.0 |
| HKPN 62 | 0:41:12.34 | 40:35:58.2 | –528.4 | 10.0 |
| HKPN 63 | 0:41:13.50 | 40:42:15.8 | –526.7 | 14.0 |
| HKPN 64 | 0:41:20.40 | 39:28:10.6 | –274.0 | 13.8 |
| HKPN 65 | 0:41:26.34 | 39:59:48.4 | –448.2 | 17.7 |
| HKPN 66 | 0:41:26.48 | 40:32:45.4 | –399.6 | 4.0 |
| HKPN 67 | 0:41:26.84 | 40:43:16.2 | –394.0 | 14.1 |
| HKPN 68 | 0:41:33.67 | 40:20:39.5 | –396.6 | 3.8 |
| HKPN 69 | 0:41:38.18 | 39:54:59.8 | –413.5 | 2.3 |
| HKPN 70 | 0:42:03.33 | 40:31:39.8 | –539.0 | 4.0 |
| HKPN 71 | 0:42:04.07 | 40:29:37.7 | –513.8 | 26.7 |
| HKPN 72 | 0:42:05.09 | 40:43:16.3 | –449.4 | 44.3 |
| HKPN 73 | 0:42:19.12 | 40:57:09.0 | –281.5 | 8.7 |
| HKPN 74 | 0:42:21.19 | 40:33:49.9 | –379.7 | 4.2 |
| HKPN 75 | 0:42:22.82 | 40:43:06.6 | –509.1 | 6.9 |
| HKPN 76 | 0:42:29.75 | 41:03:30.4 | –451.3 | 5.4 |
| HKPN 77 | 0:42:32.35 | 40:42:26.2 | –362.2 | 8.6 |
| HKPN 78 | 0:42:37.21 | 41:04:19.4 | –461.1 | 8.0 |
| HKPN 79 | 0:42:44.49 | 40:17:31.0 | –458.9 | 3.7 |
| HKPN 80 | 0:42:46.60 | 40:26:15.2 | –462.8 | 3.9 |
| HKPN 81 | 0:42:49.84 | 40:51:10.6 | –505.7 | 10.0 |
| HKPN 82 | 0:42:50.58 | 40:04:48.5 | –477.6 | 4.5 |
| HKPN 83 | 0:42:52.05 | 40:29:03.1 | –261.1 | 20.1 |
| HKPN 84 | 0:42:52.11 | 40:29:03.9 | –294.1 | 2.6 |
| HKPN 85 | 0:42:55.60 | 41:03:40.9 | –599.1 | 5.6 |
| HKPN 86 | 0:42:56.02 | 40:51:12.5 | –638.3 | 5.3 |
| HKPN 87 | 0:42:56.18 | 40:35:40.4 | –534.8 | 8.6 |
| HKPN 88 | 0:42:57.81 | 41:12:43.4 | –199.2 | 18.0 |
| HKPN 89 | 0:42:58.82 | 41:22:13.2 | –142.5 | 4.6 |
| HKPN 90 | 0:43:03.15 | 40:57:18.5 | –367.4 | 11.0 |
| HKPN 91 | 0:43:05.26 | 40:53:34.1 | –532.3 | 4.8 |
| HKPN 92 | 0:43:06.16 | 41:10:56.0 | –337.9 | 3.9 |
| HKPN 93 | 0:43:13.72 | 40:52:32.4 | –381.5 | 6.0 |
| HKPN 94 | 0:43:15.18 | 40:51:12.7 | –500.3 | 6.2 |
| HKPN 95 | 0:43:19.00 | 40:58:02.1 | –452.0 | 4.3 |
| HKPN 96 | 0:43:20.61 | 40:55:32.4 | –309.9 | 11.2 |
| HKPN 97 | 0:43:20.63 | 40:57:44.5 | –502.8 | 12.0 |
| HKPN 98 | 0:43:21.64 | 40:59:12.7 | –388.8 | 28.8 |
| HKPN 99 | 0:43:23.00 | 41:15:40.4 | –251.3 | 10.0 |
| HKPN 100 | 0:43:28.32 | 40:51:19.9 | –433.9 | 25.2 |
| HKPN 101 | 0:43:36.79 | 41:03:33.4 | –260.3 | 7.4 |
| HKPN 102 | 0:43:36.80 | 40:37:38.6 | –323.9 | 12.4 |
| HKPN 103 | 0:43:44.52 | 40:59:59.7 | –274.7 | 4.3 |
| HKPN 104 | 0:44:04.65 | 41:12:08.9 | –293.0 | 4.7 |
| HKPN 105 | 0:44:04.94 | 41:09:18.6 | –212.8 | 13.7 |
| HKPN 106 | 0:44:07.49 | 41:10:09.7 | –270.6 | 6.4 |
| HKPN 107 | 0:44:08.01 | 40:03:13.6 | –391.4 | 3.8 |
| HKPN 108 | 0:44:11.42 | 41:01:02.2 | –348.6 | 6.0 |
| HKPN 109 | 0:44:11.92 | 41:14:00.0 | –232.4 | 4.5 |
| HKPN 110 | 0:44:15.88 | 41:22:10.4 | –251.2 | 5.0 |
| HKPN 111 | 0:44:21.04 | 41:15:41.1 | –281.8 | 4.2 |
| HKPN 112 | 0:44:25.50 | 40:14:36.6 | –428.5 | 8.0 |
| HKPN 113 | 0:44:25.98 | 40:15:45.7 | –350.4 | 3.2 |
| HKPN 114 | 0:44:30.33 | 40:07:29.5 | –425.7 | 2.3 |
| HKPN 115 | 0:44:37.91 | 41:14:14.4 | –219.3 | 15.0 |
| HKPN 116 | 0:44:37.97 | 41:07:02.9 | –335.9 | 11.7 |
| HKPN 117 | 0:44:42.22 | 41:08:01.8 | –243.5 | 4.9 |
| HKPN 118 | 0:44:42.77 | 40:40:05.7 | –383.8 | 4.7 |
| HKPN 119 | 0:44:43.80 | 41:14:28.0 | –315.7 | 5.9 |
| HKPN 120 | 0:44:50.69 | 41:17:22.3 | –288.6 | 5.3 |
| HKPN 121 | 0:44:53.16 | 41:15:58.0 | –306.6 | 28.5 |
| HKPN 122 | 0:44:54.43 | 40:52:45.4 | –453.7 | 3.8 |
| HKPN 123 | 0:44:54.98 | 41:09:53.2 | –321.1 | 5.1 |
| HKPN 124 | 0:44:56.30 | 41:20:25.4 | –296.6 | 4.5 |
| HKPN 125 | 0:45:05.05 | 41:12:52.5 | –201.0 | 10.9 |
| HKPN 126 | 0:45:05.30 | 41:09:38.6 | –278.5 | 6.3 |
| HKPN 127 | 0:45:07.14 | 40:39:33.4 | –285.8 | 7.7 |
| HKPN 128 | 0:45:28.36 | 41:04:54.2 | –400.5 | 16.8 |
| HKPN 129 | 0:45:35.32 | 40:59:57.2 | –205.1 | 9.4 |
| HKPN 130 | 0:45:38.13 | 40:59:19.5 | –279.0 | 10.9 |
| HKPN 131 | 0:47:00.98 | 40:49:23.4 | –350.5 | 3.1 |
| HKPN 132 | 0:48:22.14 | 40:45:41.9 | –320.0 | 3.4 |
| HKPN 133 | 0:48:24.78 | 41:08:11.1 | –353.2 | 3.3 |
| HKPN 134 | 0:48:27.23 | 39:55:34.0 | –186.8 | 2.4 |
| HKPN 135 | 0:49:28.30 | 40:59:54.0 | –242.6 | 3.4 |
| ID | (2000) | (2000) | ||
|---|---|---|---|---|
| 1 | 0:42:23.24 | 40:46:28.7 | –182.4 | 8.4 |
| 2 | 0:42:28.93 | 40:44:39.0 | –158.3 | 6.6 |
| 3 | 0:42:40.10 | 40:49:41.3 | –160.5 | 3.6 |
| 4 | 0:42:40.24 | 40:51:03.0 | –149.6 | 2.3 |
| 5 | 0:42:50.63 | 40:45:28.4 | –183.7 | 2.3 |
| 6 | 0:42:53.02 | 40:48:59.8 | –213.5 | 2.0 |
| 7 | 0:42:56.97 | 40:51:01.8 | –169.1 | 24.8 |
| 8 | 0:43:02.04 | 40:49:30.2 | –154.6 | 4.7 |
| ID | (2000) | (2000) | ||
|---|---|---|---|---|
| 6 | 0:42:30.57 | 40:34:46.9 | 270.2 | 39.2 |
| 3 | 0:42:32.17 | 40:33:58.7 | 233.0 | 3.4 |
| 4 | 0:42:31.73 | 40:34:11.2 | 249.5 | 5.2 |
| Model | Density | |||||
|---|---|---|---|---|---|---|
| kpc | kpc | km/s | Distribution | km/s | km/s | |
| thin | 5.9 | 0.3 | 230 | |||
| thick | 5.9 | 1.0 | 230 | |||
| bulge | 2.4 | … | 150 |
| Population | ||||
|---|---|---|---|---|
| Milky Way thin | 3.5 | .3 | -220 | 30 |
| Milky Way thick | 4 | 1.0 | -220 | 65 |
| ID | RA (2000) | Dec (2000) | ||
|---|---|---|---|---|
| HKPN 86 | 0:42:56.02 | 40:51:12.5 | –638.3 | 5.3 |
| HKPN 85 | 0:42:55.60 | 41:03:40.9 | –599.1 | 5.6 |
| HKPN 32 | 0:39:49.08 | 40:42:39.5 | –168.8 | 28.6 |
| HKPN 41 | 0:40:14.24 | 40:23:23.9 | –126.1 | 2.5 |
| NF | 0:46:26.51 | 43:00:42.15 | –452.3 | …. |
Note. — The last object is from the study of Nolthenius & Ford 1987.