Reading the Spectra of the Most Peculiar Type Ia Supernova 2002cx
Abstract
In spite of the apparent lack of Si II and S II features in its spectra, SN 2002cx was classified as a peculiar Type Ia supernova (SN Ia) on the basis of its overall photometric and spectroscopic behavior. Spectra obtained near maximum light contained Fe III features, as in SN 1991T–like events, but the blueshifts of the Fe III absorptions were exceptionally low. The luminosity also was low. We use the supernova synthetic–spectrum code Synow to study line identifications in SN 2002cx. We find that the maximum–light spectra appear to contain weak features of Si II, S II, Si III, and Ca II, which strengthens the connection with SN 1991T–like events. We show that later spectra, obtained 12, 25, and 56 days after maximum, consist of P–Cygni resonance–scattering features due to permitted Fe II and Co II lines. SN 2002cx had been thought to have made the transition from a permitted–line to a forbidden–line spectrum between 25 and 56 days. Owing to the low expansion velocities the postmaximum spectral features are narrower and easier to identify than they are in other SNe Ia. SN 2002cx will lead to improved line identifications in other SNe Ia and clarify when the transition from a permitted–line to a forbidden–line spectrum occurs. In the context of current SN Ia explosion models, we suggest that the properties of SN 2002cx may be consistent with 3D deflagration models, which are not favored for normal SNe Ia.
1 INTRODUCTION
Supernova 2002cx was a very peculiar event. Li et al. (2003; hereafter L03) presented optical photometric and spectroscopic observations from which they concluded that SN 2002cx111SN 2002cx should not be confused with SN 2000cx, a peculiar SN Ia of a different kind, also observed by Li et al. (2001) and subjected to a synthetic–spectrum analysis by Branch et al. (2004). was the most peculiar known Type Ia supernova (SN Ia). In spectra obtained near the time of maximum light the only line identifications were two conspicuous features due to Fe III 4404 and 5129, such as appear in peculiar SN 1991T–like events (Filippenko et al. 1992a; see also Filippenko 1997 for a review of supernova spectra), but in SN 2002cx the Fe III absorptions were blueshifted only by about 7000 km s-1. At maximum light SN 2002cx had a normal color, yet it was almost as subluminous as peculiar SN 1991bg–like events (Filippenko et al. 1992b), which have much redder colors and completely different spectra. L03 did not identify the characteristic SN Ia features of Si II and S II at any phase. In postmaximum spectra Fe II features developed unusually early, and at unusually low velocities. A 56–day postmaximum spectrum appeared to indicate that SN 2002cx had completed an early transition to the nebular phase.222In this paper we use a spectroscopic definition of nebular phase: the phase during which the spectrum is dominated by forbidden emission lines rather than by P–Cygni features of permitted lines. L03 concluded that no existing explosion model can account for the properties of SN 2002cx.
Because many of the spectral features were not identified by L03, and because the low expansion velocities make the spectral features relatively narrow and potentially identifiable, we have used the parameterized synthetic–spectrum code Synow to study line identifications in selected spectra of SN 2002cx.
2 ANALYSIS
L03 presented eight spectra of SN 2002cx, ranging from 4 days before to 56 days after the time of maximum light in the band. The four spectra selected for our study, obtained one day before and 12, 25, and 56 days after maximum, are shown in Figure 1. (The spectrum labelled day 25 actually includes a small portion of a day 20 spectrum, from 9100 to 10,000 Å; the day 25 and day 20 spectra are very similar in their extensive region of overlap.) In all figures of this paper the logarithm of the wavelength is plotted, to allow a fair comparison of the widths of the spectral features at different wavelengths. Figure 1 shows that the day and day 12 spectra are quite different, while the day 12, day 25, and day 56 spectra appear similar in many respects.
In recent papers (Branch et al. 2003, 2004) we have used Synow to interpret spectra of the normal Type Ia SN 1998aq and the peculiar Type Ia SN 2000cx. For discussions of the code, its input parameters, and the way it is used, we refer the reader to these papers.
2.1 The Day Spectrum
The two earliest specta obtained by L03, 4 days and 1 day before maximum, as well as the day spectrum of the SN 1991T–like SN 1997br (Li et al. 1999) are compared in Figure 2. The SN 1997br spectrum has been redshifted by 3000 km s-1 to align the Fe III absorptions. In addition to the two Fe III features, many weaker features appear in both of the SN 2002cx spectra (especially in the blue) and therefore appear to be real. We chose to study the day spectrum because most of its features are stronger than in the day spectrum.
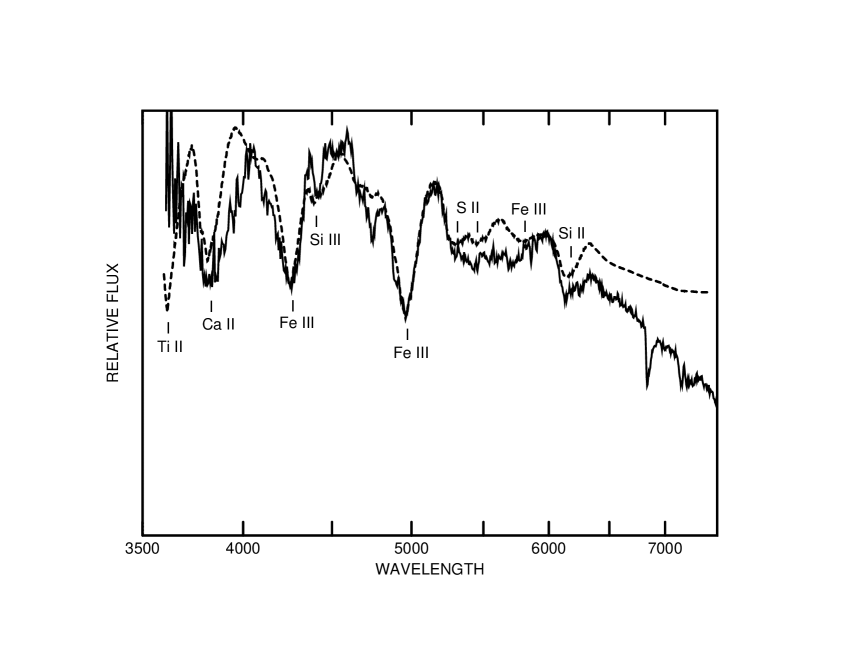
Figure 3 shows a comparison of the day spectrum with a synthetic spectrum that has a velocity at the photosphere of = 7000 km s-1, a blackbody continuum temperature of K, and contains lines of six ions: Fe III, Si II, Si III, S II, Ca II, and Ti II. The ion–specific input parameters — the wavelength () and maximum optical depth () of the reference line; the minimum (), maximum (), and optical–depth e–folding () velocities; and the excitation temperature () — are listed in Table 1. Following Branch et al. (2003), for each ion is assigned the value at which the reference–line optical depth reaches its maximum in local–thermodynamic–equilibrium (LTE) calculations (Hatano et al. 1999), or 5000 K, whichever is higher, because some reference–line optical depths peak only at very low temperatures. (One exception to this rule for choosing will be mentioned in §2.4.) Figure 3 shows that Si II 6355, S II 5468 and 5654, Ca II H&K 3945, and Si III 4550, all forming above the same photospheric velocity as the Fe III lines, can account reasonably well for weak observed features. (Ti II 3760 should be regarded as only one possible identification for the absorption near 3680 Å.)
Several of the observed features are not accounted for by the synthetic spectrum of Figure 3. Some may be produced by weak Fe III, Si III, and S II lines: when the reference–line optical depths of these ions are increased, thus making the strongest synthetic features too strong, weaker features appear in the synthetic spectrum near some of the observed ones. Various effects, including partial covering of the photosphere by these ions, and departures from LTE excitation of their level populations, could cause the relative strengths of observed weak and strong features to be greater than they are in a Synow spectrum. Another possibility is that some of the unidentified features are due to detached high–velocity features333Detached refers to non–zero line optical depths only above a velocity that exceeds the velocity at the photosphere. Recently it has been realized that detached high–velocity features are not uncommon in SN Ia spectra (e.g., Branch 2004; Gerardy et al. 2004).: e.g., when we introduce line formation detached at 13,000 km s-1, Fe II lines and Ca II H&K can account for a few of the observed absorptions. However, we have not found a convincing way to identify all of the observed features. This raises the spectre of line formation in multiple shells or clumps at various line–of–sight velocities (Wang et al. 2003; Kasen et al. 2003; Thomas et al 2004).
L03 showed that the early spectra of SN 2002cx were in some respects like those of SN 1991T–like events, although with exceptionally low absorption blueshifts. Figure 4 shows a comparison of the day spectrum of SN 1997br (Li et al. 1999) with a synthetic spectrum that is exactly like the one that is compared to SN 2002cx in Figure 3, except that has been increased from 7000 to 12,000 km s-1. Although there are discrepancies in Figure 4, the agreement is about as good as it is in Figure 3, i.e., the “sped up” synthetic spectrum for SN 2002cx resembles the spectrum of SN 1997br. The near–maximum spectra of SN 1991T–like events are known to contain weak Si II, S II, and Ca II features because these features were seen to strengthen gradually in postmaximum spectra (Mazzali et al. 1995; Li et al. 1999; Hatano et al. 2002). Together Figures 3 and 4 strongly suggest the presence of weak Si II, S II, and Ca II features in SN 2002cx, at roughly the same optical depths as in SN 1997br.
2.2 The Day 12 Spectrum
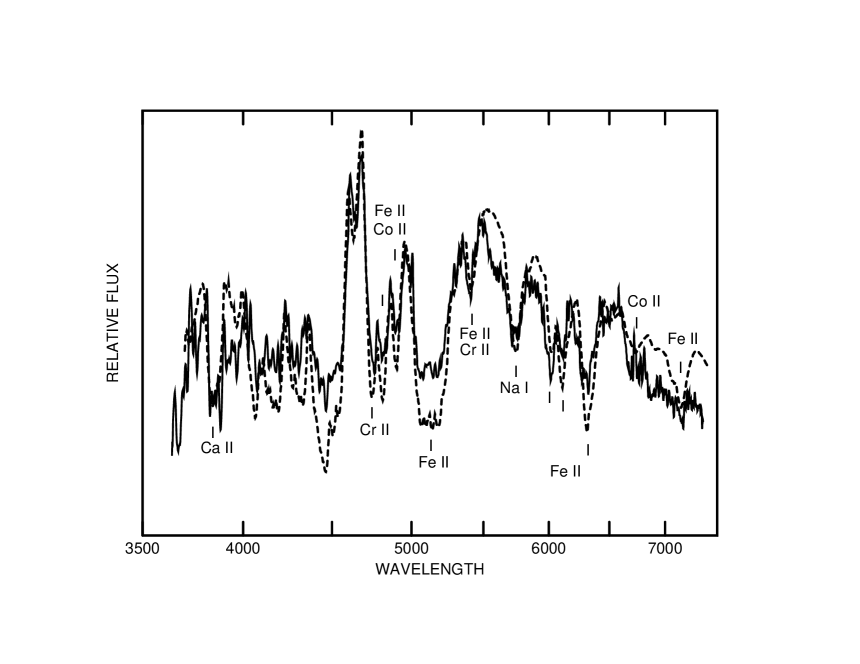
L03 found that in the day 12 spectrum the Fe III lines had vanished and strong Fe II lines had developed. Figure 5 shows a comparison of the day 12 spectrum with a synthetic spectrum that has = 7000 km s-1, K, and contains lines of five ions: Ca II, Na I, Fe II, Co II, and Cr II. In the synthetic spectrum Na I 5892 and Ca II 3945 each produce just one feature. Lines of Fe II produce most of the other observed features, but line blanketing by Co II lines is needed to get a reasonable fit in the blue. Lines of Cr II also improve the fit in the blue. Apart from the Ca II feature, at wavelengths shorter than 5500 Å the synthetic spectrum is a complex blend of Fe II, Co II, and Cr II lines. The ion–specific input parameters are in Table 2. In the synthetic spectrum the Fe II, Co II, and Cr II lines are forming from 7000 km s-1 to an imposed maximum velocity of 9000 km s-1, with line optical depths that are independent of velocity within this range (); thus in the synthetic spectrum the optical depths of the Fe II, Co II, and Cr II lines decrease discontinuously (and artificially) to zero at 9000 km s-1. The Na I and Ca II lines have flat optical–depth distributions from 7000 to 9000 km s-1, but in addition (see Table 2) they have exponentially decreasing () optical depth above 9000 km s-1.
L03 showed that in some respects the day 12 spectrum of SN 2002cx resembled the spectra of other SNe Ia at later epochs, about three weeks postmaximum, but with lower absorption blueshifts in SN 2002cx. We find that a synthetic spectrum like that of Figure 5 best resembles three–week postmaximum spectra of other SNe Ia when the velocity at the photosphere and the maximum velocities are scaled up by a factor of 9/7.
2.3 The Day 25 Spectrum
L03 showed that spectra obtained between 20 and 27 days in some respects resembled other SNe Ia at about six weeks postmaximum, again with lower blueshifts in SN 2002cx. Mysterious flux peaks between 6600 and 8000 Å appeared to be genuine emission lines rather than P–Cygni features, perhaps signaling the beginning of an early transition to the nebular phase (but see below).
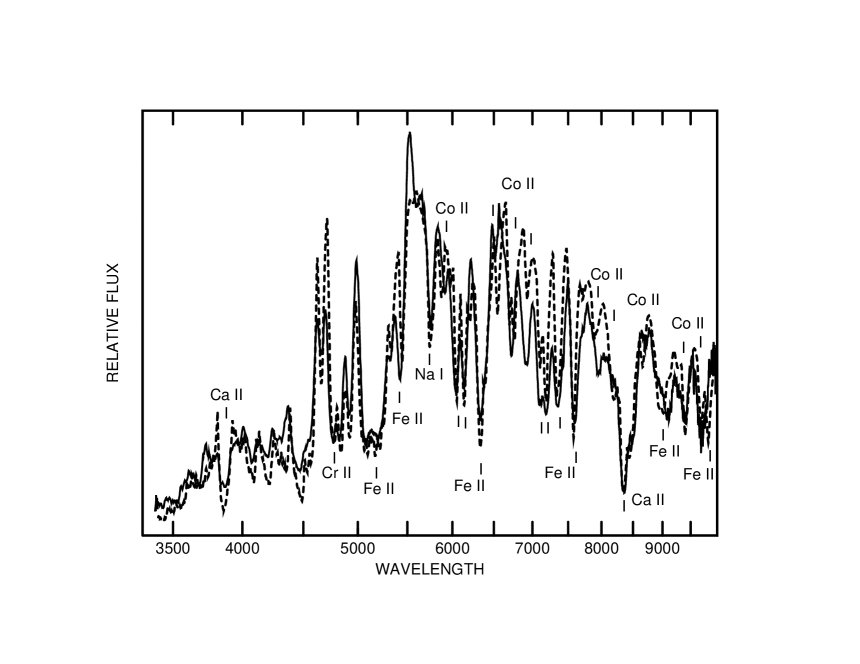
Figure 6 shows a comparison of the day 25 spectrum with a synthetic spectrum that has = 5000 km s-1, K, and contains lines of the same five ions used for the day 12 spectrum. In this synthetic spectrum Fe II again produces many of the features. However, Co II lines not only improve the fit in the blue but they also account for several individual features in the red. This is the first clear evidence for permitted Co II features in the red part of an SN Ia spectrum. Now that the observed spectrum extends to sufficiently long wavelengths, the Ca II triplet also is evident. The ion–specific parameters are in Table 3. The Fe II, Co II, and Cr II features are forming between 5000 km s-1 and an imposed maximum velocity of 7000 km s-1 while Na I and Ca II are forming from 5000 to 9000 km s-1, all with flat optical–depth distributions. The degree to which Fe II and Co II can account for nearly all of the features in the day 25 spectrum, including the apparent emission lines between 6600 and 8000 Å, indicates that (despite discrepancies such as the insufficiently deep synthetic absorption near 6900 Å) our present interpretation in terms of permitted–line P–Cygni features is correct; there is no need to invoke the development of nebular–phase emission lines. Note also that the absorption near 7600 Å, commonly attributed to O I 7773 in early SN Ia spectra, as well as in this spectrum of SN 2002cx by L03, is accounted for by a blend of Fe II 7690, 7705, and 7732; this shows that when Fe II lines are strong even in the red, O I 7773 is not necessarily required. We find that a synthetic spectrum like that of Figure 6 best resembles six–week postmaximum spectra of other SNe Ia when the input velocities are scaled up by a factor of 9/5.
2.4 The Day 56 Spectrum
L03 considered the day 56 spectrum to be a nebular–phase forbidden emission–line spectrum, and suggested tentative identifications of the emission peaks primarily as lines of [Fe II], [Co II], and [Co III]. On the other hand, our Figure 1 shows that the day 25 and day 56 spectra are similar in many respects, the main differences being confined to the 6600 to 7200 Å region. This suggests that an intepretation of the day 56 spectrum in terms of permitted–line P–Cygni profiles should be explored.
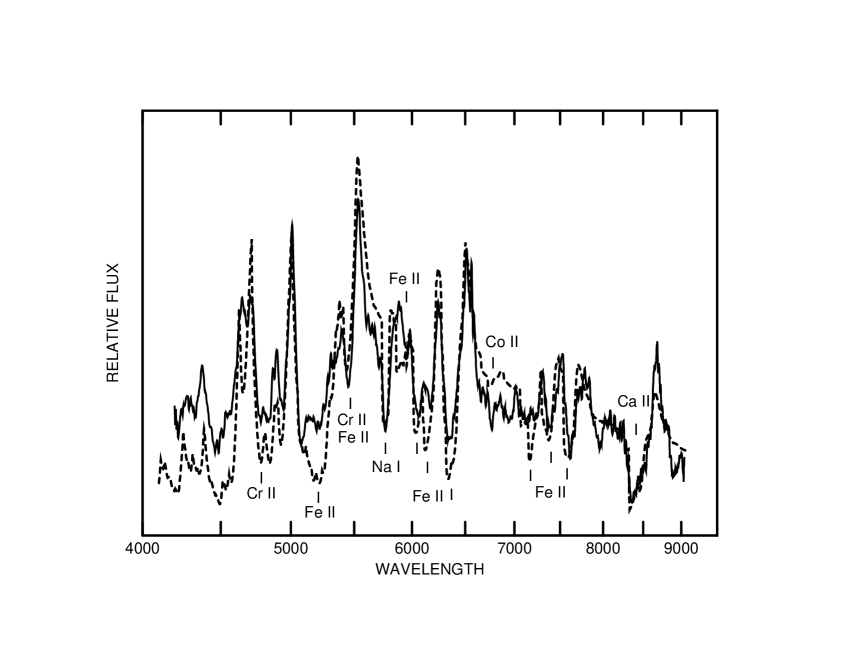
Figure 7 shows a comparison of the day 56 spectrum with a synthetic spectrum that has = 2000 km s-1, K, and the same five ions as used for the day 12 and day 25 spectra. The ion–specific input parameters are in Table 4. In the synthetic spectrum the Fe II, Co II, and Cr II lines are forming between 2000 and 7000 km s-1, Ca II between 2000 and 8000 km s-1, and Na I between 5000 and 8000 km s-1, all with flat optical–depth distributions. (The fit was slightly improved by using an excitation temperature of 5000 K for Fe II, Co II, and Cr II instead of the default value of 7000 K that was used at previous epochs.) In spite of its imperfections (especially in the 6600 to 7200 Å region) the fit in Figure 7 is good enough to indicate that our present interpretation of the spectrum is correct. At 56 days postmaximum SN 2002cx had not yet made the transition to a nebular–phase spectrum.
3 DISCUSSION
Figures 3 and 4 strongly suggest the presence of weak Si II and S II features in the near–maximum spectra of SN 2002cx, which strengthens the connection between SN 2002cx and SN 1991T–like events. The resemblance of the sped up synthetic spectrum for SN 2002cx to the observed spectrum of SN 1997br (Figure 4) raises several questions including the following. First, do the similar line optical depths in the two events mean that the spectra were forming in similar compositions at similar temperatures, although at different velocities? This question can be answered only by means of detailed spectrum calculations (e.g., Lentz et al. 2001; Höflich et al. 2002). Second, the Si II and S II features are not detectable in the day 16 spectrum of SN 2002cx, although they were conspicuous at the same epoch (and even later epochs) of SNe 1991T and 1997br. Did SN 2002cx develop conspicuous Si II and S II features at some time between day and day 12? This of course cannot be answered until a SN 2002cx–like event is observed at such phases. Third, did the near–maximum spectrum of SN 1997br contain all of the same weak features as SN 2002cx, including the ones we have not identified, but smeared out beyond recognition by the higher expansion velocities in SN 1997br? This question could be addressed by speeding up a Synow synthetic spectrum that accounts for all of the weak features of SN 2002cx, if such a synthetic spectrum can be constructed.
For days 12, 25, and 56, the agreement between the synthetic and observed spectra establishes that these are resonance–scattering spectra dominated by lines of Fe II and Co II. The relative optical depths of the Fe II and Co II reference lines (2, 1.67, and 2 at the three epochs) are constant within our fitting freedom. The line–formation velocities are low: 7000 to 9000 km s-1, 5000 to 7000 km s-1, and 2000 to 7000 km s-1 at the three epochs. The outer boundary of the line–formation region of 7000 km s-1 at days 25 and 56 can be compared to values of 13,500, 12,500, and 10,000 km s-1 at which we placed Fe II optical–depth discontinuities in SNe 2000cx at 32 days after maximum (Branch et al. 2004), SN 1997br at 38 days after maximum (Hatano et al. 2002), and SN 1991T at 59 days postmaximum (Fisher et al. 1999). We have begun a comparative study of SN Ia postmaximum spectra to explore the extent to which the differences between SN 2002cx and other SNe Ia are due just to the low velocity of the line-formation region, or also to different line optical depths. Thanks to the low velocity of the line–formation region the SN 2002cx postmaximum spectral features can be identified with more confidence than in other SNe Ia. The comparative study will lead to improved line identifications in other SNe Ia, and clarify our understanding of when the transition from the permitted–line to the forbidden–line phase occurs.
Near maximum light SN 2002cx had normal colors and a high–excitation SN 1991T–like spectrum, but a low expansion velocity and a low luminosity. After maximum the spectra rapidly developed strong permitted lines of Fe II and Co II that persisted to at least 56 days postmaximum. At all epochs the velocities were low, which implies low kinetic energy. L03 discussed the properties of one dimensional (1D) explosion models and concluded that no published model can account for SN 2002cx. One basic problem is that if practically all of the ejected mass was burned from carbon and oxygen to iron–group elements, which at first glance the spectra seem to suggest, then the kinetic energy per unit mass and the expansion velocities of SN 2002cx should be high rather than low.
Recently 3D explosion models, both deflagrations and delayed detonations, have begun to appear. According to Gamezo, Khokhlov, & Oran (2004), 3D deflagration models cannot account for normal SNe Ia because they produce too little kinetic energy, too little radioactive nickel, and too much unburned carbon and oxygen at low velocity; Gamezo et al. argue that normal SNe Ia require a delayed detonation. Also, the composition structure of 3D deflagrations is too clumpy to be able to produce deep Si II absorptions (Thomas et al. 2002), such as are observed not only in normal SNe Ia but also in the peculiar SN 1991bg–like events. However, SN 2002cx is quite unlike both normal SNe Ia and SN 1991bg–like events, and its unusual properties may be consistent with a 3D deflagration model. Its kinetic energy and luminosity were low, and deep Si II lines were not observed (although we must keep in mind that the spectrum was not observed between day and day 12). And perhaps it is not true that practically all of the carbon and oxygen was burnt to iron–peak elements. Unburned carbon and oxygen at low velocity, coexisting with or beneath a substantial mass of iron–peak elements, may be difficult to detect owing to the “iron curtain”: ubiquitous line blocking by Fe II lines forming at similar or higher velocities (see Baron, Lentz, & Hauschildt 2003). In a forthcoming paper we will return to the issue of low–velocity carbon and oxygen in an analysis of second–season spectra of SN 2002cx, obtained eight and nine months after explosion.
Another possibility is that a substantial asymmetry is involved. Kasen (2004) and Kasen et al. (2004) have suggested that a normal SN Ia viewed down the hole in the ejecta caused by the presence of a nondegenerate companion star (Marietta et al. 2000) would have some characteristics of SN 1991T–like events. They mention that a subluminous SN 1991bg–like event viewed down the hole might have some of the properties of SN 2002cx. This idea deserves further attention.
SN 2002cx was an observationally rare event (but perhaps not unique; see Filippenko & Chornock 2002 on SN 2003gq). Observations of many more SNe Ia should reveal whether some events have properties between those of SN 2002cx and other SNe Ia, or that SN 2002cx–like events comprise a distinct sub–type of SNe Ia.
We are grateful to S. Jha for helpful discussions. This work has been supported by NSF grants AST-0204771, AST-0307323, AST-0307894, and NASA grant NAG 5-12127.
References
- (1)
- (2) Baron, E., Lentz, E. J., & Hauschildt, P. H. 2003, ApJ, 588, L29
- (3)
- (4) Branch, D. 2004, in 3D Signatures of Stellar Explosions, ed. P. Höflich (Cambridge: CUP), in press
- (5)
- (6) Branch, D., et al. 2003, AJ, 126, 1489
- (7)
- (8) Branch, D., et al. 2004, ApJ, 606, 413
- (9)
- (10) Filippenko, A. V. 1997, ARAA, 35, 309
- (11)
- (12) Filipppenko, A. V., et al. 1992a, ApJ, 384, L15
- (13)
- (14) Filipppenko, A. V., et al. 1992b, AJ, 104, 1543
- (15)
- (16) Filippenko, A. V., & Chornock, R. 2003, IAU Circ. No. 8211
- (17)
- (18) Fisher, A., Branch, D., Hatano, K, & Baron, E. 1999, MNRAS, 304, 67
- (19)
- (20) Gamezo, V. N., Khokhlov, A. M., & Oran, E. S. 2004, Phys. Rev. Lett., 92, 211102
- (21)
- (22) Gerardy, C. L., et al. 2004, ApJ, submitted; (astro-ph/0309639)
- (23)
- (24) Hatano, K., Branch, D., Fisher, A., Millard, J., & Baron, E. 1999, ApJS, 121, 233
- (25)
- (26) Hatano, K., Branch, D., Qiu, Y. L., Baron, E., Thielemann, F.-K., & Fisher, A. 2002, New Astr., 7, 441
- (27)
- (28) Höflich, P., Gerardy, C., Fesen, R., & Sakai, S. 2002, ApJ, 568, 791
- (29)
- (30) Kasen, D. 2004, in 3D Signatures of Stellar Explosions, ed. P. Höflich (Cambridge: CUP), in press
- (31)
- (32) Kasen, D., Nugent, P., Thomas, R. C., & Wang, L. 2004, ApJ, in press; astro–ph/0311009
- (33)
- (34) Kasen, D., et al. 2003, ApJ, 593, 788
- (35)
- (36) Lentz, E. J., Baron, E., Branch, D., & Hauschildt, P. H. 2001, ApJ, 557, 266
- (37)
- (38) Li, W., et al. 1999, AJ, 117, 2709
- (39)
- (40) Li, W., et al. 2001, PASP, 113, 1178
- (41)
- (42) Li, W., et al. 2003, PASP, 115, 453 (L03)
- (43)
- (44) Marietta, E., Burrows, A., & Fryxell, B. 2000, ApJS, 128, 615
- (45)
- (46) Mazzali, P. A., Danziger, I. J., & Turatto, M. 1995, A&A, 297, 509
- (47)
- (48) Thomas, R. C., et al. 2002, ApJ, 567, 1037
- (49)
- (50) Thomas, R. C., et al. 2004, ApJ, 601, 1019
- (51)
- (52) Wang, L., et al. 2003, ApJ, 591, 1110
- (53)


| ion | (ref) | (ref) | ||||
|---|---|---|---|---|---|---|
| (Å) | (km s-1) | (km s-1) | (km s-1) | (K) | ||
| Si II | 6347 | 0.5 | 7000 | 1000 | 7000 | |
| Si III | 4553 | 0.7 | 7000 | 1000 | 13,000 | |
| S II | 5454 | 0.5 | 7000 | 1000 | 9000 | |
| Ca II | 3934 | 3.0 | 7000 | 1000 | 5000 | |
| Ti II | 4550 | 0.1 | 7000 | 1000 | 5000 | |
| Fe III | 4420 | 1.5 | 7000 | 1000 | 13,000 |
| ion | (ref) | (ref) | ||||
|---|---|---|---|---|---|---|
| (Å) | (km s-1) | (km s-1) | (km s-1) | (K) | ||
| Na I | 5890 | 0.5 | 7000 | 9000 | 5000 | |
| Na I | 5890 | 0.5 | 9000 | 13,000 | 2000 | 5000 |
| Ca II | 3934 | 2.0 | 7000 | 9000 | 5000 | |
| Ca II | 3934 | 2.0 | 9000 | 13,000 | 2000 | 5000 |
| Cr II | 4240 | 3.0 | 7000 | 9000 | 7000 | |
| Fe II | 5018 | 40 | 7000 | 9000 | 7000 | |
| Co II | 4161 | 20 | 7000 | 9000 | 7000 |
| ion | (ref) | (ref) | ||||
|---|---|---|---|---|---|---|
| (Å) | (km s-1) | (km s-1) | (km s-1) | (K) | ||
| Na I | 5890 | 0.4 | 5000 | 9000 | 5000 | |
| Ca II | 3934 | 300 | 5000 | 9000 | 5000 | |
| Cr II | 4240 | 3.0 | 5000 | 7000 | 7000 | |
| Fe II | 5018 | 100 | 5000 | 7000 | 7000 | |
| Co II | 4161 | 60 | 5000 | 7000 | 7000 |
| ion | (ref) | (ref) | ||||
|---|---|---|---|---|---|---|
| (Å) | (km s-1) | (km s-1) | (km s-1) | (K) | ||
| Na I | 5890 | 0.5 | 5000 | 8000 | 5000 | |
| Ca II | 3934 | 120 | 2000 | 8000 | 5000 | |
| Cr II | 4240 | 9.0 | 2000 | 7000 | 5000 | |
| Fe II | 5018 | 80 | 2000 | 7000 | 5000 | |
| Co II | 4161 | 40 | 2000 | 7000 | 5000 |