First XMM-Newton study of two Narrow–Line Seyfert 1 galaxies discovered in the Sloan Digital Sky Survey††thanks: Based on public observations obtained with XMM-Newton, an ESA science mission with instruments and contributions directly funded by ESA Member States and the USA (NASA).
The Early Data Release of the Sloan Digital Sky Survey (SDSS) contains 150 Narrow–Line Seyfert 1 (NLS1) galaxies, most of them previously unknown. We present here the study of the X–ray emission from two of these active galaxies (SDSS J and SDSS J), based upon XMM-Newton observations. The spectral and timing characteristics of the two sources are presented and compared against the typical properties of known NLS1 galaxies. We found that these two NLS1 are within the dispersion range of the typical values of this class of AGN, although with some interesting features that deserve further studies.
Key Words.:
X-rays: galaxies — Galaxies: individual: SDSS J — Galaxies: individual: SDSS J1 Introduction
The first studies of Markarian 359 (Davidson & Kinman 1978) and of similar objects led to the identification of a peculiar subclass of Seyfert galaxies: the Narrow-Line Seyfert 1 galaxies (NLS1) (Osterbrock & Pogge 1985, Goodrich 1989). Such objects presented an intriguing mixture of physical phenomena, which made them very attractive and popular during the last decade. Their distinctive optical characteristics are km/s, weak [OIII] and strong Fe II relative to H, particularly [OIII]/H (see Grupe 2000, and Pogge 2000 for a review).
Stephens (1989) suggested that X–ray selection could be an efficient method to identify NLS1. Since then, many efforts have been devoted in analysing X–ray data of NLS1, mainly thanks to the satellites ROSAT, ASCA, and more recently XMM-Newton and Chandra. NLS1 typical characteristics in the X–ray domain are the presence of a soft X-ray excess, probably the high-energy tail of the radiation emitted from the accretion disk, a pronounced variability (NLS1 are the most variable AGNs known after blazars), and a steep photon index (e.g. Puchnarewicz et al. 1992, Boller et al. 1996, Wang et al. 1996, Grupe et al. 1998, 1999, Leighly 1999a,b). From all these studies, it resulted that NLS1 could have the smallest central BH mass among all AGN (as low as ) and super–Eddington accretion rates (e.g. Wang et al. 1996).
Since most of NLS1 are X-ray selected, it is not clear if the above mentioned characteristics are typical of these objects or are the result of a biased selection. For example, it is worth mentioning that some NLS1 could have X-ray behaviour similar to Seyfert 1 (see Fig. 8 of Boller et al. 1996). Therefore, it is necessary to try the inverse operation of selection, i.e. to study the X-ray characteristics of a large sample of optically selected NLS1. In this respect, the 150 NLS1 found in the Early Release of the Sloan Digital Sky Survey (SDSS111http://www.sdss.org/) by Williams et al. (2000) represent a valuable starting point.
In order to pursue this goal, the XMM-Newton public archive has been searched for coincidental position with SDSS galaxies of the sample of Williams et al. (2000). Two SDSS sources, SDSS J () and SDSS J (), turned out to be in the XMM-Newton observed fields. The distance of the sources from the boresight was and , respectively. For the sake of simplicity, they will be thereafter called SD1 and SD2, respectively. These sources were already observed in X–rays only by ROSAT (see Williams et al. 2002), and therefore the analysis of XMM-Newton data presented here represent the first keV study.
In this paper, km s-1 Mpc-1 is assumed throughout.

2 observation and data reduction
For the processing, screening, and analysis of the data from the EPIC MOS1 and MOS2 (Turner et al. 2001) and PN cameras (Strüder et al. 2001), standard tools have been used (XMM SAS v. 5.4.1 and HEAsoft Xspec 11.3.1 and Xronos 5.19) and standard procedures described in Snowden et al. (2002) followed. The observations of both sources were affected by solar soft-proton flares, so that a cleaning was necessary.
To study variability, the lightcurves from EPIC-PN data were extracted, since this detector has the best time resolution in full frame mode ( ms) and the highest throughput. The source region was centered in the optical position of the two NLS1, , for SD1, and , for SD2 (J2000, SDSS uncertainty , Pier et al. 2003), with a radius of and , respectively. The background to be subtracted in the analysis was derived from an annular region with maximum radius of for SD1, and from a circular region wide near the source for SD2. The different radii of extraction were due to the position of the source in the detector chip (closeness to gaps).
Data from the same regions were also used for the spectral analysis. The spectra were rebinned so that each energy bin contained a minimum of 25 counts, and fitted only in the keV energy range because of the uncertainties in the MOS cameras calibration at lower energies (cf. Kirsch 2003). The photon redistribution matrix and the related ancillary file were created appropriately with the rmfgen and arfgen tasks of XMM-SAS.
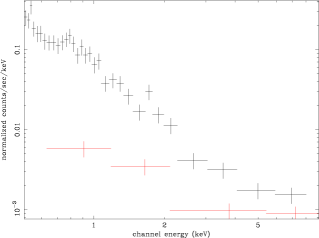
Despite the high background, and the low statistics (particularly for SD1), the signal is significantly higher when compared to the background level, up to high energy (Fig. 1). Therefore, any feature at high energy can be due to the source.


3 SDSS J (SD1)
The source SD1 was in the field of view of the ObsID during the observation performed on . All the EPIC detectors were set in full frame mode and collected data for an elapsed time of s. However, the presence of soft–proton flares reduced the effective exposure to ks for both MOS and ks for PN.
The source displays a hint of variability (Fig. 2), with the probability of constancy less than %, and of a s periodicity () in the energy band keV. However, the low statistics prevents more detailed studies. Longer and unflared observations are needed to assess this feature.
We started the spectral analysis by fitting the average spectrum integrated over the whole effective exposure, with a simple power law model and the Galactic absorption along the line of sight ( cm-2, Dickey & Lockman 1990). This resulted in a steep () spectrum, but with a low statistical quality (, dof). The ratio data/model clearly shows excesses below keV and above keV (Fig. 3). The excess at high energy cannot be due to residual background, as shown in Fig. 1.
The addition of a redshifted thermal component (zbb model in xspec) with keV improved significantly the fit (, dof). In this case, the photon index of the power law model decreases to , but still with some residuals at high energy. The fit with a gaussian emission line fixed at keV with a width keV was rejected (, dof), and also other models, like the constant density ionized model by Ross & Fabian (1993), or the reflection by ionized material by Magdziarz & Zdziarski (1995), were not successfully constrained.
A partial covering (pcfabs model in xspec) appears to be the best fit model (, dof), with cm-2, a covering factor of , and a photon index . In this case, the observed flux in the energy band keV is erg cm-2 s-1, corresponding to an intrinsic luminosity of erg/s.
4 SDSS J (SD2)
The source SD2 was observed on in the field of view of the ObsID , with an elapsed time of s. All the EPIC camera detectors were set in full frame mode. Because of the presence of soft–proton flares, the effective exposures were about ks for both MOS and ks for PN.

The source does not show statistically significant variability (Fig. 4), the probability of constancy being greater than %, depending on the bin width ( s). This appears to be unusual, given the well known variability of the NLS1 in the X-ray energy band: Leighly (1999a) reported variability with at least % confidence level. The steady flux is, however, understandable if the cause of variability is mainly a flare–like phenomenon. In this case, we were observing a period without flares.


Therefore, it is reasonable to study only the averaged spectrum integrated over the whole period. The first fit was obtained with a simple power law model (), with the Galactic absorption toward SD2 ( cm-2, Dickey & Lockman 1990). The result is shown in Fig. 5: soft and hard excesses are clearly visible (, dof). To fit the soft excess we adotped the redshifted black body (zbb model in xspec) with keV. The photon index decreases to , and the fit improves to for dof. The thermal component is required at %.
An excess at energies greater than keV remained in the data still after having used different procedures in the cleaning for soft–proton flares, but the comparison with the background (Fig. 1) confirms that the excess is real. To model this hard X-ray excess, we tried with a simple large gaussian line at keV, keV, and equivalent width eV. This line is required at % level, and improves the fit to for degrees of freedom. The thermal component is now keV and the photon index is . This is the best fit model for this source (Fig. 5, right). The observed flux in the energy band keV is erg cm-2 s-1, corresponding to an intrinsic luminosity of erg/s.
We tried also a partial covering, obtaining cm-2, a fraction of , and a photon index . The fit, with for degrees of freedom, is worse than the previous one.
Also the Ross & Fabian (1995) model does not provide a good fit (, dof). In this case, we found that the ionization parameter is , with a reflection fraction of , and .
5 Observations at other wavelengths
5.1 SDSS J (SD1)
The optical counterparts of SD1 have been found in 2MASS (Cutri et al. 2003) and USNO B1 (Monet et al. 2003) catalogs. The 2MASS position is and (J2000, uncertainty ), consistent with that of SDSS. The source was detected with magnitudes , , and . The USNO B1 catalog provides the magnitudes in two periods: (1) Palomar Observatory Sky Survey (POSS) I, (), with emulsion sensitive at wavelengths in the range nm; (2) POSS II (), sensitive at nm. These are: , , and , , plus . The detections in the two periods do not show variability within the measurement errors. Also in this case, the position found (, , J2000) matches that of the SDSS.
5.2 SDSS J (SD2)
For this source, in addition to the counterparts in the 2MASS and USNO B1 catalog, a radio counterpart was also found in the FIRST222http://sundog.stsci.edu/ and NVSS333http://www.cv.nrao.edu/nvss/ surveys, both at GHz ( cm). The FIRST survey was performed between and , while the NVSS was done between and . The source appears to be compact, with a peak flux is mJy (NVSS).
This galaxy appears to be very bright in the optical/infrared wavelengths: the 2MASS catalog reports a clear detection with all filters: , , . The USNO B1 catalog gives these values: , , , , and , showing a substantial degree of variability. Specifically, it is worth noting the change of about magnitudes in the B band between the two reference periods.
6 Discussion
We presented here the first analysis in a wide X-ray energy band ( keV) performed to date on two Narrow–Line Seyfert 1 Galaxies from the optically selected sample of Williams et al. (2002). By comparing the spectral parameters obtained for the present sources with the average values found by Leighly (1999a,b), it is clear that the X-ray characteristics are in the ranges of the NLS1. The mean value of the photon index found by Leighly (1999b) is , with a dispersion of , for NLS1, and , with a dispersion of for Seyfert 1 active nuclei. These values should be compared with the photon index of for SD1 and for SD2. SD1 appears steeper than the mean value of Leighly, but it is worth noting that a steep photon index can still be likely (see Fig. 8 by Boller et al. 1996).
Only SD1 displays a certain degree variability, although the limited effective exposure ( ks) prevents further studies. SD2 does not show variability, but this could be explained with a period of quiescence. To compare the present fluxes with the ROSAT observations, we converted, with WebPIMMS444http://heasarc.gsfc.nasa.gov/Tools/w3pimms.html, the PSPC count rates into the flux in the band keV, by using the Galactic and the photon index reported by Williams et al. (2002). The calculated observed flux is erg cm-2 s-1 for SD1 and erg cm-2 s-1 for SD2. The corresponding fluxes from the present XMM-Newton observations are erg cm-2 s-1 and erg cm-2 s-1, respectively, confirming the variability of both sources, particularly for SD2.
Both sources present an excess at high energy, that could be explained by a partial covering model for SD1 and by a gaussian line for SD2. The partial covering has been successfully used to explain similar hard X-ray excesses in H (Grupe et al. 2004, Gallo et al. 2004a, Tanaka et al. 2004). However, it is worth stressing that for SD1 the statistics is not enough to reach firm conclusions.
The large gaussian emission line used to fit the excess in SD2 can be the indication of light bending around a Kerr black hole, like, for example, the case of PHL (Gallo et al. 2004b) or reflection from ionized disc, used also for H (Fabian et al. 2004). Indeed, for SD2, the constant density ionized disc model by Ross & Fabian (1993) gives acceptable fits, even though worse with respect to the simpler phenomenological model of the gaussian emission line.
Dedicated observations with higher statistics are needed to assess the spectral parameters of SD1 and SD2. Moreover, in order to understand if the characteristisc of NLS1 are biased by the X-ray selection, it is necessary to enlarge the sample of observed galaxies in X-ray from the optically selected sample of Williams et al. (2002).
Acknowledgements.
LF acknowledges partial financial support by the Italian Space Agency (ASI). LF wishes to thank M. Cappi, P. Severgnini, and R. Williams for useful discussions. This publication has made use of public data obtained from the High Energy Astrophysics Science Archive Research Centre (HEASARC), provided by NASA Goddard Space Flight Centre.References
- (1) Boller T., Brandt W.N., Fink H., 1996, A&A 305, 53
- (2) Cardelli J.A, Clayton G.C., Mathis J.S., 1989, ApJ 345, 245
- (3) Cox A.N. (editor), 2000, Allen’s Astrophysical Quantities. IV Edition, Springer, New York
- (4) Cutri R.M., Skrutskie M.F., van Dyk S., et al., 2003, 2MASS All–Sky Catalog of Point Sources. University of Massachusetts and Infrared Processing and Analysis Center, (IPAC/California Institute of Technology)
- (5) Davidson M.K. & Kinman T.D., 1978, ApJ 225, 776
- (6) Dickey J.M. & Lockman F.J., 1990, ARAA 28, 215
- (7) Fabian A.C., Miniutti G., Gallo L., et al., 2004, MNRAS, accepted for publication (astro-ph/0405160)
- (8) Gallo L.C., Tanaka Y., Boller T., et al., 2004a, MNRAS, accepted for publication (astro-ph/0405159)
- (9) Gallo L.C., Boller T., Brandt W.N., et al., 2004b, MNRAS 352, 744
- (10) Goodrich R.W., 1989, ApJ 342, 224
- (11) Grupe D., 2000, New Astr. Rev. 44, 455
- (12) Grupe D., Beuermann K., Thomas H.C., et al., 1998, A&A 330, 25
- (13) Grupe D., Beuermann K., Mannheim K., Thomas H.C., 1999, A&A 350, 805
- (14) Grupe D., Mathur S., Komossa S., 2004, ApJ 127, 3161
- (15) Kirsch M., 2003. EPIC status of calibration and data analysis. XMM-SOC-CAL-TN-0018, v. 2.1, 4 April 2003.
- (16) Leighly K.M., 1999a, ApJS 125, 297
- (17) Leighly K.M., 1999b, ApJS 125, 317
- (18) Magdziarz P. & Zdziarski A.A., 1995, MNRAS, 273, 837
- (19) Monet D.G., Levine S.E., Casian B., et al., 2003, AJ 125, 984
- (20) Osterbrock D.E. & Pogge R.W., 1985, ApJ 297, 166
- (21) Pier J.R., Munn J.A., Hindsley R.B., et al., 2003, AJ 125, 1559
- (22) Pogge R.W., 2000, New Astr. Rev. 44, 381
- (23) Puchnarewicz E.M., Mason K.O., Córdova F., et al., 1992, MNRAS 256, 589
- (24) Ross R.R. & Fabian A.C., 1993, MNRAS 261, 74
- (25) Snowden S., Still M., Harrus I. et al., 2002. An introduction to XMM-Newton data analysis. Version 1.3, 26 September 2002.
- (26) Stephens S., 1989, AJ 97, 10
- (27) Strüder L., Briel U., Dennerl K., et al., 2001, A&A 365, L18
- (28) Tanaka Y., Boller T., Gallo L., et al., 2004, (astro-ph/0405158)
- (29) Turner M.J., Abbey A., Arnaud M., et al., 2001, A&A 365, L27
- (30) Wang T., Brinkmann W., Bergeron J., 1996, A&A 309, 81
- (31) Williams R.J., Pogge R.W., Mathur S., 2002, AJ 124, 3042