Radio and near-infrared observations of the steep spectrum Galactic plane radio source WKB 031457.8
Abstract
Radio and near-infared observations towards the steep spectrum Galactic plane radio source WKB 031457.8 are presented, in order to clarify the nature of this source. The radio observations include archival and survey data, together with new Giant Metrewave Radio Telescope observations at 617 MHz. The near-infrared observations are in the and bands, from the Gemini instrument on the Shane 3-m telescope. The radio observations show that WKB 031457.8 is extended, with an very steep spectrum (with between MHz and GHz). The colour–magnitude diagram constructed from near-infrared observations of the field suggests the presence of a galaxy cluster behind the Galactic plane, reddened by about 6 magnitudes of visual extinction. Although the steep spectrum source has no obvious identification, two other radio sources in the field covered by the near-infrared observations have tentative identifications with galaxies. These observations indicate that WKB 031457.8 is a relic source in a cluster of galaxies, not a pulsar.
keywords:
galaxies: clusters: general – radio continuum: galaxies – infrared: galaxies1 Introduction
The radio source WKB 031457.8 was first catalogued by Williams, Kenderdine & Baldwin (1966), with a flux density of 43 Jy at 38 MHz. This source is close to the Galactic plane, near , , and also appears as a relatively bright source in other low frequency radio surveys (e.g. the Clark Lake surveys at 26.3 MHz and 30.9 MHz by Viner & Erickson 1975 and Kassim 1988 respectively; the UTR-2 survey at several frequencies between 12.6 and 25 MHz by Braude et al. 1988; the 8C survey at 38 MHz by Rees 1990 and Hales et al. 1995). Williams et al. noted that although this source was not in the 4C interferometric survey, it was in the 4CT ‘pencil beam’ survey of Crowther & Clarke (1966). However, this source is not listed in Crowther & Clarke, nor in the published 4CT survey catalogue (Caswell & Crowther 1969). It is listed – as ‘4C 57.06A’ – in Caswell (1966), with a flux density of 3 Jy at 178 MHz, which implies a very steep radio spectral index, of greater than 1.5 (here is defined in the sense that flux density, , scales with frequency as ). Caswell also noted that the flux density of this source as observed in the 4C interferometric survey on a 469 baseline is 0.57 of the flux density detected with the 4CT pencil beam observations, which implies the source is extended on the scale of several arcminutes. Erickson & Kassim (1985) noted that the steep spectrum of the source, and its proximity to the Galactic plane, make it a pulsar candidate, although the lack of scintillations (see, for example, Purvis et al. 1987) argue against a pulsar identification, as does the fact noted above that the source is several arcmin in extent. Subsequently this source has also been observed in other radio surveys, and identified as an unusually steep spectrum source. Green (1991) identified a source, 26P 218, observed 408 MHz in a Galactic plane survey centred at , as having a steep radio spectrum, and Lacy (1992) identified the source as the steepest low-frequency spectrum of any source in both the 8C (at 38 MHz) and 6C (at 151 MHz) catalogues. Both authors favoured identifying this source as an unusually steep spectrum relic or halo source in a cluster, rather than a pulsar, although the observations then available meant this was not a certain conclusion. In particular, its position close to the Galactic plane means that optical identification is difficult.
Here we present additional radio and infrared observations which, together with observations from the literature or archives, confirm that this source is a steep spectrum cluster source, not a pulsar. Details of the radio and infrared observations are given in Sections 2 and 3 respectively, are these are discussed in Section 4.
2 Radio Observations
2.1 GMRT Observations at 617 MHz
The field of WKB 031457.8 was observed with the Giant Metrewave Radio Telescope (GMRT; see Rao 2002) at frequencies near 618 MHz, on 2001 December 13 for about 2.3 hours. These observations were made during the commissioning of the telescope, and typically about 25 of the 30 antennas of the GMRT were available. The observations were made with a single 16 MHz sideband, centred at 618 MHz, using 128 spectral channels, for both right and left Stokes parameter. The bright calibrator sources 3C48 and 3C286 were observed at the beginning and end of the observing session respectively, to provide the flux density and bandpass calibration. A secondary calibrator, 0432416, was observed for min every min to monitor the overall amplitude and phase stability of the telescope. The data were calibrated using standard procedures using classic AIPS (Bridle & Greisen 1994). A few channels near the centre of the band were inspected, and obvious interference was flagged. These central channels were then averaged, applying an antenna-based bandpass correction derived from the bright sources 3C48 and 3C286. The observations of the secondary calibrators were then used to measure the antenna-based amplitude and phase variations throughout the observations. The overall flux density scale was set by the observations of the primary calibrators. The calibrated data were inspected, and further interference was identified and flagged. Several channels at each end of band were omitted, due to uncertain bandpass corrections, and the resulting data – with an effective bandwidth of 13.8 MHz centred at 617.3 MHz – were averaged into just 10 channels, to avoid bandwidth smearing problems.

The GMRT consists of 30 antennas each 45 m in diameter, 12 in a central region km in extent, with the others in three arms, providing baselines up to km, i.e. k at 617 MHz, with a primary beam response of deg full width half maximum (FWHM). Fig. 1 shows a low-resolution ( arcsec) image of WKB 031457.8 from the GMRT observations – which is comparable in resolution to other images shown below – by using only data from baselines shorter than 4 k. The image is Stokes parameter I, from both the right and left circular polarisations observed, and the noise is mJy beam-1. The coordinates are J2000.0, which are used for all images presented here. Fig. 1 shows three relatively bright sources around a fainter extended source, which we designate A, B, C, and D respectively. (A higher resolution, arcsec, image of these sources is also presented below, in Fig. 8.)

2.2 CLFST observations at 151 MHz
Lacy (1992) presented an image of WKB 031457.8 made with the Cambridge Low-Frequency Synthesis Telescope (CLFST, see McGilchrist et al. 1990; Rees 1990) at 151 MHz which we reproduce here. A total of eight 12-hour CLFST observations of the source were made, between 1989 September 2 and 1990 October 13. These observations were processed using standard procedures used for CLFST analysis (e.g. McGilchrist et al.), including correction for time varying ionospheric phase gradients across the telescope. The final image, Fig. 2 – which has a noise of mJy beam-1 – is a weighted sum of the eight observations. This image is dominated by source D, which is clearly extended.


2.3 Archive and Survey Radio Observations
In addition to the GMRT and CLFST radio observations of WKB 031457.8 presented above, there are several other sources of useful radio observations available in archives, or recent surveys. WKB 031457.8 was observed with the Very Large Array (VLA) of the National Radio Astronomy Observatory111The National Radio Astronomy Observatory is a facility of the National Science Foundation operated under cooperative agreement by Associated Universities, Inc. in D-array at 1.5 GHz for about 1.4 hours on 1990 January 25. We obtained these observations from the online VLA archive, and processed them using classic AIPS procedures. Fig. 3 show the resulting synthesised image, which has a r.m.s. noise of mJy beam-1. This image was made from data observed in two 50 MHz bands, centred at 1465 and 1515 MHz, so is at an effective frequency of 1490 MHz. Sources A, B and C are relatively bright and well defined in this image, but source D is faint, and extended, and not well defined.
WKB 031457.8 is also included in the WENSS survey (Rengelink et al. 1997) at 327 MHz. Fig. 4 shows the image of WKB 031457.8 from this survey. In this image source D is relatively much brighter than at the higher frequencies, and it along with sources A, B and C, is well defined.
3 Near-infrared observations
The field of WKB 031457.8 was observed in the near-infrared and -bands with the Gemini instrument at Lick Observatory on 2002 August 27. Gemini is a near-infrared imaging camera with long and short wavelength channels operated at the Cassegrain focus of the Shane 3-m telescope. Radiation entering the instrument is passed through a dichroic beam splitter into two arms, short wavelengths ( m) are transmitted to a NICMOS3 HgCdTe array from Rockwell International, and longer wavelengths to a InSb array from SBRC, also with pixels. Both arrays have scales of 0.7 arcsec pixel-1, giving a arcmin2 field of view. We observed with a -filter in the short arm and a filter in the long arm. The two arms are not quite confocal, so we set the telescope focus to give the best focus in -band. We observed two pointings, one covering both sources C and D, and one covering source B. We observed both pointings in a 9-point grid for two minutes per point, using 24 coadds of 5 s exposures in -band and 3 coadds of 40 s in . The data were flux calibrated using the standards P138-C and S754-C from the list of Persson et al. (1998).
The data were dark subtracted, flat-fielded using twilight flats. The dimsum package in IRAF (Stanford, Eisenhardt & Dickinson 1995) was then used to subtract a running median background image made from the nine frames closest in time to each image, and to coadd the data into the final mosaics. Astrometric plate solutions were derived using the positions of Two-Micron All Sky Survey (2MASS) stars in the images, with the resulting astrometry accurate to arcsec.
| source | flux density/mJy | ||
|---|---|---|---|
| WENSS | GMRT | VLA | |
| 327 MHz | 617 MHz | 1490 MHz | |
| A | 89 | 61 | 33 |
| B | 221 | 150 | 76 |
| C | 103 | 62 | 34 |
| D | 458 | 52 | 6 |
4 Discussion and Conclusions
The integrated flux densities of the sources A, B, C, and D from the WENSS 327 MHz, GMRT 617 MHz and VLA 1490 MHz observations are given in Table 1. The WENSS flux densities are taken from the WENSS catalogue, which lists source B, C, and D as components of a multi-component source. The other flux densities are estimated from the images shown above. Generally these flux densities are to be accurate to better than 10 per cent. However, since source D is faint at 1490 MHz, and is extended (see Fig. 3), its flux density is difficult to measure accurately. From these flux densities, it is, however, clear that it is source D that has an unusually steep spectrum, and it must be associated with the relatively bright source observed in various surveys at lower frequencies.
| frequency | flux density | estimate error | source | reference |
| /MHz | /Jy | /Jy | ||
| 16.7 | 83 | 10.0 | UTR-2 | Braude et al. (1988) |
| 26.3 | 88 | 10 | Clark Lake | Viner & Erikson (1975) |
| 30.9 | 53.1 | 10.6 | Clark Lake | Kassim (1988) |
| 38.0 | 58.6 | 6 | 8C | Rees (1990); Hales et al. (1995) |
| 38.0 | 43 | 4.3 | WKB | Williams, Kenderdine & Baldwin (1966) |
| 151 | 4.38 | 0.5 | 6C | Hales et al. (1993) |
| 178 | 3.0 | 0.5 | 4CT | Caswell (1966) |
| 327 | 0.458 | 0.046 | WENSS | Rengelink et al. (1997) |
| 617 | 0.052 | 0.005 | GMRT | this work |
| 1490 | 0.006 | 0.0012 | VLA | this work |

The radio spectrum of WKB 031457.8, now associated with source D, is shown in Fig. 5, using the flux densities given in Table 2. For frequencies of 327 MHz and above the flux densities used are for source D only, whereas for the lower frequency observations – with poor resolution – the catalogued sources will be included contributions from the other nearby sources.222For example, the steep spectrum source, 26P 218, in this region that was noted by Green (1991), was identified from observations made at 408 MHz with the Dominion Radio Astrophysical Observatory (DRAO) Synthesis Telescope with a resolution of arcmin2 (EW NS). Given this resolution of these observations, and the proximity of other sources, the 408-MHz flux density of 26P 218 does not correspond solely to source D, and hence it is not included in Fig. 5 and Table 2. However, given the very steep spectrum of source D, these contributions are not large at the lower frequencies. The flux densities are as published, and no attempt has been made to place them on a consistent flux density scale, which is not straightforward at the lower frequencies. Nevertheless, even allowing for uncertainties in the flux density scales of the observations, Fig. 5 clearly shows that WKB 031457.8 has an remarkably steep radio spectrum from MHz to GHz, with . At lower frequencies, the spectrum of this source turns over, which is to be expected from Galactic absorption.
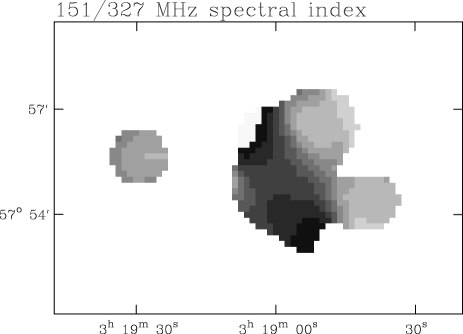
Given the unusually steep radio spectrum of this source, the obvious interpretation as to its nature is either as a pulsar, or as a cluster source, as both of these types of object are known to have very steep radio spectra. In the case of pulsars the emission mechanism produces an intrinsically steep spectrum (e.g. Sieber 1972; Maron et al. 2000), whereas for cluster radio sources, the synchrotron emission from electron populations confinded by the intracluster medium produces steeper spectra with age (e.g. Slingo 1974; Cordey 1987; Slee et al. 2001 respectively). Despite being close to the Galactic plane – which suggests a pulsar identification – the fact that WKB 031457.8 is clearly extended means that it cannot be a pulsar, but is instead likely to be a cluster source, that by chance is close to the Galactic plane. Fig. 6 shows a spectral index image of sources A, B, C and D, from the CLFST and WENSS observations. This shows that the spectral index of source D gradually steepens to the north and south, away from its brightest emission. This variation, and the structure of source D, suggests it is a FR class I source (Fanaroff & Riley 1974), in which spectral ageing of the particles in the lobes produces the very steep radio spectrum seen.

Our infrared observations in this direction are less affected by absorption than optical observations would be, allowing us to make a deep search of any host cluster of WKB 031457.8. The reduced mid-infrared mosaics were run through SExtractor (Bertin & Arnouts 1996) to produce object catalogues, and sources in the and -band images were matched on the basis of position. Due to the poor seeing we have made no attempt at star-galaxy separation. Figure 7 shows the colour–magnitude diagram for the objects in the field. Most objects have colours consistent with them being moderately-reddened stars, but there is evidence for a cluster colour–magnitude sequence with . This is, of course, much redder than seen in low redshift clusters where , but reddening through the Galactic plane is to be expected. We have made an estimate of the redshift of the cluster by assuming that the brightest galaxy on the colour–magnitude sequence is the Brightest Cluster Galaxy (BCG). We assume an intrinsic (unreddened) colour of (for a BCG) compared to a measured and thus estimate the colour excess in , . Using the Milky Way extinction law of Cardelli, Clayton & Mathis (1989) we estimate the extinction in -band, , to be 0.7 magnitudes (corresponding to a visual extinction, , of 5.9), which would make the intrinsic BCG magnitude . We then use the relation of Brough et al. (2002) to estimate a redshift of for the BCG.
On Fig. 7 we also plot the colour–magnitude relation using the mean of the slopes measured by Bower, Lucey & Ellis (1992) for the Coma and Virgo clusters, -corrected using elliptical galaxy corrections from the pegase model (Fioc & Rocca-Volmerange 1997). We plot both the unreddened relation (plotted from a typical brightest cluster galaxy one magnitude brighter than and fainter) and one reddened by , which appears to match the observed sequence fairly well.
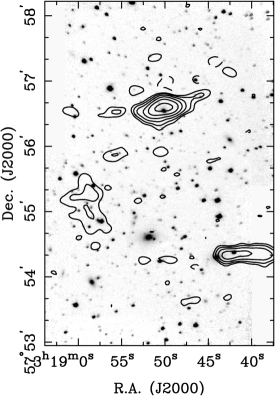
The low resolution of the available radio data, and the crowded nature of the field in the near-infrared make identification of the radio sources uncertain. Figure 8 shows an overlay of contours of a higher resolution 617-MHz radio image on a greyscale of the -band image. The radio image has a resolution of arcsec2 (at a position angle of ), and a noise of mJy beam-1. At this higher resolution, sources B and C are clearly resolved, and are each extended in approximately the east–west direction. Source B is close to a galaxy with at , . The identification of source C is uncertain, there is a , galaxy at the eastern extreme of the radio contours at , which may be at the head of a head-tail source. A bright () stellar object with is located within the radio contours at , but this is most likely a foreground star. Source D is not clearly identified with any particular cluster galaxy.
Assuming WKB 031457.8 is associated with a cluster at , then at 178 MHz its luminosity would be W Hz-1 (for a Hubble constant of 50 km s-1 Mpc-1, as used by Fanaroff & Riley 1974 and Zirbel & Baum 1995 below). This is somewhat high compared with most FR class I sources (e.g. Fanaroff & Riley), but due to its very steep spectrum, at higher frequencies its luminosity is much lower, and is consistent with other FR class I sources (e.g. Zirbel & Baum). Also at this redshift its linear size – from the largest angular extent of arcmin at 151 MHz (Fig. 2) – would be kpc, which is comparable with with the physical sizes of other cluster sources (e.g. Slingo 1974).
In the ROSAT all-sky bright source catalogue (Voges et al. 1999) an X-ray source (1RXS J031902.8575504) is detected nearly coincident with source D. This X-ray source is at , , with a position uncertainty of 16 arcsec, and has a count rate of 0.015 s-1. Although unresolved by the 30-arcsec ROSAT beam, it is plausible that this emission is from the galaxy cluster, heavily attenuated by the gas column of the Milky Way. Using the PIMMS tool333http://heasarc.gsfc.nasa.gov/Tools/w3pimms.html we estimated the X-ray flux from the source in the keV band. We assume a thermal bremsstrahlung spectrum and an absorption column of cm-2, estimated from the optical reddening and a standard Milky Way gas to dust ratio of , where . These assumptions yield an X-ray flux estimate of erg s-1 cm-2. (The flux in the absence of absorption is estimated to be erg s-1 cm-2.) At , this corresponds to an X-ray luminosity of erg s-1, equivalent to a moderately-luminous galaxy cluster.
In conclusion, the extended nature of WKB 031457.8 at radio wavelengths, our mid-infrared identification of a likely cluster in this direction, and the ROSAT X-ray source lead us to conclude that this ultra steep radio source is a cluster source, not a pulsar.
Acknowledgements
We are grateful to Guy Pooley and David Titterington for help accessing the archived CLFST observations. The GMRT is run by the National Centre for Radio Astrophysics of the Tata Institute of Fundamental Research, India. This research has made use of the VizieR catalogue access tool and he SIMBAD database, operated at CDS, Strasbourg, France, and NASA’s Astrophysics Data System Bibliographic Services.
References
- [1] Bertin E., Arnouts S., 1996, A&AS 117, 393
- [2] Bower R. G., Lucey J. R, Ellis R. S, 1992, MNRAS, 254, 601
- [3] Braude S. Ia., Sharykin N. K., Sokolov K. P., Zakcharenko S. M., 1988, ApSS, 111, 1
-
[4]
Bridle A. H., Greisen E. W., 1994, AIPS Memo 87. Available
from
http://www. aoc. nrao. edu/aips/ - [5] Brough S., Collins C. A., Burke D. J., Mann R. G, Lynam P. D, 2002, MNRAS, 329, L53
- [6] Cardelli J. A., Clayton G. C, Mathis J. S, 1989, ApJ, 345, 245
- [7] Caswell J. L., 1966, PhD thesis, University of Cambridge
- [8] Caswell J. L., Crowther J. H., 1969, MNRAS, 145, 181
- [9] Cordey R. A., 1987, MNRAS, 227, 695
- [10] Crowther J. H., Clarke R. W., 1966, MNRAS, 132, 405
- [11] Erickson W. C., Kassim N. E., 1985, BAAS, 17, 566
- [12] Fanaroff B. L., Riley J. M., 1974, MNRAS, 167, 31P
- [13] Fioc M., Rocca-Volmerange B., 1997, A&A, 326, 950
- [14] Green D. A., 1991, A&AS, 88, 355
- [15] Hales S. E. G., Waldram E. M., Rees N., Warner P. J., 1995, MNRAS, 274, 447
- [16] Hales S. E. G., Masson C. R., Warner P. J., Baldwin J. E., Green D. A., 1993, MNRAS, 262, 1057
- [17] Kassim N. E., 1988, ApJS, 68, 715
- [18] Lacy M. D., 1992, PhD thesis, University of Cambridge
- [19] McGilchrist M. M., Baldwin J. E., Riley J. M., Titterington D. J., Waldram E. M., Warner P. J., 1990, MNRAS, 246, 110
- [20] Maron O., Kijak J., Kramer M., Wielebinski R., 2000, A&AS, 147, 195
- [21] Persson S. E., Murphy D. C., Krzeminski W., Roth, M, Rieke M. J, 1998, AJ, 116, 2475
- [22] Purvis A., Tappin S. J., Rees W. G., Hewish A., Duffett-Smith P. J., 1987, MNRAS, 229, 589
- [23] Rao A. P., 2002, in Rao A. P., Swarup G., Gopal-Krishna, eds, IAU Symposium 199, The Universe at Low Radio Frequencies. ASP, San Francisco p. 439
- [24] Rees N., 1990, MNRAS, 244, 233
- [25] Rengelink R. B., Tang Y., de Bruyn A. G., Miley G. K., Bremer M. N., Röttgering H. J. A., Bremer M. A. R., 1997, A&AS, 124, 259
- [26] Sieber W., 1972, A&A, 28, 237
- [27] Slee O. B., Roy A. L., Murgia M., Andernach H., Ehle M., 2001, AJ, 122, 1172
- [28] Slingo A., 1974, MNRAS, 168, 307
- [29] Stanford S. A., Eisenhardt P. R. M., Dickinson, M, 1995, ApJ 450, 512
- [30] Viner M. R., Erickson W. C., 1975, AJ, 80, 931
- [31] Voges W., Aschenbach B., Boller Th., Bräuninger H., Briel U., Burkert W., Dennerl K., Englhauser J., Gruber R., Haberl F., Hartner G., Hasinger G., Krüster M., Pfeffermann E., Pietsch W., Predehl P., Rosso C., Schmitt J. H. M. M., Trümper J., Zimmermann H. U. 1999, A&A, 349, 389
- [32] Williams P. J. S., Kenderdine S., Baldwin J. E., 1966, Mem. R. Astron. Soc., 70, 53
- [33] Zirbel E. L., Baum S. A., 1995, ApJ, 448, 521