A Substantial Population of Red Galaxies at :
Modeling of the Spectral Energy Distributions of an Extended Sample
11affiliation: Based on observations collected at the European
Southern Observatory, Paranal, Chile (ESO LP Programme 164.O-0612).
Based on observations with the NASA/ESA Hubble Space Telescope
obtained at the Space Telescope Science Institute, which is operated by
the AURA, Inc., under NASA contract NAS5-26555.
Based on observations obtained at the W. M. Keck Observatory,
which is operated jointly by the California Institute of Technology and
the University of California.
Abstract
We investigate the nature of the substantial population of high-redshift galaxies with colours recently discovered as part of our Faint InfraRed Extragalactic Survey (FIRES). This colour cut efficiently isolates galaxies at with red rest-frame optical colors (“Distant Red Galaxies,” or “DRGs”). We select objects in both FIRES fields, the Hubble Deep Field South (HDF-S) and the field around the cluster at ; the surface densities at are and , respectively. We here discuss a sub-sample of 34 DRGs at : 11 at in HDF-S and 23 at in the field. This sample enables for the first time a robust assessment of the population properties of DRGs. We analyze the spectral energy distributions (SEDs) constructed from our very deep near-infrared (NIR) and optical imaging collected at the ESO Very Large Telescope and from the Hubble Space Telescope. We develop diagnostics involving the , , and colours to argue that the red NIR colours of our DRG sample cannot be attributed solely to interstellar dust extinction and require for many the presence of an evolved stellar population with a prominent Balmer/4000 Å break. In the rest-frame, the optical colours of DRGs fall within the envelope of normal nearby galaxies and the ultraviolet colours suggest a wide range in star formation activity and/or extinction. This is in stark contrast with the much bluer and more uniform SEDs of Lyman-break galaxies (LBGs). From evolutionary synthesis modeling assuming constant star formation (CSF), we derive for the DRGs old ages, large extinctions, and high stellar masses, mass-to-light ratios, and star formation rates. For solar metallicity, a Salpeter IMF between 0.1 and 100, and the Calzetti et al. extinction law, the median values for the HDF-S ( field) sample are 1.7 (2.0) Gyr, (2.4) mag, (1.6) , (2.3) , and (170) . Models assuming exponentially declining SFRs with -folding timescales in the range generally imply younger ages, lower extinction, and lower SFRs, but similar stellar masses within a factor of two. Compared to LBGs at similar redshifts and rest-frame -band luminosities, DRGs are older, more massive, and more obscured for any given star formation history. For the entire sample of -band selected galaxies in the FIRES fields at and to the above magnitude limits, we find that the derived ages, extinctions, and stellar masses increase with redder colours. Although the rest-frame optical colours of the DRGs are similar to those of local normal galaxies, the derived properties are quite different; detailed studies of this new population may significantly enhance our understanding of how massive galaxies assembled their stellar mass.
Subject headings:
cosmology: observations — galaxies: evolution — galaxies: formation — infrared: galaxies1. INTRODUCTION
Understanding how galaxies formed and evolved is a central challenge of modern astronomy. In the past decade, spectacular progress in instrumentation and observing techniques has enabled major advances as the high-redshift universe has been opened up for research. Our current view has been largely influenced by the discovery of an abundant population of actively star-forming galaxies at redshifts selected by the efficient Lyman-break technique (Steidel & Hamilton, 1993; Steidel et al., 1996a, b). These Lyman-break galaxies (LBGs) are among the best-studied classes of high-redshift objects: large samples have been spectroscopically confirmed at (e.g. Steidel et al., 1999) and extensive investigations have focussed notably on their stellar populations, star formation histories, chemical abundances, kinematics, and clustering properties (e.g. Giavalisco et al., 1998; Pettini et al., 2001; Papovich, Dickinson, & Ferguson, 2001; Shapley et al., 2001, 2003; Erb et al., 2003). LBGs dominate the ultraviolet (UV) luminosity density at high redshift and their number density is comparable to that of galaxies locally, making them a major constituent of the early universe. In the context of the widely favoured hierarchical scenarios of galaxy formation, they are thought to be the progenitors of present-day massive galaxies in groups and clusters (e.g. Baugh et al., 1998).
Yet, by construction the Lyman-break technique relies on a strong Lyman discontinuity in the rest-frame far-UV and is necessarily biased towards relatively unobscured galaxies with intense recent or on-going star formation activity. The typical stellar ages derived for LBGs are of a few with moderate extinction (Papovich et al., 2001; Shapley et al., 2001). Older and more quiescent systems at that have formed the bulk of their stars at or, alternatively, more obscured galaxies may have escaped detection in optical surveys (e.g. Ferguson, Dickinson, & Papovich, 2002). With the advent of -class telescopes and the development of sensitive near-infrared (NIR) instruments equipped with large-format detectors, it has become possible to extend very deep surveys to longer wavelengths and access the rest-frame optical emission of sources at . Compared to the rest-frame UV, the rest-frame optical spectral energy distribution (SED) of galaxies is less affected by the light of young massive stars and by dust extinction, and better traces longer-lived stars that dominate the stellar mass.
Colour criteria involving NIR bandpasses can now be applied to identify new populations at . The long-standing debate over the formation of massive early-type galaxies has driven considerable interest in the discovery of, and subsequent systematic searches for, red objects such as the “extremely red objects” (EROs) generally defined by or (e.g. Elston, Rieke, & Rieke, 1988; Hu & Ridgway, 1994; Thompson et al., 1999; Yan et al., 2000; Scodeggio & Silva, 2000; Daddi et al., 2000; McCarthy et al., 2001; Smith et al., 2002, among others). In our own Faint InfraRed Extragalactic Survey (FIRES; Franx et al., 2000), based on very deep NIR imaging of the Hubble Deep Field South (HDF-S) and of the field around the cluster , we have identified significant numbers of fairly bright () candidate galaxies selected from their colours. Analysis of the HDF-S sample suggests that this population makes a comparable contribution to the stellar mass density at as LBGs (Rudnick et al., 2003; Franx et al., 2003) and hence may be a substantial component in terms of stellar mass. Remarkably, there are far fewer such bright red objects per unit area in the HDF-North (e.g. Dickinson et al. 2000; see also Labbé et al. 2003). Cosmic variance may however largely explain these differences since both Hubble Deep Fields are small and the population may be strongly clustered (Daddi et al., 2003). Candidate high-redshift galaxies with unusually red colours have been reported by other authors as well (e.g. Scodeggio & Silva, 2000; Hall et al., 2001; Totani et al., 2001; Saracco et al., 2001, 2003). However, the focus has been on those objects with the most extreme colours, which are rarer and mostly at the faintest magnitudes.
An immediate question is what causes the red colours of these objects. Very red NIR colours can be produced by an evolved population at due to the stellar photospheric Balmer/4000 Å break redshifted into the band and beyond or by high levels of extinction in galaxies possibly at lower redshifts. The presence of a highly obscured active galactic nucleus (AGN) is another possibility (e.g., Norman et al., 2002; Koekemoer et al., 2004). While it appears that a combination of stellar population aging and extinction effects is required to explain the observed colours (e.g. Dickinson et al., 2000; Totani et al., 2001; Hall et al., 2001; Franx et al., 2003; Saracco et al., 2003), the results so far remain inconclusive due to the scarcity of systematic studies of large samples and to insufficient observational constraints.
In this paper, we take advantage of our FIRES data set to address the above issue from the broad-band SEDs of 34 objects with selected from both fields surveyed. The addition of the objects triples the original HDF-S sample. We focus on the ensemble properties of the red galaxies. van Dokkum et al. (2003, 2004) present results of our follow-up optical and NIR spectroscopy of a bright sub-sample in the field, which are particularly relevant to this work.
We briefly describe the data in § 2. We discuss the selection criteria applied to construct the selected samples in § 3. In § 4, we analyze the properties of the SEDs to investigate the stellar populations and dust obscuration. We model the SEDs using evolutionary synthesis in § 5 to constrain quantitatively the stellar ages and masses, the extinction, and the star formation rates. In § 6, we interpret our results and compare the derived properties to those of LBGs and of -band-selected objects at similar redshifts in the FIRES fields. We summarize the paper and main implications in § 7. For convenience, we adopt the term “distant red galaxies,” or “DRGs,” introduced by van Dokkum et al. (2004) to designate candidate galaxies with colours. All magnitudes are expressed in the Vega-based photometric system except when “AB” indicates reference to the AB system (Oke, 1971). Throughout, we assume a -dominated cosmology with , , and .
2. DATA
The data were obtained as part of FIRES (Franx et al., 2000), a public NIR survey of the HDF-S and fields carried out at the European Southern Observatory (ESO) Very Large Telescope (VLT). The observations, data reduction, and source catalogues are described in detail by Labbé et al. (2003) for HDF-S and N.M. Förster Schreiber et al. (2004, in preparation) for the field 111The reduced images, photometric catalogues, and photometric redshifts are available online through the FIRES homepage at http://www.strw.leidenuniv.nl/~fires..
Briefly, the NIR observations were taken in the , , and bands with the VLT Infrared Spectrograph And Array Camera (ISAAC; Moorwood et al., 1998). For HDF-S, a total of 103 h integration time was spent in a single pointing covering the Hubble Space Telescope (HST) WFPC2 main field. We complemented the NIR data with the publicly available deep optical WFPC2 imaging in the , , , and bands (Casertano et al., 2000). For the field, 77 h of ISAAC integration time was obtained in a mosaic of four pointings. At optical wavelengths, we used existing HST WFPC2 mosaics in the and bands (van Dokkum et al., 2000) and collected additional imaging in the Bessel , , and bands with the VLT FORS1 instrument. With HDF-S, FIRES achieves the currently deepest ground-based NIR imaging and the deepest -band map to date, even from space. With the field, the area surveyed is nearly five times wider, down to brighter magnitudes.
The sources were detected in the band using version 2.2.2 of the SExtractor software (Bertin & Arnouts, 1996). For consistent photometry across all bands, the fluxes were measured on the maps convolved to a common spatial resolution of full-width at half maximum FWHM = 0.48″ for HDF-S and 0.69″ for the field, matching to the map of poorest seeing in each data set ( and band, respectively). From the curve-of-growth analysis of the average stellar profile in each band, the fractional enclosed flux agrees to within 3% at diameters for HDF-S and 2% at for the field, where the diameters range from the smallest ( of the matched PSFs) to the largest apertures relevant for the colour measurements. Colours and SEDs used in this work are based on measurements in custom isophotal apertures defined from the detection map, hereafter referred to as “colour” fluxes or magnitudes. Total magnitudes in the band were computed in apertures based on auto-scaling apertures (Kron, 1980) for isolated sources and adapted isophotal apertures for blended sources. The photometric uncertainties were derived empirically from simulations on the maps. The total limiting magnitudes for point sources are for HDF-S and 23.1 mag for the field. We will refer to the objects by their number in catalogue versions v3.0e for HDF-S and v3.1b for the field, prefixed with “” and “.”
Wherever appropriate, we corrected for the Galactic extinction along the HDF-S and lines of sight ( and 0.11 mag; Schlegel, Finkbeiner, & Davis, 1998). We also accounted for the gravitational lensing by the foreground cluster based on the lensing model constructed by Hoekstra, Franx, & Kuijken (2000) from weak lensing analysis. The average magnification factor for all -band selected objects considered in this paper is 1.18 (or 0.18 mag). We emphasize that the colours and SED shapes are unaffected since lensing is achromatic.
Photometric redshifts were determined by applying an algorithm involving linear combinations of redshifted spectral templates of galaxies of various types, as described by Rudnick et al. (2001, 2003). Monte-Carlo simulations were used to estimate the errors accounting for uncertainties in the fluxes as well as template mismatch, and reflecting not only the confidence interval around the best solution but also the presence of secondary solutions. Comparison with available spectroscopic redshifts imply an accuracy of for both fields. For the regime of interest in this work (see § 3.2), based on the 20 -band selected sources with determinations.
3. NEAR-INFRARED SELECTED RED SAMPLES
3.1. The Colour Criterion
To identify red candidate high-redshift galaxies, or DRGs, we applied the criterion discussed by Franx et al. (2003). This criterion was specifically designed to target the stellar photospheric Balmer and 4000 Å breaks at redshifts above 2, which are the most prominent features in the rest-frame optical continuum SED of galaxies. The Balmer discontinuity at 3650 Å is strongest in A-type stars and, more generally, is indicative of stellar ages . At older ages, the 4000 Å break characteristic of cooler stars with types later than about G0, and strongest in giants and supergiants, becomes dominant. It is due to the sudden onset of metallic and molecular opacity bluewards of 4000 Å produced notably by Ca II HK, Fe I, Mg I, and CN lines.
Based on synthetic spectral templates computed with the Bruzual & Charlot (2003) models (see § 5), unextincted single-age stellar populations older than or passively evolving galaxies formed at satisfy the criterion at , where the Balmer/4000 Å break is redshifted into the NIR regime. Galaxies forming stars at a constant rate have a colour redder than 2.3 mag only if they are old and moderately obscured at , or younger and highly obscured with at . As argued by van Dokkum et al. (2003, 2004), our follow-up spectroscopy is consistent with the criterion selecting galaxies with a high efficiency of .
The colour cut at 2.3 mag is slightly bluer than used in other recent studies (in particular Totani et al., 2001; Saracco et al., 2003). Our objective is not to focus on the rare extreme objects but to allow inclusion of systems with rest-frame colours characteristic of normal nearby galaxies, which may be missed by rest-frame UV-selected surveys. Observed colours of correspond to rest-frame colours of or at . These rest-frame colours encompass those of the majority of present-day luminous galaxies, from elliptical to intermediate-type spiral galaxies (e.g. Buta et al., 1994; Jansen et al., 2000).
As discussed by Labbé et al. (2003), contamination by foreground cool stars is expected to be negligible since most known M, L, and T dwarfs have colours bluer than 2.3 mag; others such as extreme carbon stars or Mira variables that could be redder are rare and unlikely to be present in pencil beam surveys at high galactic latitudes such as our FIRES fields (see also Hall et al., 2001; Saracco et al., 2003). From NIR spectroscopy of six DRGs in the field and the Chandra Deep Field South (CDF-S), van Dokkum et al. (2004) argued that strong emission lines in the band are unlikely to account for the observed red colours of most of the population. The main contaminants are more likely very dusty () galaxies at , probably at the level (van Dokkum et al., 2003).
Another potential concern is that samples selected with the criterion suffer from contamination by AGN. However, the majority of the bright DRGs we identified in the HDF-S and fields (§ 3.2) are well resolved in our -band imaging data, implying that their NIR broad-band fluxes are not strongly influenced by continuum emission from an AGN. Emission lines from type II AGN could also influence the NIR colours. The rest-frame optical spectra of van Dokkum et al. (2004) show that this effect is minor for the confirmed type II AGN in our samples, and we are pursuing a NIR spectroscopy program to confirm this result 222The fairly high fraction of of type II AGN in the spectroscopic sample (van Dokkum et al., 2003, 2004) is likely to result from the spectroscopic selection bias towards galaxies that are bright in the observer’s optical and with bright emission lines.. For the moment, we conclude it is unlikely that emission from AGN affects the NIR fluxes and colours in a substantial way.
3.2. Sample Selection
For the purpose of SED analysis and modeling, our goal was to construct a sample of selected candidate galaxies with robust NIR colours, reliable SEDs, and spanning a redshift range that would allow consistent comparisons with the well-studied LBGs. We required that the objects have a signal-to-noise ratio on their -band colour flux and a minimum of 30% of the total exposure time (or relative weight ) in all bands 333The weights in each band for the HDF-S are normalized to the respective total exposure time over the entire field covered by the maps. For the mosaic, the NIR ISAAC fields have somewhat different total integration times and the highest overall weights are reached in the small overlapping regions. To ensure that the selection area covers fairly the mosaic, we considered the weights for the NIR data normalized to the total exposure time in each of the ISAAC fields individually. For sources in the overlapping regions, we required that in at least one of the field.. This yielded initial samples of 14 objects at in HDF-S and 31 at in the field. The effective sky-plane areas are 4.48 and , respectively.
The photometric redshifts of the selected sources lie in the range . Spectroscopic redshifts are available for four of them in the field (van Dokkum et al. 2003, 2004; S. Wuyts et al. 2004, in preparation). Three have between 2.42 and 2.61, and their agrees with within . The fourth has and turned out to be an interloper at . We note that the large uncertainty towards low redshifts for this source reflects the presence of a long tail of solutions with comparable likelihood. Figure 1 compares the ’s with ’s and shows the redshift distributions of the samples, where we used whenever available instead of . For the present study, we focused on the selected sources with redshift between 2 and 3.5. We chose this interval because we are primarily interested in galaxies at and it matches well the range for LBGs selected from space-based HST WFPC2 data. Ground-based selected LBGs typically lie at somewhat higher redshift with less overlap with the range covered by our DRG samples. This is mainly because the selection criteria rely on a different set of filters with, notably, a redder “” bandpass (for a discussion, see, e.g., Giavalisco & Dickinson, 2001).
The samples finally adopted, with and , consist of 11 objects at in HDF-S and 23 at in the field. The redshift distribution for the HDF-S ( field) sample has a mean (2.44), median (2.42), and dispersion (0.30). These values are computed using the whenever available, and are essentially unchanged when considering only the ’s (the largest difference is for the field). There are four objects just below the limit whose error would allow a and, conversely, five objects just above whose error would allow ; we verified that these small sample variations would not alter the conclusions of our SED analysis and modeling. Table 1 gives relevant characteristics of the adopted DRG samples.
We note that not all the field objects for which spectroscopy is presented by van Dokkum et al. (2003, 2004) are included in our sample. The initial selection for the spectroscopic follow-up was based on a preliminary version of the reduced data and photometry. In the final photometric catalogue (v3.1b), the two galaxies with spectral signatures indicating an AGN are slightly bluer than the cutoff ( and , numbered 1195 and 1458 in van Dokkum et al., 2003). The bright and red object (number 184 in van Dokkum et al., 2003) satisfies all criteria except for the minimum integration time in the NIR bands, with relative weights , , and . However, it has a spectroscopic redshift (included in Figure 1a) and, at , lies in the range considered for our analysis. constitutes a valuable addition that we will discuss where relevant but keep out of the formal sample.
Figure 2 shows the raw cumulative number counts per unit area as a function of total magnitude of the DRGs, for both cases of and of no redshift restriction. To assess the variations of surface density with limiting magnitude and between the two fields, the counts are extended to the limits for point sources of 23.8 mag in HDF-S and 23.1 mag in the field. We did not account here for the lensing by the cluster. The corrections would be small, with an average dimming by and a mean reduction by from image- to source-plane area for the redshift range covered by the sources. These effects are opposite so that to first order, the surface density to a given apparent magnitude is insensitive to lensing (the exact effect depends on the slope of the luminosity function, which is unknown).
Per unit area, the field is richer in sources brighter than while HDF-S has higher surface densities for fainter limits down to 23 mag (where the completeness levels still are for both fields). These differences are not due to the lensing magnification by . For , there are five DRGs at in the field and none in HDF-S; at fainter limits, HDF-S has higher surface densities by a factor of two on average. The redshift cut has little impact: without it, there are seven DRGs at in the field and still none in HDF-S, and the surface densities at fainter limits are 1.7 times higher on average in HDF-S. The two fields cover small areas and cosmic variance could easily account for a large part of the differences in the surface densities, the more so in view of the possible strong clustering of the DRG population (Daddi et al., 2003). This might also explain the deficiency in HDF-North, with similar survey area as HDF-S, where we find no source with colours at magnitudes brighter than using ground-based photometry (from Fernández-Soto et al., 1999) 444We consider here specifically colours involving the ground-based band because the corresponding F110W bandpass of NICMOS onboard HST is significantly bluer and about twice as broad as the or bandpasses (the colour term is negligible between the latter two). Consequently, F110W photometry is not useful to select galaxies red in their colours..
Figure 3 plots the raw cumulative counts as a function of cutoff for all -band selected sources at in HDF-S and in the field (the magnitude limits ensuring on the -band colour fluxes of the DRGs). For , the DRG samples are not strongly sensitive to the exact colour cut: varying the criterion between 2.2 and 2.4 mag implies objects for HDF-S and for the field, or variations. Imposing no redshift limits, the same colour cut variations result in objects for HDF-S and for the field; the fraction of galaxies at increases rapidly for colours bluer than 2.3 mag. The median uncertainty on the colours among the adopted DRG samples is 0.13 mag and all those with uncertainties larger than 0.2 mag (the maximum is 0.43 mag) have colours redder than 3.0 mag.
3.3. Comparison LBG Sample
We also constructed a sample of LBGs taken in HDF-S. We used the original HDF-S HST WFPC2 photometric catalogue from Casertano et al. (2000) and selected the LBGs using the criteria introduced by Giavalisco & Dickinson (2001). Of the 139 selected LBGs at , 91 are cross-identified in our FIRES -band selected catalogue and have in our full set of maps. All LBGs in this sub-sample are brighter than . To make up the comparison LBG sample, we then selected those satisfying the same limit as for the HDF-S DRGs and with redshift . The requirement on the -band magnitudes ensures that the selected LBGs have reliable NIR photometry and rest-frame -band luminosities similar to those of the selected DRGs. The adopted sample consists of 33 LBGs at . Their redshift distribution has , , and . The mean and median redshifts are close to those of the DRGs, especially from HDF-S. The average (and median) colour is 1.68 mag with dispersion , and only two of these LBGs are redder than .
For this LBG sample, we will hereafter use the corresponding photometry from the FIRES HDF-S catalogue (v3.0e). Although selected at different wavelengths, the use of SEDs from the same photometric catalogue ensures uniformity in the data sets for both DRGs and LBGs and more directly comparable results in the analysis and modeling. The requirement that our LBG sample be also detected in the band makes our selection slightly different than the classical purely optical selection. We did not construct a similar LBG sample for the field because of its ground-based data, which would select LBGs in a somewhat higher redshift range than spanned by the DRG samples.
4. PHOTOMETRIC PROPERTIES OF THE SAMPLES
The large numbers of DRGs that we identified from in the FIRES survey suggest they may represent a significant component of the high-redshift galaxy population (Franx et al., 2003; van Dokkum et al., 2003). It is thus important to understand their nature, in particular their stellar populations and dust content. Before undertaking the detailed theoretical modeling, we here examine the broad-band properties of the sample to assess the relative importance of aging and extinction in a qualitative but less model-dependent manner.
4.1. Observed Optical to Near-infrared SEDs
The observed SEDs of DRGs in both FIRES fields exhibit a wide variety in their shapes, especially in the optical regime. Figure 4 presents the SEDs of selected representative objects in each of the HDF-S and field. The galaxies are sorted according to increasing colour, and the SEDs are normalized to the flux density in the band (the overplotted SED fits will be discussed in § 5). At one extreme, some of the DRGs appear overall very red with little if any flux in the optical bands. At the other, some have blue observed optical colours indicative of on-going star formation activity. Most exhibit a rather abrupt transition redwards of the band reminiscent of a spectral break in the continuum. A few show a rather smooth and gradual increase in flux with wavelength suggestive of a featureless continuum reddened by dust obscuration.
4.2. Rest-frame SEDs Properties
The rest-frame optical colours of the DRGs lie within the range covered by present-day normal galaxies, in striking contrast with the much bluer LBGs. Figure 5 shows the rest-frame SEDs of our samples of DRGs and LBGs at . All SEDs are dereddened for Galactic extinction. We accounted for the average intergalactic attenuation due to line blanketing by Ly () and higher-order Lyman lines () following the prescriptions of Madau (1995). The SEDs are compared with the empirical UV-optical template spectra of nearby galaxies of types E, Sbc, Scd, and Im from Coleman, Wu, & Weedman (1980). The spectra shown here were extended beyond their original Å coverage by Bolzonella, Miralles, & Pelló (2000) using the evolutionary synthesis code of Bruzual & Charlot (1993, GISSEL98 version) with appropriate model assumptions. The SEDs and spectral templates are normalized to a flux density of unity at Å using linear interpolation between the adjacent rest-frame data points.
At Å, the SEDs of all DRGs fall within the envelope of normal galaxies. None of the DRGs has rest-frame optical colours as red as the earliest-type nearby ellipticals, perhaps not surprisingly so because the universe is only a few times old at . At shorter wavelengths, the SEDs span a wide range in rest-frame UV slopes encompassing those of normal galaxies and extending to much redder slopes, suggesting a range in level of star formation activity and in interstellar extinction. In contrast, the LBG SEDs exhibit less scatter especially in the UV and are systematically bluer than late-type spirals, as first demonstrated by Papovich et al. (2001). These authors showed that the SEDs of their HDF-N LBGs fit well in the envelope defined by the local starburst templates of Kinney et al. (1996) and are consistent with the presence of a young and modestly obscured stellar population.
Figure 6 illustrates the effects of extinction, where we used the Im-type template of Coleman et al. (1980) and applied the extinction law of Calzetti et al. (2000) assuming a simple uniform foreground screen of obscuring dust. The template SEDs inherently include some intrinsic reddening so that our simulations represent additional amounts of extinction. Interestingly enough, the Im template combined with added extinction of between 0 and 3 mag brackets the range of rest-frame SED shapes of our DRG sample. Large extinction offers a natural interpretation for the many objects with very red rest-frame UV emission and consequently could also account in part for the red rest-frame optical colours. Figures 5 and 6 do not allow us to assess the relative importance of evolved stellar populations and extinction effects in producing the observed SEDs of DRGs. However, they demonstrate clearly that DRGs and LBGs are distinct in their rest-frame UV-optical SEDs, presumably because of very different dominant stellar populations and/or extinction levels.
In Figure 5, the SEDs of the three spectroscopically-confirmed DRGs among our sample along with (see § 3.2) are plotted with different symbols. The comparison indicates that the galaxies in the spectroscopic sample do not deviate strongly in their rest-frame SEDs from the full photometric sample. On the other hand, it also shows that the spectroscopic sample does not probe the entire range of properties seen for the ensemble of DRGs.
4.3. Optical Break versus Dust Extinction
The wavelength sampling and resolution of our data are too coarse to delineate accurately a Balmer/4000 Å break. Even when strongest, the break represents a moderate flux jump by a factor of , a subtle feature compared to the Lyman break at 912 Å. For the brightest DRG of the spectroscopic sample, the presence of a break is confirmed by the detection of a significant drop in continuum level in its NIR spectrum collected with NIRSPEC at the Keck Telescope (van Dokkum et al., 2004). Here, we examine the observed NIR properties of our ensemble of DRGs using diagnostic colour-colour diagrams, which allow us to establish that a break is required to explain the colours of an important fraction of them.
Specifically, we test whether the red observed NIR colours of DRGs (1) can be reconciled with a very young () stellar population that is highly obscured by dust, or if (2) the presence of a more evolved () stellar population whose SED has a prominent Balmer/4000 Å break is necessary. In exploring various colour combinations, we relied on the sharpness of the Balmer/4000 Å break versus the smoother wavelength dependence of dust attenuation. Extinction makes all colours redder while a prominent break produces a larger contrast between colours because of the steep drop in flux at the break. As a stellar population ages, the continuum slope intrinsically reddens because cooler stars dominate the optical light but the break remains comparatively sharp. For redshifted populations, these differences in colour contrast will be reflected in the variations with in colour-colour space.
We found that versus and versus provide the most sensitive diagnostic diagrams. The use of these adjacent bandpasses traces as closely as possible the Balmer/4000 Å break in the range while minimizing reddening due to dust and to cool dominant stars. Figure 7 compares in these diagrams the colour distributions of the DRGs with the redshift evolution at of selected model SEDs: 250 Myr and 1 Gyr old single-age stellar populations (SSPs), a passively evolving population formed at , and populations with constant star formation rate (CSF) and ages of 10 Myr, 100 Myr, and 1 Gyr. We computed the synthetic spectra and colours using the codes of Bruzual & Charlot (2003) and Bolzonella et al. (2000) as for the SED modeling and with the same standard assumptions (see § 5). We also plot tracks for the 100 Myr old CSF model with in the range , applying the extinction law of Calzetti et al. (2000) and a uniform foreground screen geometry.
The model tracks in the top panels of Figure 7 show the expected trend that the older the age, the larger the amplitude of the colour variations with as the stronger break moves redwards across the successive bandpasses. The effect is maximized for SSPs or passively evolving populations, where the break is not diluted by the light from younger stars with shallower or no absorption features and with bluer continuum. CSF models are consistently bluer in all colours and occupy narrower regions than SSPs of the same age. Extinction effects shift the tracks along paths that run diagonally across the diagrams but preserve their amplitude at fixed age. As shown schematically in the bottom panels, the locus of CSF models with varying extinction gets wider with older ages, because of the stronger break. The effects of aging and extinction can be distinguished in that the loci of dusty model tracks broaden with increasing age in the direction perpendicular to the extinction path, the key feature we here exploit.
The immediate result from these diagrams is that the colours of the ensemble of DRGs cannot be reconciled with very young and highly obscured populations. Dusty CSF models need the broadening due to significant aging to better match the observed spread perpendicular to the extinction vector. To quantify the fraction of DRGs not overlapping with the dusty models, Figure 8 presents histograms where the colour distributions have been rebinned as a function of the deviation in and around the line best representing the dusty 100 Myr old CSF tracks (using robust linear regression). The maximum extent of the tracks about this line is indicated in the plots. The central loci and maximum widths for the 10 Myr and 1 Gyr old dusty CSF models are plotted as well. About two-thirds of the DRG sample has colours which are inconsistent with those of a 10 Myr old obscured star-forming population. The fraction drops to for an age of 100 Myr, and for 1 Gyr (depending on the colour considered).
Interestingly, the versus diagram shows that if DRGs are actively star-forming, then the colour cut will miss even those with a strong optical break unless they are highly obscured. In other words, the criterion preferentially selects not only for the most evolved star-forming systems but for the most obscured ones as well. The need for high extinction is alleviated for scenarios where the star formation rate is declining with time (as we discuss further in § 5), but the colour cut still selects for evolved galaxies. Figures 7 and 8 demonstrate that the red NIR colours of the ensemble of DRGs cannot be attributed to extinction effects alone. For a significant fraction of the objects, the colours require the presence of a strong Balmer/4000 Å break produced by stars with ages .
5. MODELING OF THE SPECTRAL ENERGY DISTRIBUTIONS
In this section, we describe our model ingredients and fitting methodology. We present the results for our set of “standard” parameters with fixed initial mass function (IMF), metallicity, extinction law, and two choices of star formation history (SFH). We also test the sensitivity of the results to changes in the SFH, metallicity, and extinction law. We modeled the broad-band SEDs of our DRG sample following the approach adopted in recent similar studies of high redshift galaxies (e.g. Papovich et al., 2001; Shapley et al., 2001; van Dokkum et al., 2004). We fitted redshifted synthetic spectra of stellar populations to the SEDs to constrain simultaneously the age and extinction, keeping fixed for each object. We derived the stellar masses () and star formation rates (SFRs) by scaling those of the best-fit input model so as to reproduce the observed fluxes. We determined the stellar mass-to-light (M/L) ratios using the attenuated rest-frame -band luminosities () computed as described by Rudnick et al. (2003, their Appendix C). Although the extrinsic (i.e. dust-attenuated) luminosities from our best-fit models agree to better than 10% on average, we preferred the less model-dependent estimates of Rudnick et al. (2003).
5.1. Model Ingredients
We generated the synthetic spectral templates with the most recent version of the evolutionary synthesis code developed by G. Bruzual and S. Charlot (Bruzual & Charlot, 2003). This “BC03” version features improved stellar evolutionary tracks with observationally motivated prescriptions for the thermally-pulsing asymptotic giant branch phase. It also incorporates updated and newly available stellar libraries for two sets of spectral resolution and coverage. We used the lower resolution set covering Å to 160 µm relying on the BaSeL 3.1 library. We selected the “Padova 1994” evolutionary tracks, which are preferred by Bruzual & Charlot over the more recent “Padova 2000” tracks because the latter may be less reliable and predict a hotter red giant branch leading to worse agreement with observed galaxy colours. We used the solar metallicity set of tracks. The only constraints available for the chemical abundances of DRGs come from the [N II] Å/H line ratio measured in two of the galaxies observed spectroscopically, which suggests high metallicities of (van Dokkum et al., 2004). These DRGs appear more metal-rich than the five LBGs at studied by Pettini et al. (2001, ) and similar to the seven UV-selected star-forming “BX/MD” objects at for which Shapley et al. (2004) inferred solar, and possibly super-solar, metallicities. In all cases, however, the determinations rely on limited samples and suffer from large uncertainties.
The computed grid of spectral templates covers ages between and . The SFH most appropriate for our objects is unknown and broad-band photometry alone is not effective at constraining it (see § 5.4; also, e.g., Papovich et al., 2001; Shapley et al., 2001). We considered two star formation rate parametrizations: constant in time with and exponentially declining in time as with timescale (hereafter “CSF” and “” models). These exact choices are somewhat arbitrary. The CSF model is intended to represent the case of significant on-going or recent star formation activity. Evidence for this scenario in part of the DRG population includes the detection of H and/or [O III] Å lines in the non-AGN sources of the spectroscopic sample (van Dokkum et al., 2004) and the blue rest-frame UV SED of several others among the full sample (see Figures 4 and 5). The model allows for the possibility of quiescent systems that underwent a period of enhanced star formation in their past.
We adopted a Salpeter IMF () between 0.1 and 100. The IMF is unconstrained for our objects, and a steep rise down to the lower mass cutoff likely is unrealistic in view of the turnover below 1 inferred for the local IMF (e.g., Kroupa, 2001; Chabrier, 2003). The most critical impact is on the derived masses and mass-to-light ratios (), which depend strongly on the shape and cutoff of the low-mass IMF. For instance, for a fixed rest-frame -band luminosity, the derived masses and M/L ratios would be about a factor of two lower with the Kroupa (2001) or Chabrier (2003) IMFs (e.g., Figure 4 of Bruzual & Charlot 2003; see also Papovich et al. 2001 for a discussion of the effects of different IMFs in their SED modeling of LBGs).
We have used the mass of stars still alive instead of the total mass of stars formed . is simply the integral of the SFR and corresponds to the total gas mass consumed since the onset of star formation. is computed by subtracting from the mass returned to the ISM by evolved stars via stellar winds and supernova explosions (see Bruzual & Charlot, 2003, for details). We preferred in our analysis because it represents the mass of the stars producing the light. For the typical ages of interest here and with the adopted IMF, the cumulative mass-loss effects are modest and comparable for the CSF and models, reaching of . Even in the limit of an SSP where the effects are largest, they amount to a similar fraction of .
Both interstellar extinction by dust within the objects and attenuation due to intergalactic H opacity were applied to the BC03 templates while performing the fits. We explored a range of extinction with . Higher values are physically possible but unlikely to be actually measured from rest-frame UV/optical data because the corresponding optical depths largely exceed unity. The extinction law and the geometry for the obscuring dust and emitting sources are other uncertain parameters. We adopted the law of Calzetti et al. (2000) derived empirically from observations of local UV-bright starburst galaxies under the formalism of a foreground screen of obscuring dust. As emphasized by these authors, this extinction law and model geometry may not be valid in dust-rich systems where the optical depths are large and the sources and dust are more or less mixed spatially. The average Lyman line absorption by the intergalactic medium (IGM) was accounted for based on the prescriptions of Madau (1995). Lyman continuum absorption was approximated by setting the flux of the templates equal to zero at Å.
5.2. Fitting Procedure
We performed the fits using the publicly available HYPERZ photometric redshift code, version 1.1 (Bolzonella et al., 2000). We fixed the redshift to the determined independently (see § 2) or to the when available. The code was allowed to fit simultaneously the spectral template (age) and the extinction, for each of the SFH adopted. Interstellar extinction is first applied to the synthetic spectra, which are then redshifted and further attenuated for IGM absorption. The fitting algorithm relies on least-squares minimization, with the chi-squared calculated as . The sum is performed over the photometric bands. The template fluxes are computed from the reddened, redshifted, IGM-absorbed template spectra using the total effective transmission functions in each bandpass. The scaling factor is determined from the full SED constructed from the colour fluxes, corrected by the same amount to the total aperture based on the -band measurements; all SEDs have also been corrected for Galactic extinction and, for the field sample, for the lensing magnification prior to the fitting (§ 2).
We treated any flux with as a non-detection, with upper limit equal to the uncertainty. The assigned uncertainties and upper limits correspond to those of the flux measurements. We assumed a minimum error of 0.05 mag on the photometry to avoid the fits being driven by a few data points with very small errors. This also accounts for uncertainties in the absolute flux calibration. Our results are not strongly influenced by this assumption. If we do not impose a minimum photometric error, the median of the best-fit extinction values remains the same for the two fields and two standard SFHs considered. The median ’s vary by , and the median SFRs by . The median of the best-fit ages decreases from 1.7 to 1.0 Gyr for the HDF-S DRGs and CSF, and increases from 1.0 to 1.4 Gyr for the field DRGs and the model, not affecting our findings that DRGs harbour old stellar populations.
HYPERZ resamples the age grid from the BC03 models from 221 to 51 fixed steps. We required that the template ages considered for the fitting do not exceed that of the universe at the redshift of each source. We emphasize that the best-fit age, which we will denote , is strictly speaking the time elapsed since the onset of star formation. An alternative, perhaps more meaningful definition is the SFR-weighted mean age corresponding more closely to the age of the stars contributing the bulk of the stellar mass. For CSF models, . For exponentially decaying models, , which becomes when . Moreover, should not be over-interpreted as the age of the entire galaxy. It is important to remember that all the properties derived from the SED modeling apply only to the stellar population that dominates the fluxes in the observed wavelength range. This does not preclude, e.g., the presence of a pre-existing stellar population that has faded out too much (a scenario explored for LBGs by Papovich et al., 2001) or of a younger population that is too obscured to be detected by our observations.
We estimated the confidence intervals for individual objects from Monte-Carlo simulations. For each source, we performed 500 synthetic realizations of the data by varying the fluxes by an amount randomly drawn from the (Gaussian) distribution of the measurement uncertainties (including the minimum error of 0.05 mag where appropriate). For sources with only a determination, we also varied the redshift by drawing randomly from the associated probability distribution . We then repeated the fitting procedure for each realization. We determined the 68% confidence intervals from the distributions of best-fit values obtained with the simulated data. The behaviour of the confidence intervals for the DRG samples studied here are very similar to those of the spectroscopic sample of van Dokkum et al. (2004) and of the LBGs modeled by Papovich et al. (2001) and Shapley et al. (2001), i.e. often asymmetric around the best-fit values, reflecting strong degeneracies notably between and , and implying that is the best constrained quantity for the majority of objects; we refer to the above papers for a more detailed discussion 555For the combined DRG sample, the median of the uncertainties given by the 68% confidence intervals for the CSF () standard model are () for the age , () for , () for , and (50% to a factor of 2) for the instantaneous SFR. For the HDF-S LBG sample also modeled in this work (§ 6.1), the uncertainties are () for the age , () for , () for , and () for the instantaneous SFR. For DRGs and LBGs, the uncertainties on are with both the CSF and models.. The derived uncertainties are smaller or comparable to the differences in best-fit values obtained by varying the assumed SFH, metallicity, or extinction law (see § 5.4). The main goal of this work is to characterize the ensemble properties of DRGs (from the median and the global distributions of best-fit values), and accounting for the uncertainties of individual sources does not alter our general conclusions. We will therefore not discuss them further, except where most relevant.
5.3. Modeling Results for the Standard Model Sets
Both the CSF and models provide acceptable fits to the SEDs of our DRG samples 666The median of the chi-squared values normalized per degree of freedom, , for the best-fit CSF models are 1.6 for the HDF-S sample and 2.1 for the field sample. For the models, the values are 0.6 and 1.6, respectively. ’s higher than the expected value of unity for good fits could indicate that the models do not provide a realistic representation of the objects, the photometric uncertainties underestimate the real measurement errors, the distributions of uncertainties of the modeled properties are not Gaussian, or, most likely, that a combination of the factors is at play.. The best-fitting models for selected sources are shown in Figure 4. Table 2 and Figure 9 summarize the derived properties. The results are similar for the HDF-S and field samples. With the CSF model, the median values for HDF-S ( field) are (2.0) Gyr, (2.4) mag, , , and instantaneous . With the model, the median age and extinction are 1.0 Gyr and 0.9 mag for both fields; the median for the other properties in HDF-S ( field) are , , and . The median ages of the bulk of stars and the median time-averaged SFRs for the two SFHs and two fields differ less than the median and instantaneous SFRs, with values between 0.75 and 1.0 Gyr, and 90 and .
The dispersion among individual DRGs is large for all properties. This stems partly from the diversity in SEDs noted in § 4. For instance, with a given SFH, quite different combinations of age and extinction are derived for the objects that are bluest in the rest-frame UV compared to the reddest ones. Part of the (small) differences between the HDF-S and samples likely reflects the brighter -band magnitude limit and larger proportion of the brightest sources, the redder colours, and the lower redshifts for the objects (see Table 1). The different sets of optical photometric bands may play a role too by providing somewhat different observational constraints.
For the ensemble of DRGs, either SFH thus implies old ages, and high stellar masses and M/L ratios. High SFRs and large amounts of extinction are derived for the CSF model while the model leads to lower SFRs and extinction (we comment on the validity of the adopted Calzetti et al. 2000 extinction law in view of the large extinction derived for the DRGs in § 5.4.2). Similar results were obtained in our initial study of HDF-S (Franx et al., 2003) and for the spectroscopic sample (van Dokkum et al., 2004). In particular, for the two spectroscopically-confirmed non-AGN DRGs in the field, the ages are supported by estimates from the H equivalent widths and the stellar masses are consistent with the dynamical masses from the H or [O III] Å line widths. As we show in § 5.4, the stellar masses are the most robust properties against variations in SFH, metallicity, and extinction law (neglecting changes in the IMF). With our definition, the ratios also are because the luminosities involved are extrinsic. On the other hand, the instantaneous SFRs are very sensitive to the model assumptions, especially to the SFH (again ignoring the IMF).
To test the sensitivity to the photometric redshift uncertainties, we modeled the DRG samples as above, adopting in turn the lowest and highest redshift allowed by the 68% confidence interval around for each object. Although the effects on the median values of the best-fit properties can be appreciable (by up to 0.7 Gyr for the age, 0.9 mag for , a factor of 2 for , and a factor of 5 for SFR, depending on the field and SFH), our conclusions are qualitatively unaffected. We also modeled the samples of DRGs including the objects outside of the range. The impact on the median properties is significantly smaller (, , , and for the ages, ’s, ’s, and SFRs, respectively).
The SED fits of Figure 4 illustrate well the difficulty in discriminating between the two SFHs (in particular, e.g., for and ). Based on the formal values, the fits are statistically indistinguishable for all but three galaxies, for which the CSF model could in principle be ruled out at the 95% confidence level. For two of these, and , the higher flux in the band relative to the band strongly influences this result. Although their colour is fairly blue, they are not the most extreme of our sample. For the other, , the optical data are better reproduced with the model. For this spectroscopically studied DRG (van Dokkum et al., 2004), correcting for line emission would affect mostly the observed -band flux (downwards by 10% for Ly) and would improve the agreement with the CSF model. The distinction between the models is not very robust and the computation relies on uncertainties that do not account for those of or possible emission line contributions. In view of this, we chose not to discriminate between SFH models for individual sources in our analysis.
5.4. Variations in Model Parameters
We explored the effects of variations in three of the model assumptions: the SFH, the extinction law, and the metallicity. Figure 10 summarizes the results for the ages, extinction, stellar masses, and SFRs derived for different sets of input parameters. While the effects may differ among individual objects, we are here interested in the ensemble properties of DRGs and so the discussion refers to the median values. We find that the SFH has the largest impact on the derived quantities. The age, extinction, and instantaneous SFR are the most affected ones whereas the stellar mass and M/L ratio are the least sensitive ones and change only by factors of .
5.4.1 Star Formation History
We considered exponentially declining SFRs with a range of -folding timescales between 10 Myr and 1 Gyr. They are compared with the CSF and also an SSP model, equivalent to and , respectively. With our broad-band data, it is not possible to discriminate among any of the SFHs for the large majority of our DRGs. The overall trend with decreasing timescale is of younger ages by up to an order of magnitude. The extinction values become lower but do not vary monotonically with , exhibiting a minimum around 300 Myr. The maximum difference amounts to 1.8 mag, or a factor of in attenuation at in the rest-frame. It is intriguing that the lowest extinction values are not derived for the models with shortest timescales, as might be expected. This may be due to worse template mismatch at . The SFRs drop by several orders of magnitude, to some extent because of lower extinction but mainly as a consequence of the functional form of the assumed SFR itself combined with the ages, which are such that .
The stellar masses tend to decrease with smaller but remain within a factor of 2 of the masses for CSF. We thus reach similar conclusions about the stability of derived for DRGs as Papovich et al. (2001) and Shapley et al. (2001) in their modeling of LBGs also based on broad-band optical-to-NIR photometry. As discussed by these authors, this is in part due to the NIR data probing the rest-frame optical regime, which is less sensitive to variations due to age or extinction than the rest-frame UV. In addition, the age and dust degeneracies tend to cancel out in terms of the effect on the ratio of stellar mass to observed (attenuated) light. The same behaviour is seen in the case of our DRGs (see van Dokkum et al., 2004, for a discussion). While age and extinction can vary strongly with the SFH, the combinations of best-fit values result in much tighter constraints on and .
The largest extinction is derived for the longest timescales. The need for high extinction here may be artificially enhanced by the choice of SFH along with the constraint that the best-fit ages do not exceed that of the universe at each object’s redshift. In the limit of CSF, the population of young massive stars rapidly levels off on the timescale of their main-sequence lifetime () while the population of lower-mass longer-lived stars grows progressively. To match the typically red SEDs of DRGs, the UV light from the luminous massive stars continuously formed has to be suppressed with sufficient extinction. The maximum age constraint limits the relative contribution of evolved versus young stars to the integrated light, further enhancing the need for extinction. Over the range of SFHs explored here, the strong coupling between age and also reflects the need for the build-up of a large enough population of evolved stars.
Models with very short timescales where the extinction is allowed to vary lead to ages and fairly high . Arguably, such young dusty burst models may not be appropriate for the ensemble of DRGs (though they may be for some individual objects) in view of the evidence for a prominent spectral break in their rest-frame continuum SEDs (see § 4). Choices of lead to ages consistent with the appearance of a strong Balmer/4000 Å break in both cases of very quiescent or still actively star-forming galaxies. Although models with cannot be statistically ruled out in our fits, we regard them as least plausible for DRGs.
5.4.2 Extinction Law and Metallicity
To test the effects of possible variations in the extinction law and in metallicity, we fitted two alternative suites of models to the SEDs. In one variant, we modified the prescription for the extinction law to that of Allen (1976) for the Milky Way (MW), keeping the solar metallicity. In the other, we used the set of BC03 models for metallicity and adopted for consistency the extinction law for the Small Magellanic Cloud (SMC; Prévot et al., 1984; Bouchet et al., 1985). The main differences between the Calzetti et al. (2000) and MW extinction laws lie in the ratio of total-to-selective absorption (4.05 versus 3.1, respectively) and in the Calzetti et al. law lacking the 2175 Å bump characteristic of MW dust mixtures. Otherwise, their wavelength dependence are fairly similar. The SMC law with also lacks the 2175 Å bump. In addition, it rises more steeply with decreasing wavelengths in the near-UV than the other two laws; in other words, the Calzetti et al. and MW laws are much “greyer” at near-UV wavelengths.
For the models with and the MW law, the ages for a given SFH remain the same or become mostly younger, by up to a factor of 3. The best-fit ’s also remain the same or decrease, by at most 0.6 mag. The effects are more important for the and SMC law models, with generally older ages by up to a factor of 5 and ’s lower by up to 2 mag. In both model sets, the instantaneous SFRs are strongly affected towards shorter timescales , especially for the low-metallicity case. The stellar masses are systematically lower for both variants, by a factor of on average.
The near-systematic increase in median age of the DRGs for the lower metallicity models can be attributed to the combined effects from the extinction law and stellar emission. Since the SMC law is steeper in the rest-frame UV than both the Calzetti et al. (2000) and MW laws, lower values will reproduce the observed SED slopes in this regime but also imply bluer rest-frame UV-to-optical colours such that older ages are required to match the colours of DRGs. In addition, at and for a fixed age, the stellar evolutionary tracks and model atmospheres predict higher effective temperatures, bluer continua, and shallower metallic and molecular absorption features, further driving up the best-fit model ages. As emphasized by Shapley et al. (2001), it is important here to keep in mind that theoretical stellar tracks and stellar atmosphere models for non-solar metallicities are still not fully tested against empirical data (see the discussion by Bruzual & Charlot, 2003). The variations in derived parameters we describe above provide nevertheless indications of the magnitude of metallicity effects.
We further note that the high obscuration inferred for the models with star formation timescales raises concerns about the applicability to DRGs of the adopted Calzetti et al. (2000) extinction law and foreground dust screen geometry. The Calzetti et al. law provides a good representation for local UV-bright starbursts with up to about 2.5 mag and where the foreground dust approximation is observationally supported. For the CSF model, for instance, the values obtained for half of the DRGs indicate extinction levels at the limit of, or beyond the range of validity. This may suggest that the Calzetti et al. law is inappropriate, and that the dust and sources geometry is more complex.
6. COMPARISON OF DRGS WITH LBGS AND OTHER GALAXIES
The picture that emerges from our SED analysis and modeling is that DRGs constitute an old and massive galaxy population at high-redshift. Obscuration by interstellar dust plays an important role in their observed properties. Depending on their actual SFH, they may also still be very actively forming stars. In this section, we interpret our results in a broader context by comparing our DRGs with LBGs. We also consider the ensemble of all -band selected galaxies in both FIRES fields at . We modeled these samples in the exact same way as the DRGs.
6.1. How Different are DRGs and LBGs?
An immediate implication of the model results presented in § 5 is that DRGs appear to be older, more obscured, and with higher stellar masses than LBGs. Our sample of optically-selected LBGs at and in HDF-S allows a consistent comparison, based on the same data and with identical model ingredients and assumptions. With our standard CSF model, we derive median values for the LBGs of , , , , and . With the model, we find lower median age of 360 Myr and SFR of , but the same median extinction, stellar mass, and M/L ratio. We cannot statistically discriminate between the fits for different SFHs for any of our LBGs.
Compared to the HDF-S LBGs and with CSF, our DRGs are typically times older, times more obscured, have roughly an order of magnitude higher stellar mass, and form stars at times higher instantaneous rates (based on the median properties). Among the various declining SFHs we considered, the model leads to the lowest extinction for the DRGs (Figure 10). One might expect that this SFH reduces most the inferred differences between the two populations. The DRGs, however, remain distinct from LBGs in their median properties except for the SFR, being 3 times older, 1.5 times more extincted, times more massive, and times as actively star-forming. As for the DRGs, the LBGs show an appreciable dispersion in best-fit properties with some overlap with DRGs. However, the differences in the median values and combinations thereof (especially age, , and ) indicate that the ensemble properties of the two populations are different for either SFH.
The distinction between the DRGs and LBGs is best illustrated in Figure 11, which compares the distribution of the two populations in the plane (where the median uncertainties from the 68% confidence intervals are in and in for the DRG and LBG samples, and our two standard models). In this parameter space, the overlap is very small for the CSF model. For the model, about two-thirds of the DRGs shift to a lower extinction interval , in common with the LBGs, while the rest uniformly populates the higher range explored. The ensemble of DRGs and LBGs remain however clearly separated in the ranges of ratios covered, with very little overlap. This is driven by the stellar masses since the DRG and LBG samples are similarly luminous in the rest-frame band, with nearly identical median values of (within 20%).
The weakness of our HDF-S LBG sample is that ’s are available for seven out of 33 galaxies. However, we arrive at similar conclusions if we consider the model results for the spectroscopically confirmed LBG samples of Papovich et al. (2001) and Shapley et al. (2001), also based on optical to NIR SEDs. The typical (median or geometric mean) ages inferred are , with extinction and (for , a Salpeter IMF down to 0.1, and our adopted cosmology). Our results are within a factor of a few of those of Papovich et al. and Shapley et al., similar to the difference between the latter two. It is however difficult to compare in detail the results among all three studies. The data sets are different in terms of depth, quality, and photometric bands involved. The sample of Papovich et al. (2001) was selected in the HDF-N from the space-based HST data while the ground-based sample of Shapley et al. (2001) was selected over a much wider area and is brighter. In their modeling, Papovich et al. (2001) assumed exponentially declining SFHs with the timescale as a free parameter. Shapley et al. (2001) did not attempt to fit the SFH and discuss mainly the CSF scenario. In addition, the models of Papovich et al. and Shapley et al. relied on earlier versions of the Bruzual & Charlot code and partly different model ingredients. In view of this, it is probably fair to say that the properties derived for all three LBG samples are in broad agreement. The conclusions about the differences between DRGs and LBGs remain qualitatively the same.
6.2. Derived Properties versus Observed NIR Properties
We investigated relationships between the modeled quantities and the observed NIR properties, the key feature of our DRG selection. For this purpose, we complemented the DRG samples with the HDF-S LBGs and all other -band selected galaxies at in both the HDF-S and fields down to the same limits of 22.5 and 21.7 mag, respectively.
Figure 12 plots, for our standard model, the derived stellar masses and M/L ratios as a function of observed colour and -band magnitude. The results with the CSF are qualitatively similar. There is a clear correlation between the derived and the observed colour, which is even tighter for the ratio. The redder the objects, the higher the stellar masses and mass-to-light ratios. The DRGs lie at the massive end and extend smoothly the relationships for the objects with bluer colours, including the LBGs. Because of the different limiting magnitudes between the HDF-S and fields, it is difficult to draw conclusions on the variations of and versus . The data suggest that our -band selection does not miss a significant fraction of massive galaxies at that would be faint because of extinction effects.
Figure 13 plots the variations of the derived extinctions and instantaneous star formation rates per unit stellar mass with observed colours. Results for both the standard CSF and models are shown. There are general trends of increasing and of decreasing with redder colour. The variations in derived ages (not shown in Figure 13) are essentially the reverse of those in the ratio, which provides a measure of (with a direct proportionality for the CSF model, and a non-linear monotonic relation for the model). These plots further show that if DRGs might be exceptional in their high absolute SFRs, they are not at all in terms of their SFR per unit mass.
6.3. Past History and Future Fate of DRGs
We here speculate about the evolution of the DRGs in the FIRES fields, based on the results for the CSF and models. Figure 14 plots the relative variations with redshift of the average SFR of the DRG samples and, for comparison, of the HDF-S LBG sample at . We computed the curves from the model SFR used as input in the evolutionary synthesis. For each galaxy, we scaled the model curves to match the derived instantaneous SFR at the epoch of observation. For the purpose of this discussion, we in fact assumed that all galaxies lie at , close to the mean and median redshift of both our DRG and LBG samples (see § 3). We then normalized the resulting average SFR curves to unity at .
For the CSF model, the average instantaneous SFR of the DRG samples has not varied strongly since up to , increasing by a factor of with time. On the other hand, the average instantaneous SFR of the HDF-S LBG sample has increased by more than an order of magnitude over the same redshift interval. For the model, the variations are much noisier but indicate, broadly speaking, roughly comparable activity levels in the past out to , where the mean instantaneous SFR of LBGs drops abruptly. The relative variations in average SFR backwards in time are dominated by the age distribution among each population, and the steeper drop for the LBGs reflects their younger ages compared to the DRGs. This extrapolation of the star formation histories suggests that DRGs have started forming stars at very early epochs, and earlier than LBGs have. A possible scenario for DRGs is that they are the evolved descendants of systems that experienced a “Lyman-break phase” at (see also Franx et al., 2003; van Dokkum et al., 2003, 2004). This evolutionary picture may be consistent with the increased reddening in rest-frame UV-to-optical colours inferred by Papovich et al. (2004) for Lyman-break selected galaxies between (“-dropouts”) and (“-dropouts”). We emphasize that the above discussion applies to the stellar populations that dominate the rest-frame UV-optical emission of the galaxies, as traced by the observed SEDs.
As discussed by van Dokkum et al. (2004), the stellar masses of DRGs are already very high at and comparable to those of early-type galaxies locally. This may indicate that DRGs have already assembled most of their stellar mass at these redshifts and evolve thereafter mostly passively. Using our CSF model results, we estimated the stellar masses predicted at if star formation is maintained at the same rate as inferred at the redshift of observation. The median present-day stellar masses would be , which correspond to the most massive galaxies in local galaxy clusters. While some of the DRGs might evolve into such systems, it seems rather unlikely we have detected such large numbers of their progenitors in our two small fields. More plausibly, most of the DRGs probably become predominantly quiescent systems at , and may possibly grow further in mass during brief merger events. Assuming that DRGs stop forming stars around their redshift of observation and evolve passively thereafter, the CSF models predict colours of and at , even if all the dust is removed at the instant when star formation is quenched (such red colours are also predicted using the models instead). This may suggest an evolutionary connection between DRGs at and EROs at .
In absolute terms, the instantaneous SFRs of derived from the SED modeling assuming CSF lie at the high end inferred for the local galaxy population, in the regime of luminous and ultra-luminous infrared galaxies. Such a high SFR rate seems supported by the possible detection of one of the non-AGN spectroscopically-confirmed DRG in the field at sub-millimeter wavelengths from deep SCUBA observations (van Dokkum et al. 2004; K. Kraiberg Knudsen et al. 2004, in preparation). The CSF hypothesis is unverifiable with the data at hand, and may be a valid representation for a few objects only. Conversely, while the model implies substantially lower instantaneous SFR at the redshift of observation, the high stellar masses lead to extremely high SFRs at earlier epochs (). Obviously, the SFH of DRGs may well be more complex than our simplistic assumptions. The less model-dependent estimate from of seems to suggest elevated levels of star formation activity averaged over the lifetime of the stellar populations traced by our SEDs.
6.4. Relative Importance of DRGs and LBGs at
Using the results presented in this paper, we can crudely assess the relative importance of the DRG and LBG populations at high redshift. In the following, we consider our samples of DRGs, LBGs, and -band selected sources lying at and to the total magnitude limits of 22.5 for HDF-S and 21.7 for the field. In HDF-S, the LBGs outnumber the DRGs by a factor of three. They contribute about 2.5 times more than DRGs to the total observed -band light and extrinsic rest-frame -band luminosity from all sources, with fractions of and , respectively. The relative contributions are reversed for the stellar mass, where DRGs account for of the total compared to for LBGs (using the individual ’s derived from either the CSF or models, and assuming the same model parameters for all populations). In the field and to the corresponding brighter magnitude limit, the DRGs produce about 35% of the total observed -band light and , and make up of the integrated .
This provides a first-order indication that DRGs may represent a significant constituent of the universe in terms of stellar mass. Admittedly, our estimates are rough. A detailed analysis of the contribution of DRGs to the stellar mass budget in both FIRES fields will be presented by G. Rudnick et al. (in preparation; see also Rudnick et al. 2003 for first estimates in HDF-S).
7. SUMMARY AND CONCLUSIONS
We have presented the analysis and theoretical modeling of the SEDs of 34 DRGs at . The galaxies were selected by their colours in the HDF-S and fields observed as part of the FIRES survey (Franx et al., 2000), at and , respectively. The addition of the field increases the area surveyed by a factor of five to an brighter limit and triples the original sample from HDF-S. This allows for the first time a robust assessment of the ensemble properties of DRGs. We find large numbers of red objects in both fields, with surface densities of at . Since no source is found in the HDF-N down to , cosmic variance is substantial. Observations of wider areas and multiple lines of sight will be required for a more reliable determination of the surface density of the red population.
Using new diagnostic diagrams involving the , , and colours, we have shown that the red NIR colours of the DRGs cannot be attributed to extinction effects alone and require the presence of a prominent Balmer/4000 Å break characteristic of evolved stars for a large fraction of them. In the rest-frame optical, the SEDs of DRGs fall within the envelope of normal nearby galaxies and, in the rest-frame UV, indicate a wide range in star formation activity and/or dust obscuration. The rest-frame UV-to-optical SEDs of DRGs are in stark contrast with those of LBGs, which are much bluer and more uniform. These differences can be easily understood in terms of selection effects. The LBG criteria preferentially select galaxies that are actively star-forming and modestly obscured. Our criterion primarily targets evolved systems, ranging from those with quiescent or no star formation and little extinction to those that are highly obscured and vigorously forming stars.
We have applied evolutionary synthesis models to the SEDs of our DRGs to constrain quantitatively the age of the stellar populations, the extinction, the stellar masses, and the star formation rates. We have also investigated the effects of variations in the assumed star formation history, metallicity, and extinction law on the model results. The derived properties are similar for the HDF-S and field samples. For constant star formation, a Salpeter IMF between 0.1 and 100, solar metallicity, and the Calzetti et al. (2000) extinction law, we obtain for each field a median age , extinction , stellar mass , stellar mass-to-light ratio , and instantaneous star formation rate . The stellar masses and M/L ratios are the most robust properties against variations in the model parameters (neglecting those of the IMF) while the instantaneous SFRs are strongly model-dependent. Models with exponentially declining star formation rates and -folding timescales in the range generally lead to lower ages, extinction values, and instantaneous SFRs but similar stellar masses and M/L ratios within a factor of two. The smallest median ’s are derived with . For this model and the assumptions above for the IMF, metallicity, and extinction law, the median age and are 1 Gyr and 0.9 mag for both fields, and the median SFRs .
An important implication of our work is that DRGs appear to be dominated by significantly older, more obscured, and more massive stellar populations than LBGs at similar redshifts and similar rest-frame -band luminosities. Using our sample of optically-selected LBGs in HDF-S, we have explicitely shown that the distinction holds for constant star formation and models, the two star formation histories that bracket the range of median ’s derived for our DRGs (neglecting variations in model parameters between the two classes). For both DRGs and LBGs, there is a large spread in derived properties among individual objects and some of the DRGs have ages, extinction, and stellar masses characteristic of LBGs, and vice-versa. However, the overlap is small, especially for the stellar masses and M/L ratios. Comparison with the LBG studies of Papovich et al. (2001) and Shapley et al. (2001) is less straightforward because of differences in the optical/NIR data sets, in the details of the sample selection, and in the modeling but, broadly speaking, it supports the same conclusions. More generally, we find that the derived age, extinction, and stellar mass all increase with redder colour among the full sample of -band-selected galaxies in the FIRES fields, down to the same magnitude limits as the DRG samples. The relationships are particularly well-defined for the stellar mass and M/L ratio versus colour.
If DRGs represent the most evolved and most massive galaxies at , it is tempting to speculate that they might be the precursors of the most massive present-day galaxies. Such a final fate has been proposed for LBGs at in the context of hierarchical models of galaxy formation (e.g. Baugh et al., 1998). For DRGs, with stellar masses already similar to those of local early-type galaxies, one may reason in a simplistic way that there is little room for substantial growth through subsequent merger events. Extrapolating the star formation histories backward in time for both DRGs and LBGs at , we infer that the DRG population has been forming stars at a roughly constant rate and possibly back to , whereas the LBGs started to form later at . This is consistent with a scenario in which the DRGs are the evolved descendants of systems undergoing a “Lyman-break phase” at . The DRGs may evolve into the ERO population at . Another intriguing possibility is a connection with the high-redshift population detected at sub-millimeter wavelengths. One of the DRGs in the field likely is the counterpart of a sub-millimeter source detected with SCUBA (van Dokkum et al. 2004; K. Kraiberg Knudsen et al. 2004, in preparation). In addition, although detailed information is currently available for a few objects only, recent work indicates that some of the bright sub-millimeter galaxies at host evolved stellar populations, show evidence of substantial chemical enrichment, and have dynamical/stellar masses (e.g. Genzel et al., 2003; Neri et al., 2003; Tecza et al., 2004).
The results presented here constitute a major improvement over our previous studies of selected objects at . Significant uncertainties remain, however, and further investigations are clearly needed. Our analysis still relies on a limited sample selected from two small fields and the model parameters are largely unconstrained. Deep photometric surveys of wider areas and disjoint fields as well as extensive follow-up spectroscopy will be crucial to assess (and average over) field-to-field variations, secure the redshifts, derive robust number densities, and constrain more accurately the physical properties (e.g., extinction, metallicity, dynamical masses). The current dearth of constraints on the nature of DRGs further limits our ability to interpret their observed properties. In that respect, it will be very important to establish firmly the frequency of AGN among DRGs and their contribution to the measured optical/NIR SEDs, in particular from spectroscopy. It will also be important to obtain independent constraints on the current and past star formation rates, with observations at infrared and submillimeter wavelengths (e.g., with SCUBA and the Spitzer Space Telescope) complementing rest-frame optical line diagnostics. Ultimately, a better understanding of DRGs and their relationship to other galaxy populations at high and low redshift may provide important constraints on the assembly history of massive galaxies.
References
- Allen (1976) Allen C. W. 1976, in Astrophysical Quantities, University of London eds., The Athlone Press, p. 264
- Baugh et al. (1998) Baugh, C. M., Cole, S., Frenk, C. S., & Lacey, C. G. 1998, ApJ, 498, 504
- Bertin & Arnouts (1996) Bertin, E., & Arnouts, S. 1996, A&AS, 117, 393
- Bolzonella et al. (2000) Bolzonella, M., Miralles, J.-M., & Pelló, R. 2000, A&A, 363, 476
- Bouchet et al. (1985) Bouchet, P., Lequeux, J., Maurice, E., Prévot, L., & Prévot-Burnhon, M. L. 1985, A&A, 149, 330
- Bruzual & Charlot (1993) Bruzual, A.G., & Charlot, S. 1993, ApJ, 405, 538
- Bruzual & Charlot (2003) Bruzual, A.G., & Charlot, S. 2003, MNRAS, 344, 1000
- Buta et al. (1994) Buta, R., Mitra, S., de Vaucouleurs, G., & Corwin, H. G., Jr. 1994, AJ, 107, 118
- Calzetti et al. (2000) Calzetti, D., Armus, L., Bohlin, R. C., Kinney, A. L., Koornneef, J., & Storchi-Bergmann, T. 2000, ApJ, 533, 682
- Casertano et al. (2000) Casertano, S., et al. , 2000, AJ, 120, 2747
- Chabrier (2003) Chabrier, G. 2003, PASP, 115, 763
- Coleman et al. (1980) Coleman, G.D., Wu, C.-C., & Weedman, D.W. 1980, ApJS, 43, 393
- Daddi et al. (2000) Daddi, E., Cimatti, A., Pozzetti, L., Hoekstra, H., Röttgering, H. J. A., Renzini, A., Zamorani, G., & Mannucci, F. 2000, A&A, 361, 535
- Daddi et al. (2003) Daddi, E., et al. 2003, ApJ, 588, 50
- Dickinson et al. (2000) Dickinson, M., et al. , 2000, ApJ, 531, 624
- Elston et al. (1988) Elston, R., Rieke, G. H., & Rieke, M. J. 1988, ApJ, 331, L77
- Erb et al. (2003) Erb, D. K., Shapley, A. E., Steidel, C. C., Pettini, M., Adelberger, K. L., Hunt, M. P., Moorwood, A. F. M., & Cuby, J.-G. 2003, ApJ, 591, 101
- Ferguson et al. (2002) Ferguson, H. C., Dickinson, M., & Papovich, C. 2002, ApJ, 569, L65
- Fernández-Soto et al. (1999) Fernández-Soto, A., Lanzetta, K. M., & Yahil, A. 1999, ApJ, 513, 34
- Franx et al. (2000) Franx, M., et al. 2000, The Messenger, 99, 20
- Franx et al. (2003) Franx, M., et al. 2003, ApJ, 587, L79
- Genzel et al. (2003) Genzel, R., Baker, A. J., Tacconi, L. J., Lutz, D., Cox, P., Guilloteau, S., & Omont, A. 2003, ApJ, 584, 633
- Giavalisco & Dickinson (2001) Giavalisco, M., & Dickinson, M. 2001, ApJ, 550, 177
- Giavalisco et al. (1998) Giavalisco, M., Steidel, C. C., Adelberger, K. L., Dickinson, M. E., Pettini, M., & Kellogg, M. 1998, ApJ, 503, 543
- Hall et al. (2001) Hall, P. B., et al. , 2001, AJ, 121, 1840
- Hoekstra et al. (2000) Hoekstra, H., Franx, M., & Kuijken, K. 2000, ApJ, 532, 88
- Hu & Ridgway (1994) Hu, E. M., & Ridgway, S. E. 1994, AJ, 107, 1303
- Jansen et al. (2000) Jansen, R. A., Franx, M., Fabricant, D., & Caldwell, N. 2000, ApJS, 126, 271
- Kinney et al. (1996) Kinney, A. L., Calzetti, D., Bohlin, R. C., McQuade, K., Storchi-Bergmann, T., & Schmitt, H. R. 1996, ApJ, 476, 38
- Koekemoer et al. (2004) Koekemoer, A. M.., et al. , 2004, ApJ, 600, L123
- Kron (1980) Kron, R. G. 1980, ApJS, 43, 305
- Kroupa (2001) Kroupa, P. 2001, MNRAS, 322, 231
- Labbé et al. (2003) Labbé, I., et al. 2003, AJ, 125, 1107
- Madau (1995) Madau, P. 1995, ApJ, 441, 18
- McCarthy et al. (2001) McCarthy, P. J., et al. , 2001, ApJ, 560, L131
- Moorwood et al. (1998) Moorwood, A. F. M., et al. , 1998, The Messenger, 94, 7
- Neri et al. (2003) Neri, R., et al. 2003, ApJ, 597, L113
- Norman et al. (2002) Norman, C., et al. , 2002, ApJ, 571, 218
- Oke (1971) Oke, J. B. 1971, ApJ, 170, 193
- Papovich et al. (2001) Papovich, C., Dickinson, M., & Ferguson, H. C. 2001, ApJ, 559, 620
- Papovich et al. (2004) Papovich, C., et al. 2004, ApJ, 600, L111
- Pettini et al. (2001) Pettini, M., Shapley, A. E., Steidel, C. C., Cuby, J.-G., Dickinson, M., Moorwood, A. F. M., Adelberger, K. L., & Giavalisco, M. 2001, ApJ, 554, 981
- Prévot et al. (1984) Prévot, M. L., Lequeux, J., Prévot, L., Maurice, E., & Rocca-Volmerange, B. 1984, A&A, 132, 389
- Rudnick et al. (2001) Rudnick, G., et al. , 2001, AJ, 122, 2205
- Rudnick et al. (2003) Rudnick, G., et al. 2003, ApJ, 599, 847
- Saracco et al. (2001) Saracco, P., Giallongo, E., Cristiani, S., D’Odorico, S., Fontana, A., Iovino, A., Poli, F., & Vanzella, E. 2001, A&A, 375, 1
- Saracco et al. (2003) Saracco, P., et al. , 2003, A&A, submitted (astro-ph/0310131)
- Schlegel et al. (1998) Schlegel, D. J., Finkbeiner, D. P., & Davis, M. 1998, ApJ, 500, 525
- Scodeggio & Silva (2000) Scodeggio, M., & Silva, D. R. 2000, A&A, 359, 953
- Shapley et al. (2004) Shapley, A. E., Erb, D. K., Pettini, M., Steidel, C. C., & Adelberger, K. L. 2004, ApJ, in press (astro-ph/0405187)
- Shapley et al. (2001) Shapley, A. E., Steidel, C. C., Adelberger, K. L., Dickinson, M., Giavalisco, M., & Pettini, M. 2001, ApJ, 562, 95
- Shapley et al. (2003) Shapley, A. E., Steidel, C. C., Pettini, M., & Adelberger, K. L. 2003, ApJ, 588, 65
- Smith et al. (2002) Smith, G. P., et al. , 2002, MNRAS, 330, 1
- Steidel et al. (1999) Steidel, C. C., Adelberger, K. L., Giavalisco, M., Dickinson, M., & Pettini, M. 1999, ApJ, 519, 1
- Steidel & Hamilton (1993) Steidel, C. C., & Hamilton, D. 1993, AJ, 105, 2017
- Steidel et al. (1996a) Steidel, C. C., Giavalisco, M., Dickinson, M., & Adelberger, K. L. 1996a, AJ, 112, 352
- Steidel et al. (1996b) Steidel, C. C., Giavalisco, M., Pettini, M., Dickinson, M., & Adelberger, K. L. 1996b, ApJ, 462, L17
- Tecza et al. (2004) Tecza, M., et al. 2004, ApJ, in press (astro-ph/0403264)
- Thompson et al. (1999) Thompson, D., et al. , 1999, ApJ, 523, 100
- Totani et al. (2001) Totani, T., Yoshii, Y., Iwamuro, F., Maihara, T., & Motohara, K. 2001, ApJ, 558, L87
- van Dokkum et al. (2003) van Dokkum, P. G., et al. 2003, ApJ, 5887, L83
- van Dokkum et al. (2000) van Dokkum, P.G., Franx, M., Fabricant, D., Illingworth, G.D., & Kelson, D.D. 2000, ApJ, 541, 95
- van Dokkum et al. (2004) van Dokkum, P. G., et al. 2004, ApJ, in press (astro-ph/0404471)
- Yan et al. (2000) Yan, L., McCarthy, P. J., Weymann, R. J., Malkan, M. A., Teplitz, H. I., Storrie-Lombardi, L. J., Smith, M., & Dressler, A. 2000, AJ, 120, 575
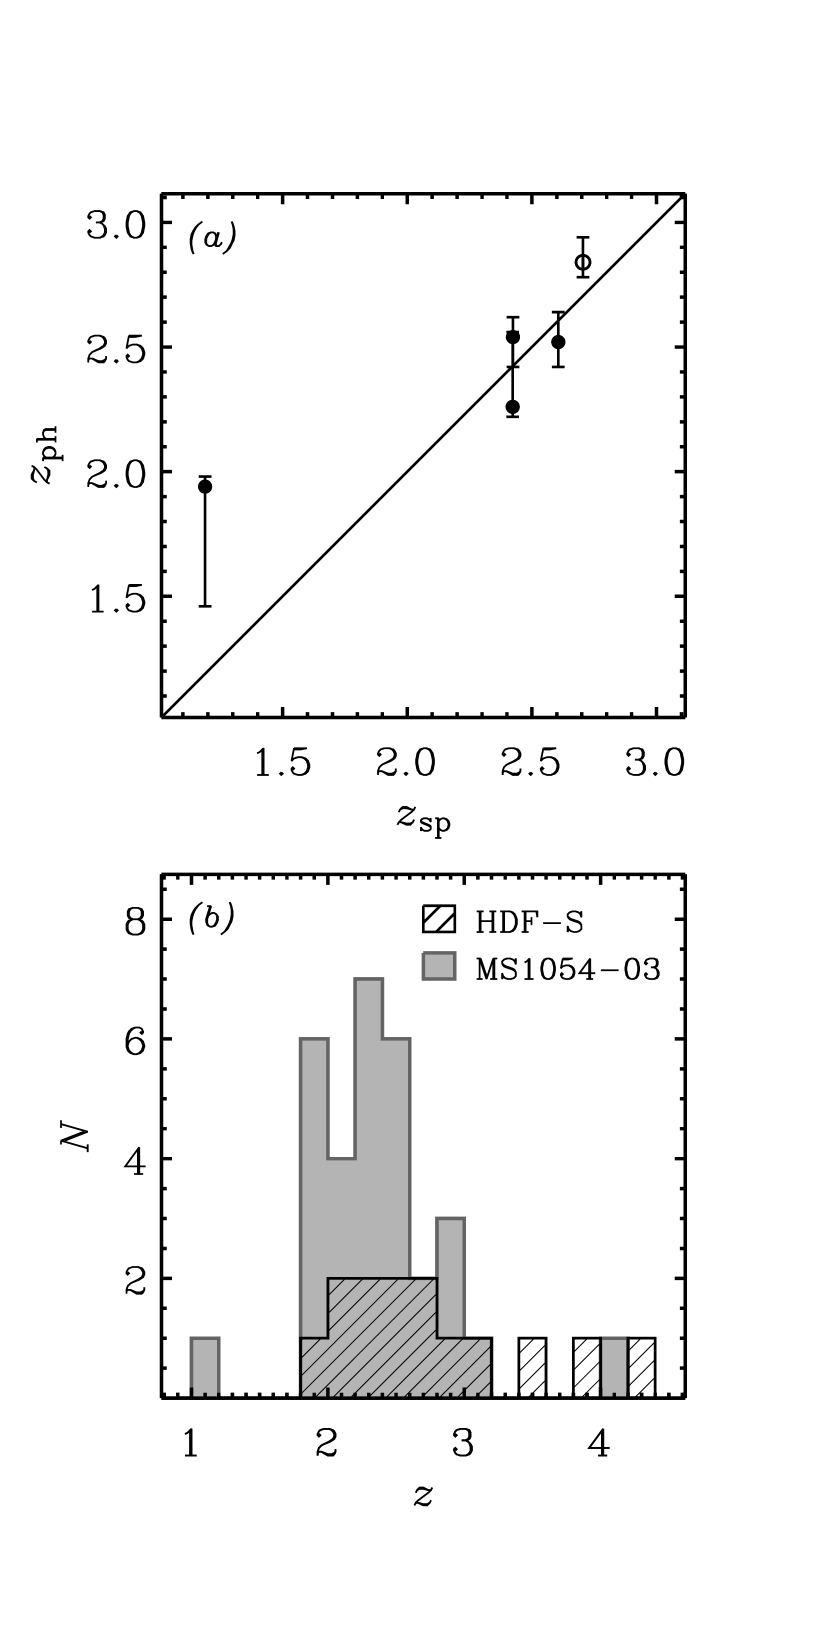
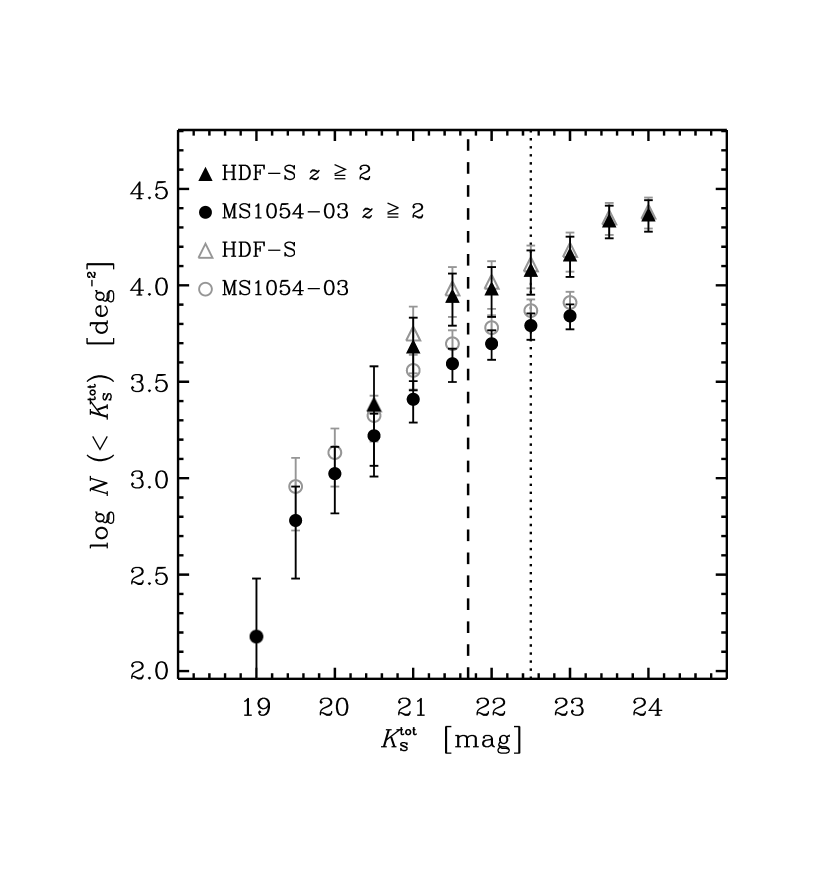
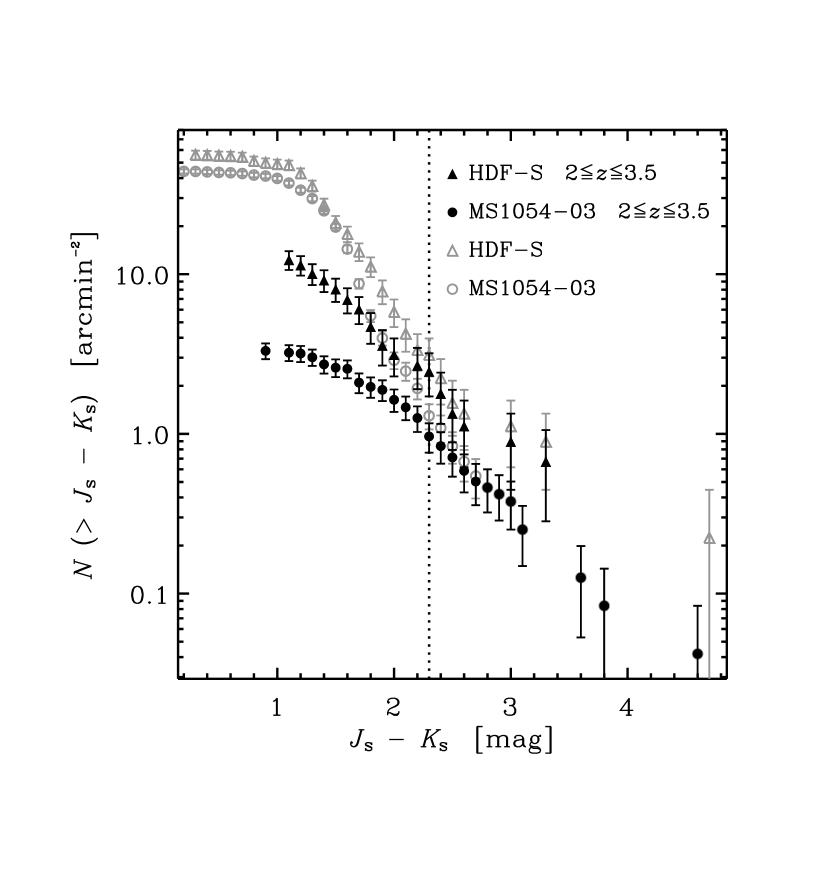

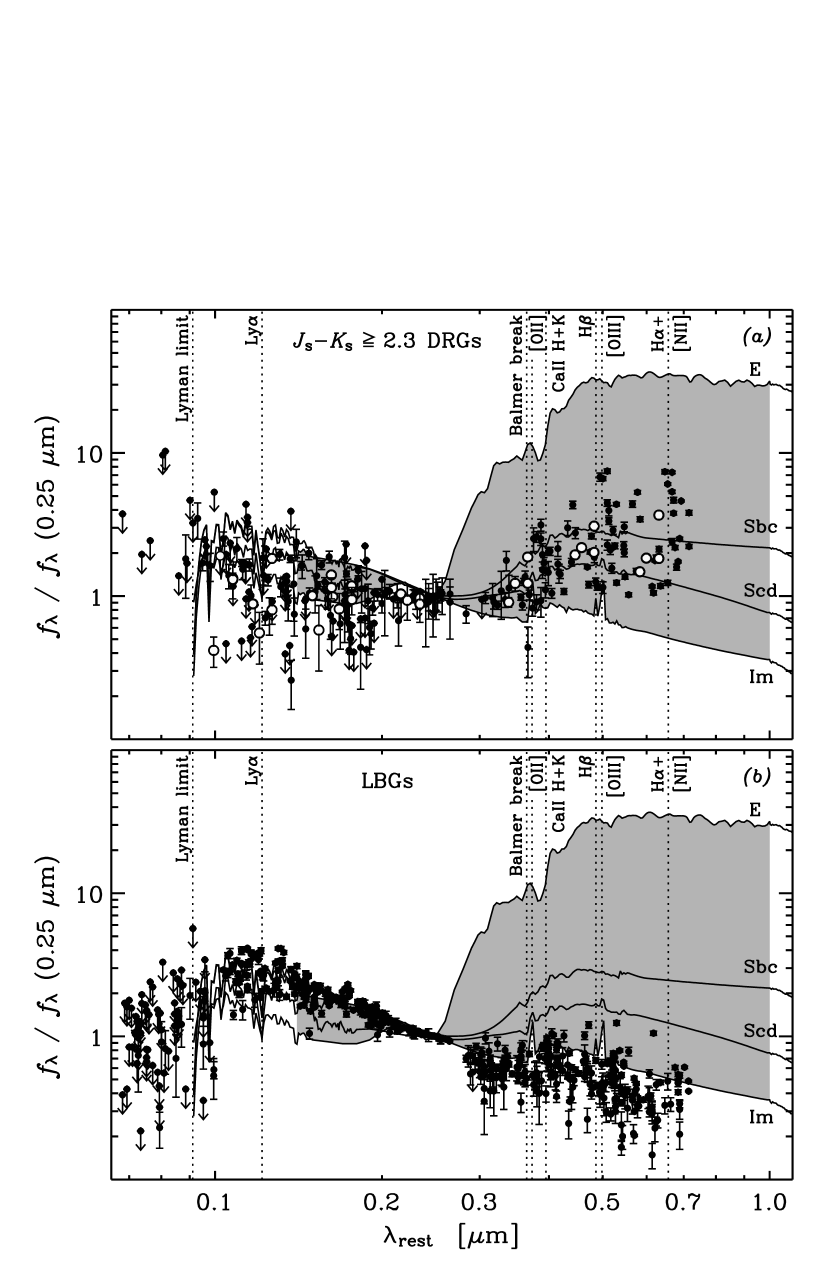
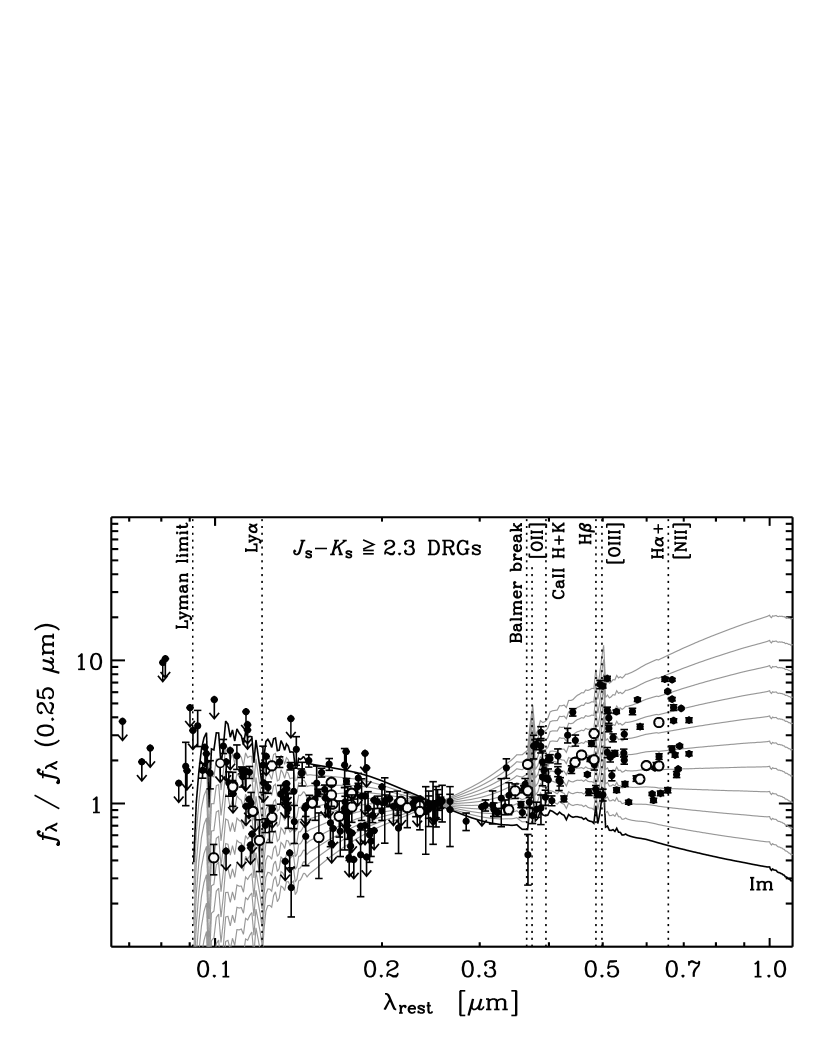
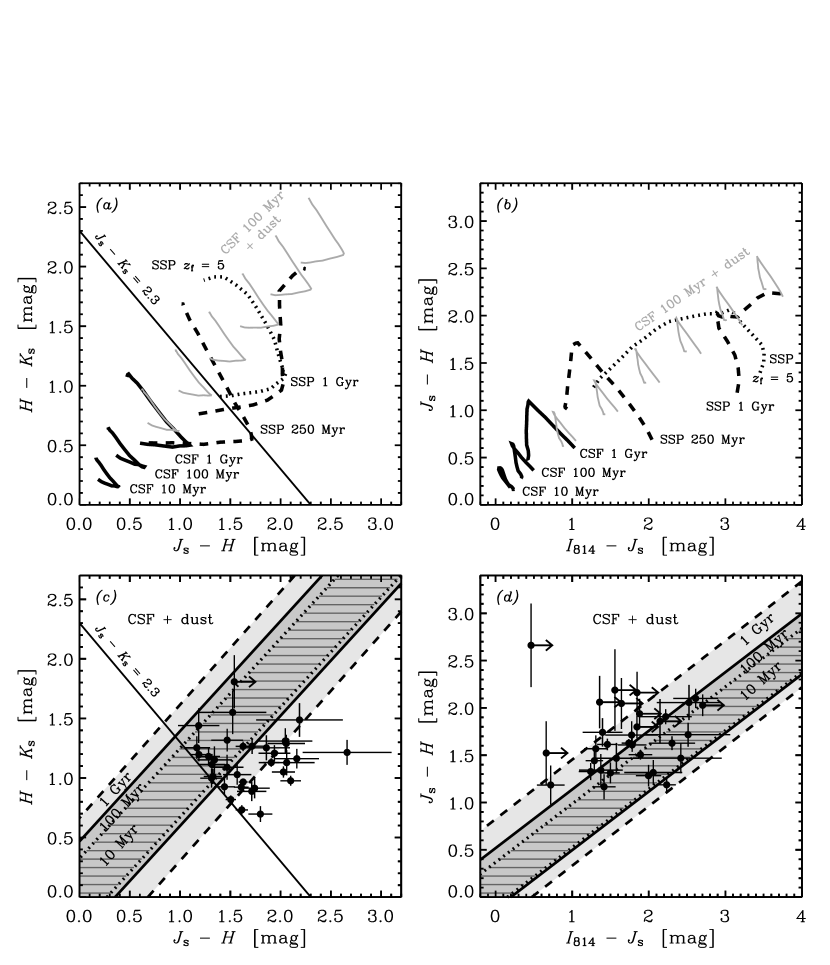
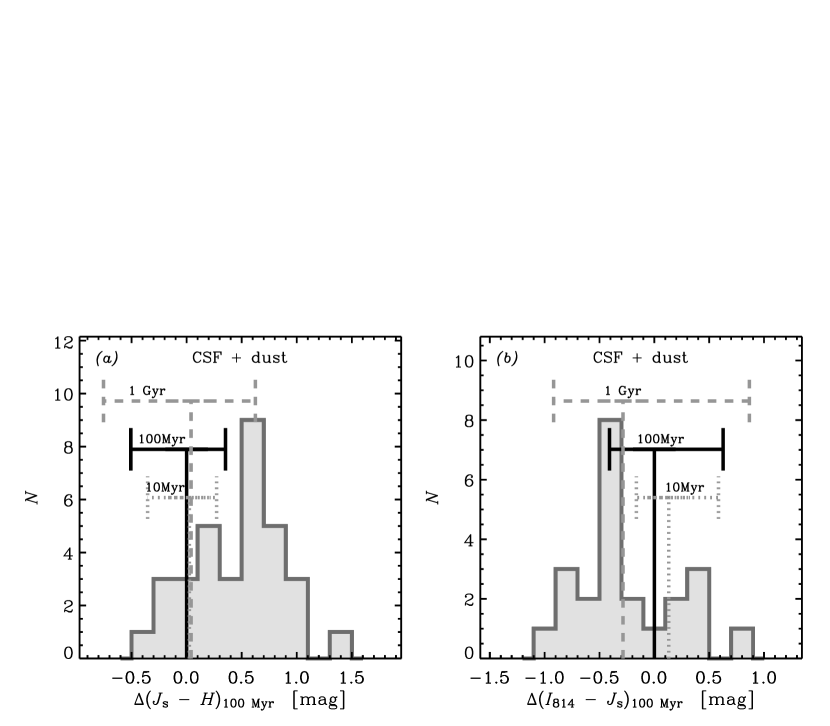
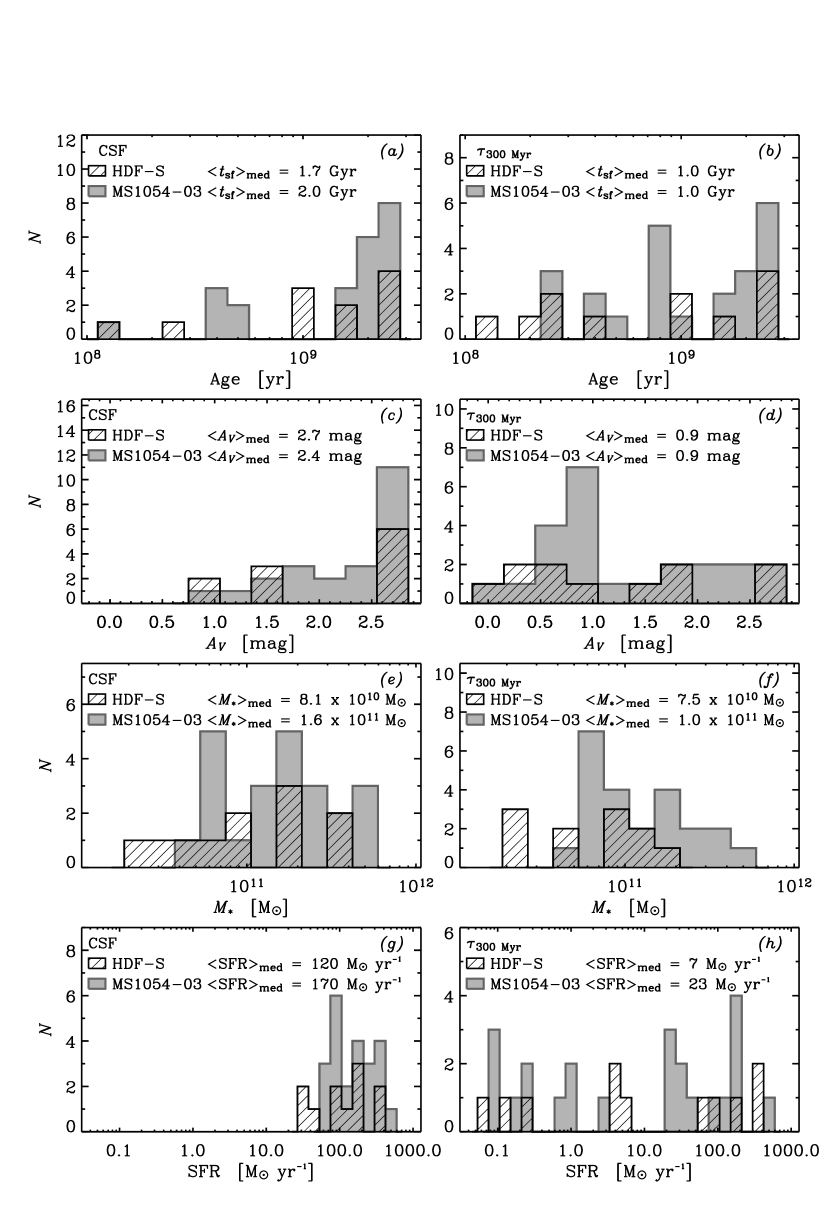
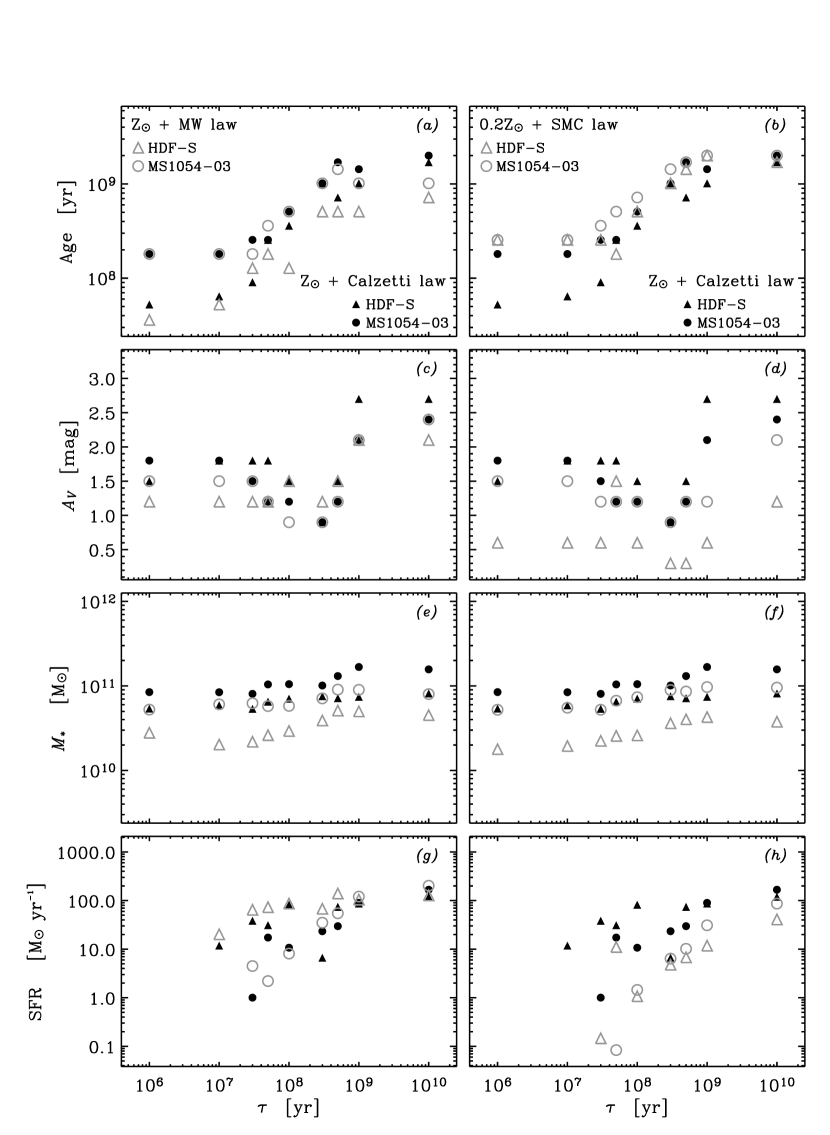
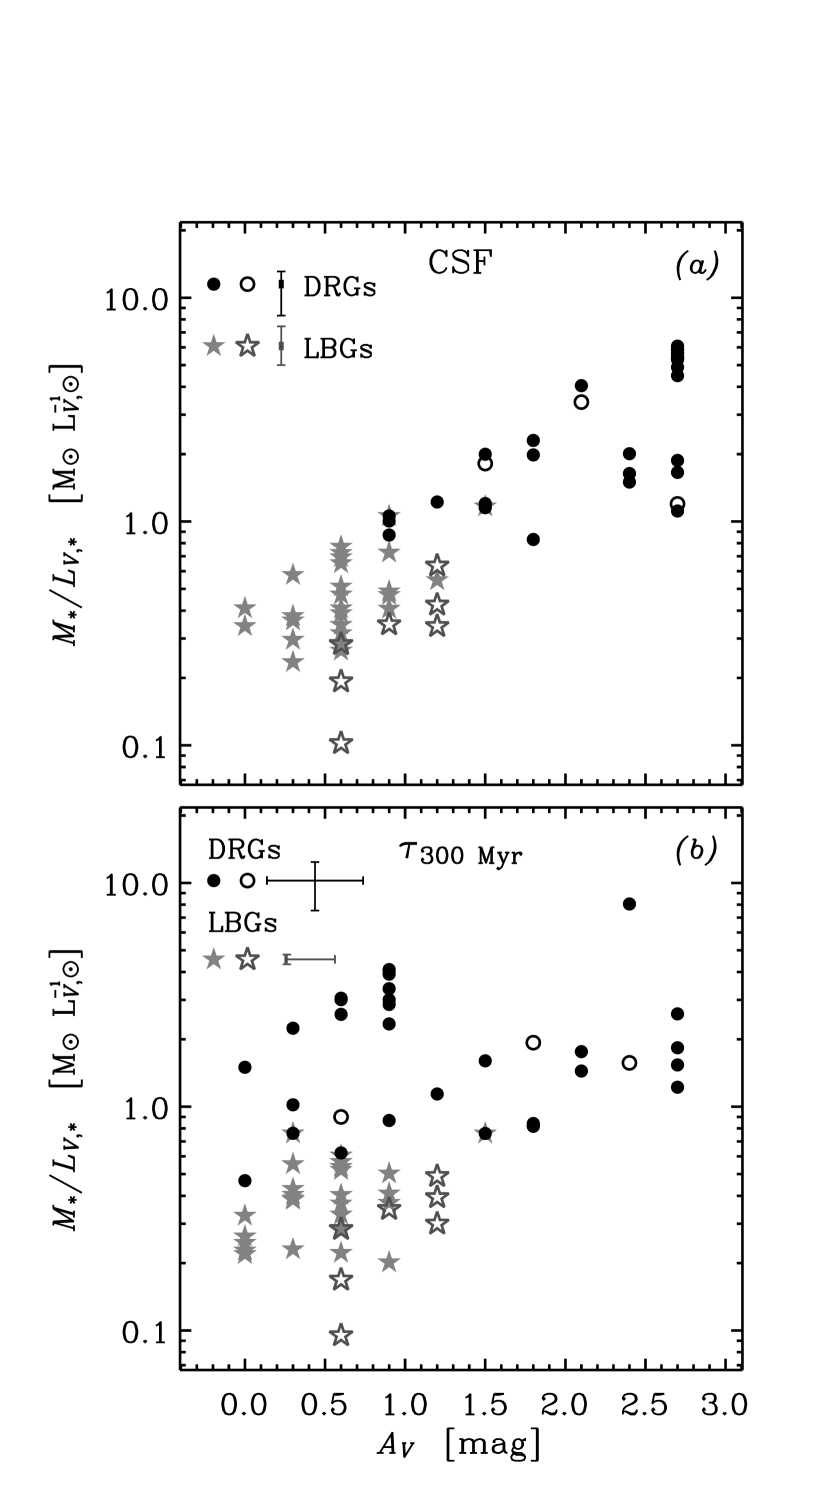
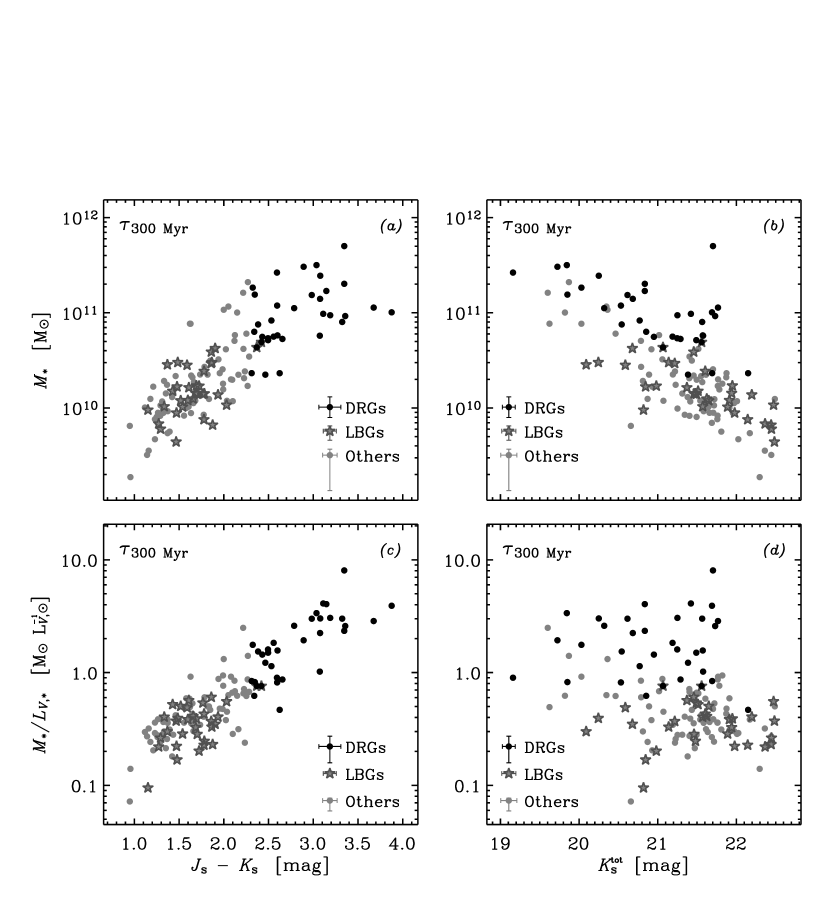
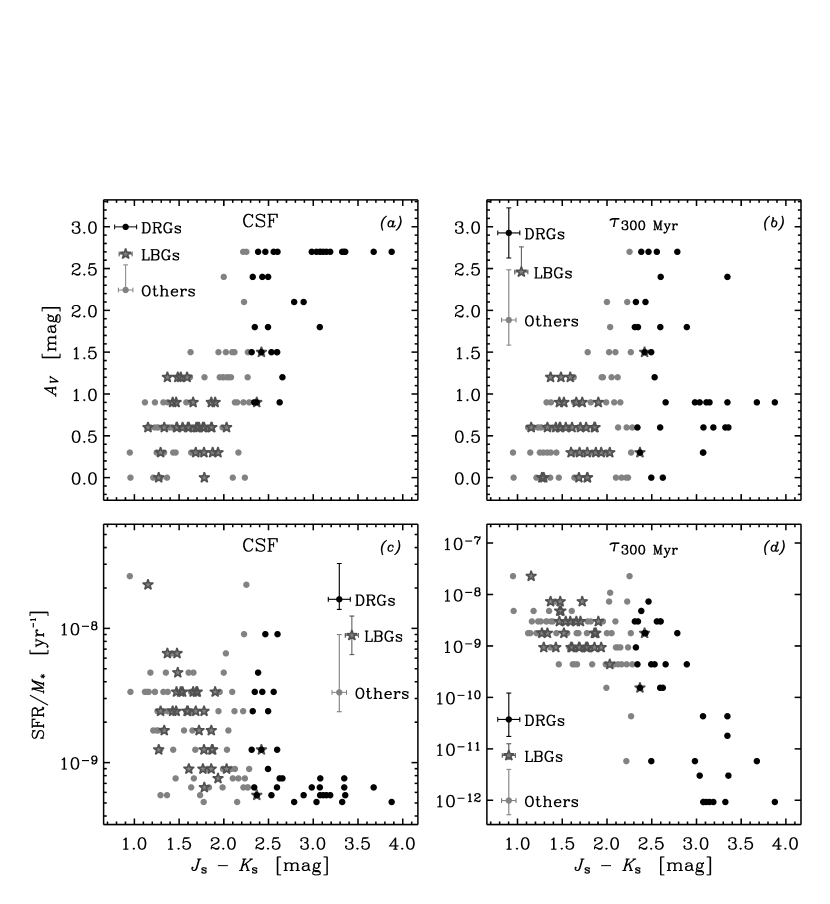
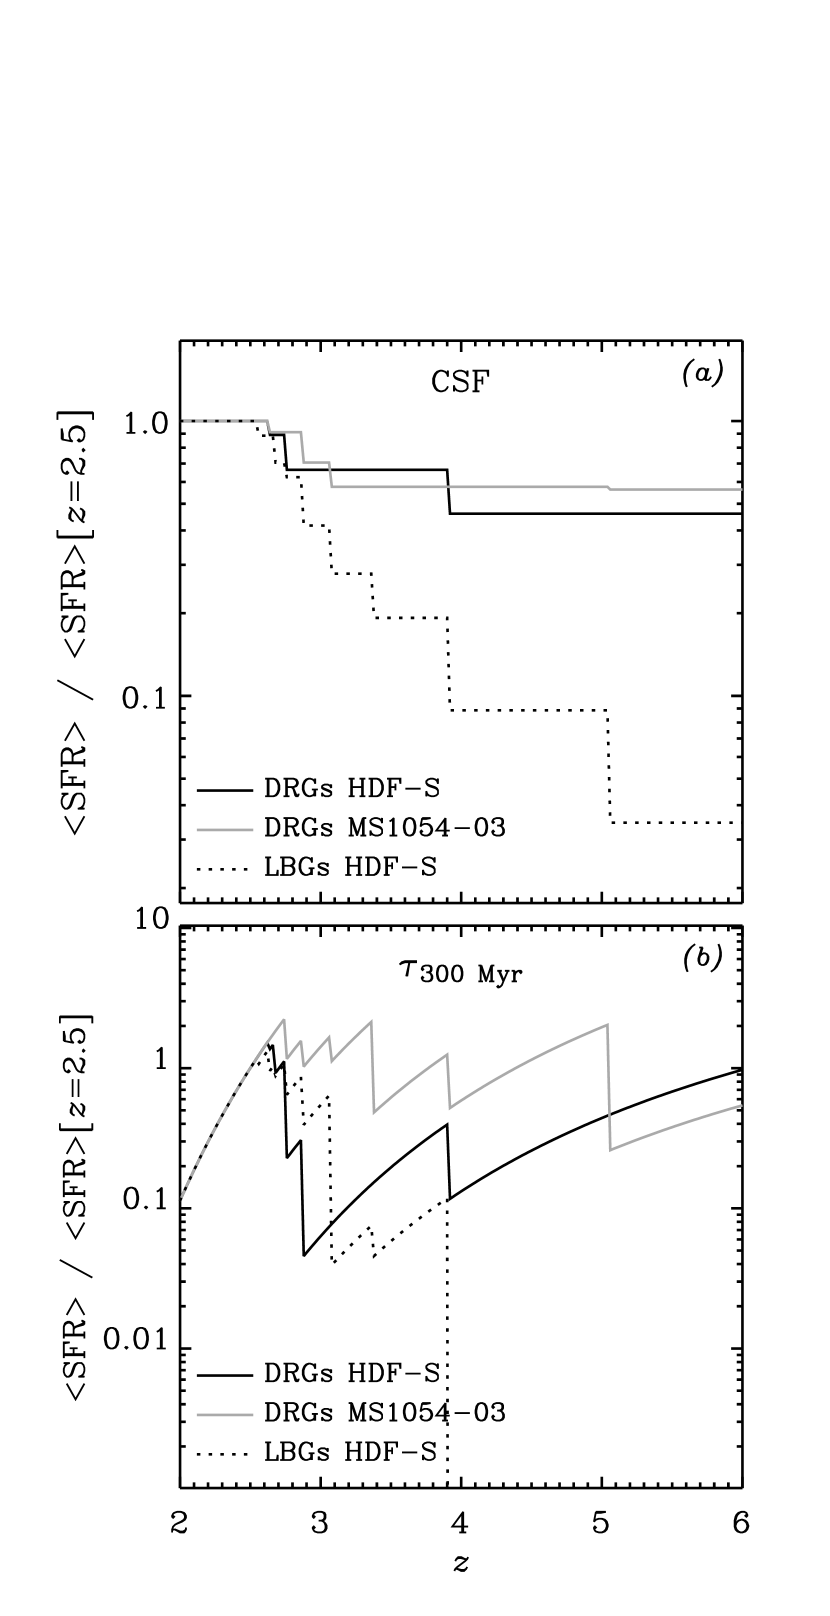
| HDF-S: 11 DRGs at | ||||
|---|---|---|---|---|
| Property | Median | Mean | rms | |
| (mag) | 21.39 | 21.25 | 0.55 | |
| (mag) | 26.33 | 26.69 | 0.96 | |
| (mag) | 2.60 | 2.75 | 0.43 | |
| … | 2.50 | 2.60 | 0.42 | |
| : 23 DRGs at | ||||
| Property | Median | Mean | rms | |
| (mag) | 20.95 | 20.84 | 0.74 | |
| (mag) | 26.86 | 26.61 | 0.94 | |
| (mag) | 2.79 | 2.85 | 0.43 | |
| … | 2.42 | 2.44 | 0.30 | |
Note. — All magnitudes are expressed in the Vega system. The and data for the field sample are corrected for the (small) lensing magnifications.
| HDF-S | |||||||
|---|---|---|---|---|---|---|---|
| CSF | |||||||
| Property | Median | Mean | rms | Median | Mean | rms | |
| Age | (Gyr) | 1.7 | 1.5 | 0.86 | 1.0 | 1.1 | 1.0 |
| SFR-weighted age | (Gyr) | 0.85 | 0.74 | 0.43 | 0.75 | 0.93 | 0.92 |
| (mag) | 2.7 | 2.0 | 0.78 | 0.90 | 1.20 | 0.96 | |
| () | 8.1 | 15 | 13 | 7.5 | 7.9 | 5.7 | |
| bb The values were obtained independently, based on the less model-dependent method described by Rudnick et al. (2003), and are the dust-attenuated luminosities. These estimates are used in all ratios involving . The ages, extinctions, stellar masses, and instantaneous SFRs were derived from the best-fit model to the SEDs. | () | 5.0 | 5.7 | 3.6 | 5.0 | 5.7 | 3.6 |
| () | 1.2 | 2.7 | 2.2 | 1.2 | 1.5 | 0.89 | |
| () | 91 | 120 | 96 | 91 | 150 | 160 | |
| () | 120 | 150 | 120 | 6.7 | 96 | 140 | |
| () | 7.6 | 19 | 26 | 1.5 | 18 | 25 | |
| () | 30 | 33 | 30 | 1.2 | 21 | 32 | |
| CSF | |||||||
| Property | Median | Mean | rms | Median | Mean | rms | |
| Age | (Gyr) | 2.0 | 1.7 | 0.84 | 1.0 | 1.3 | 0.91 |
| SFR-weighted age | (Gyr) | 1.0 | 0.83 | 0.42 | 0.75 | 1.1 | 0.85 |
| (mag) | 2.4 | 2.2 | 0.56 | 0.90 | 1.3 | 0.80 | |
| () | 16 | 21 | 16 | 10 | 15 | 11 | |
| bb The values were obtained independently, based on the less model-dependent method described by Rudnick et al. (2003), and are the dust-attenuated luminosities. These estimates are used in all ratios involving . The ages, extinctions, stellar masses, and instantaneous SFRs were derived from the best-fit model to the SEDs. | () | 5.1 | 7.4 | 6.4 | 5.1 | 7.4 | 6.4 |
| () | 2.3 | 3.3 | 1.9 | 1.8 | 2.4 | 1.7 | |
| () | 140 | 150 | 110 | 94 | 170 | 150 | |
| () | 170 | 190 | 130 | 23 | 69 | 110 | |
| () | 6.5 | 15 | 19 | 1.5 | 6.9 | 10 | |
| () | 31 | 32 | 22 | 2.7 | 11 | 17 | |