Berkeley 29, the most distant old open cluster
Abstract
We present CCD BVI photometry of the old open cluster Berkeley 29, located in the anticentre direction. Using the synthetic Colour - Magnitude Diagrams technique we estimate at the same time its age, reddening, distance, and approximate metallicity using three types of stellar evolutionary tracks. The best solutions give: age=3.4 or 3.7 Gyr, (m-M)0 = 15.6 or 15.8 with E(B–V) = 0.13 or 0.10, and metallicity lower than solar (Z=0.006 or 0.004), depending on the adopted stellar models. Using these derived values, Be 29 turns out to be the most distant open cluster known, with Galactocentric distance RGC = 21.4 to 22.6 kpc.
Hence, Be 29 qualitatively follows both the age–metallicity relation and the metal abundance gradient typical of Galactic disc objects. The cluster position and radial velocity, however, appear to link Be 29 to the family of the Canis Major debris.
keywords:
Open clusters and associations: general – open clusters and associations: individual: Berkeley 29 – Hertzsprung-Russell (HR) diagram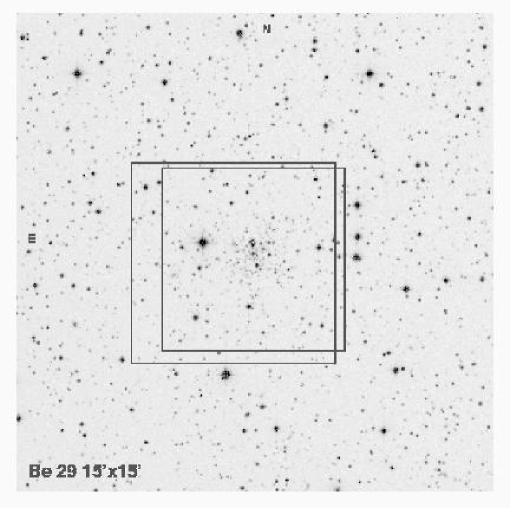

1 Introduction
As amply acknowledged (e.g. Friel 1995), open clusters (OC’s) are among the best objects to describe the Galactic disc properties. In particular, old OC’s may be used to trace the disc formation and evolution, and the history of its chemical enrichment. There is a metallicity gradient in the Galactic disc, with the inner regions being more metal rich than the outer ones, as established on the basis of different indicators, from HII regions (e.g. Shaver et al. 1983) and young B stars (e.g. Smartt & Rollerston 1997), to planetary nebulae (e.g. Pasquali & Perinotto 1993). Open clusters have been suggested to show a metallicity gradient as well (e.g. Janes 1979, Panagia & Tosi 1981, Friel 1995, Carraro, Ng & Portinari 1998, Friel et al. 2002), although Twarog et al. (1997) argue instead that what is observed is a step distribution in OC metallicity.
While there is quite a wealth of OC’s with known metallicity in the Sun vicinity, only few objects farther away have been measured: for instance, in Friel’s (1995) compilation there are only two OC’s with Galactocentric distance larger than 15 kpc (Berkeley 20 and Berkeley 29, this last being the farthest known OC), and another one is present in Twarog et al. (1997: Tombaugh 2). Finding and studying clusters at large distances from the Sun, both towards the Galactic centre and the anticentre is essential to define how the disc properties vary radially. Recently Frinchaboy & Phelps (2002) suggested that the most distant old open cluster is Saurer A (with Galactocentric distance of more than 19 kpc); Carraro & Baume (2003) confirmed their results, finding an age of about 5 Gyr, Z 0.008, and distance from the Sun of 13.2 kpc, implying a Galactocentric distance of about 21 kpc. Even more recently, all these old and distant OC’s, and in particular Saurer A and Be 29, have been proposed to be originated in/by the Canis Major dwarf spheroidal galaxy, the satellite which is merging with the Milky Way near the Galactic plane (Martin et al. 2004, Bellazzini et al. 2004, Frinchaboy et al. 2004).
This paper is part of a long term project dedicated to the study of (mostly old) OC’s both with precision photometry (e.g. Bragaglia & Tosi 2003, Andreuzzi et al. 2004, Kalirai & Tosi 2004, and references therein) and with high resolution spectroscopy (Bragaglia et al. 2001, Carretta et al. 2004). The old open cluster Berkeley 29 (C0650+169, OCL486) has , , l= 197.98, b=8.03. We chose to observe it because it appeared to be the most distant open cluster known, and to have old age and low metallicity (Kaluzny 1994). Even if Saurer A were most distant OC, Be 29 would retain its importance, since it is more populous; moreover, as we will show in this paper, the distance to Be 29 has been underestimated in the past and we do find it to be slightly more distant than Saurer A. For these reasons Be 29 is of paramount importance in defining the disc abundance gradient (if its origin is completely Galactic) or the properties and formation history of accreted clusters (if it originates from the merged satellite).
Perhaps due to its faintness, Be 29 has not been the subject of extensive works in the past: the first and only calibrated colour-magnitude diagram published to date is the one by Kaluzny (1994, hereafter K94). K94 observed in the B, V, and I bands a small field (3 arcmin 8 arcmin) with the 2.1m KPNO telescope, and presented deep and well defined CMDs. From the projected density distribution of stars he derived a radius of about 1.5 arcmin on the sky. He estimated the following properties: age 4 Gyr, distance from the Sun d = 10.5 kpc, Galactocentric distance RGC = 19 kpc, and low metallicity [Fe/H] –1. To derive these figures he assumed E(BV) = 0.21 from Burstein & Heiles (1982). Note however that the new maps of interstellar absorption by Schlegel, Finkbeiner & Davis (1998), appropriate for b 5, give the much lower value E(BV) = 0.093, which would somewhat alter those figures (towards higher metallicity and larger distance from the Sun).
Phelps, Montgomery & Janes (1994, hereafter PJM94) observed the cluster, but published only non calibrated CMDs (instrumental B, V, I magnitudes). They derive an age of 2.1 Gyr, based on the difference in magnitude between the red clump and the main sequence turn-off, and do not give any value for reddening and metallicity. In a companion paper (Janes & Phelps 1994), a distance of 8.6 kpc from the Sun is assigned to Be 29, but based on the assumption of a ”mean” diameter of 5 pc for the old cluster population, hence not very significant.
Noriega-Mendoza & Ruelas-Mayorga (1997) applied to Be 29 a technique for the simultaneous determination of metallicity and reddening, similar to the one developed by Sarajedini (1994) for globular clusters, useful in stellar systems with well defined giant branch and helium burning clump. At variance with the suggestion by K94, they derived [Fe/H]=, and E(BV) =0.01; their estimated uncertainties on these values are 0.04 in [Fe/H] and 0.02 in E(BV) . These results are at odds with what has been obtained by all other studies.
Recently, we have obtained intermediate resolution spectra of 20 stars in the direction of the cluster, and have been able to confirm membership for 12 objects in the crucial evolutionary phases of the red giant branch (RGB) and red clump (Bragaglia, Held & Tosi 2004). This information will be used in the present analysis. Furthermore, comparison of the confirmed members to other well studied clusters has permitted to derive indication for reddening, metallicity (and distance) much more consistent with K94 than with Noriega-Mendoza & Ruelas-Mayorga (1997).
We will present our photometric data and the reduction procedure in Section 2; the CMD, the presence of binaries and the field contamination will be discussed in Section 3. In Section 4 results for age, reddening and distance based on the synthetic CMD technique will be presented, and a summary of results and discussion will be given in Section 5.

2 Observations and data reduction
Be 29 was observed on the night of 9 March 1995 with the 1.54m Danish telescope (La Silla, Chile) and a direct camera, mounting the CCD #28, a chip Tek 1024 1024 pixel, with scale 0.377 arcsec/pix, and field of view of 6.4 x 6.4 arcmin2. The night was part of a run dedicated to open clusters; sky conditions were photometric, and seeing varied from 0.83 arcsec to 1.02 arcsec (see Table 1 for a log of the observations). We observed a single field (see Fig. 1), centered on Be 29; given the small size of the cluster, we did not obtain a separate pointing for field stars decontamination.
To reach fainter magnitudes, these data were supplemented with new ones taken on 16-17 January 2002 with the NTT (La Silla), mounting SuSI2, the Super Seeing Imager, which uses two chips (CCDs #45 and 46, EEV44-80, 2048 4096 pixel) with a scale 0.161 arcsec/pixel and total field of view of 5.5 5.5 arcmin2, with a small vertical gap of 8 arcsec at the junction. In this case seeing varied from 0.66 arcsec to 1.16 arcsec.
Data reduction was done using the usual IRAF111IRAF is distributed by the NOAO, which are operated by AURA, under contract with NSF routines to perform bias subtraction, flat fielding correction, and cleaning of cosmic rays hits. The SuSI2 I images were also corrected for fringing.
We then applied the procedure for PSF study and fitting available in DAOPHOT–II, also in IRAF environment (Stetson 1987, Davis 1994). The building of the initial catalogue was slightly different for the two data sets: we searched the Danish frames independently with DAOFIND and a threshold of 3 over the local sky value, while for the SuSI2 frames we used STARFINDER (Diolaiti et al. 2000), which is very powerful in finding all stars, excluding at the same time false identifications (i.e. extended objects, blends, cosmic rays, defects, etc) but is also quite slow. The following steps were identical, except that the two SuSI2 chips were analyzed separately.
About 20 well isolated, bright stars were used in each frame to define the best analytical PSF model, which was then applied to all the detected objects. The resulting magnitude file was selected both in magnitude, to avoid saturated stars, and in sharpness, a shape - defining parameter, to avoid cosmic rays and false identifications of extended objects (this was relevant mostly for the Danish data).
All output catalogues were aligned in coordinates, and ”forced” on a reference frame for each filter applying a ”zero point” shift to the instrumental magnitude, using dedicated programs developed at the Bologna Observatory by P. Montegriffo. Special care had to be taken in aligning the SuSI2 B magnitudes, for which we had to take into account a colour term.
We computed a correction to the PSF derived magnitudes to be on the same system as the photometric standard stars, performing aperture photometry on a few isolated stars in the reference images (three Danish frames, since they were obtained in photometric conditions). The correction to be applied to the PSF magnitudes was found to be: –0.233 in , –0.204 mag in , and –0.207 in (in the sense aperture minus PSF). The final magnitude catalogue in each band is the result of the (weighted) average of all measures for each stars.
The conversion from instrumental magnitudes to the Johnson-Cousins standard system was obtained using the same equations already derived for this observing run in the case of Pismis 2 (Di Fabrizio et al. 2001, to which we refer for details):
where are instrumental magnitudes, while are the corresponding Johnson-Cousins magnitudes. We calibrated the magnitudes using the relation involving , and the and magnitudes with the ones involving (except for the stars missing , for which we used the colour to calibrate ).
We tested the completeness of our luminosity function in the and band on the deepest images, i.e., the SuSI2 ones, adding artificial stars to the frames and repeating the procedure of extraction of objects and PSF fitting used for the original frame. Stars were added at random positions and selected in magnitude according to the observed luminosity function, about 120 at a time, in order not to significatively alter the crowding conditions, and repeating the process until a total of about 50,000 artificial stars was reached. To the output catalogue of the added stars we applied the same selection criteria in magnitude and sharpness as done for the science frames. The completeness degree of our photometry at each magnitude level was computed as the ratio of the number of recovered stars to the number of simulated ones (considering as recovered objects only those found within 0.5 pix of the given coordinates, and with magnitudes differing from the input ones less than 0.75 mag), and is given in Table 2.
| Telescope | Date | Exp B | Exp V | Exp I |
|---|---|---|---|---|
| (s) | (s) | (s) | ||
| Danish | Mar 9, 1995 | 1200 | 20,60,900 | 20,60,900 |
| NTT | Jan 16, 2002 | 1800 | 2900 | 300,2900 |
| Jan 17, 2002 | 1 | 900 |
| B | complB | V | complV | I | complI |
|---|---|---|---|---|---|
| 16.75 | 1.000 | 16.65 | 1.000 | 15.30 | 1.000 |
| 17.25 | 1.000 | 17.15 | 0.968 | 15.80 | 1.000 |
| 17.75 | 0.991 | 17.65 | 0.987 | 16.30 | 1.000 |
| 18.25 | 0.994 | 18.15 | 0.974 | 16.80 | 0.994 |
| 18.75 | 0.987 | 18.65 | 0.974 | 17.30 | 0.995 |
| 19.25 | 0.983 | 19.15 | 0.971 | 17.80 | 0.989 |
| 19.75 | 0.978 | 19.65 | 0.967 | 18.30 | 0.985 |
| 20.25 | 0.980 | 20.15 | 0.963 | 18.80 | 0.986 |
| 20.75 | 0.974 | 20.65 | 0.946 | 19.30 | 0.975 |
| 21.25 | 0.969 | 21.15 | 0.938 | 19.80 | 0.971 |
| 21.75 | 0.954 | 21.65 | 0.932 | 20.30 | 0.961 |
| 22.25 | 0.949 | 22.15 | 0.912 | 20.80 | 0.932 |
| 22.75 | 0.915 | 22.65 | 0.858 | 21.30 | 0.859 |
| 23.25 | 0.829 | 23.15 | 0.753 | 21.80 | 0.563 |
| 23.75 | 0.608 | 23.65 | 0.428 | 22.30 | 0.166 |
| 24.25 | 0.271 | 24.15 | 0.081 | 22.80 | 0.250 |
| 24.75 | 0.014 | 24.65 | 0.002 | 23.30 | 0.000 |
| 25.25 | 0.000 | 25.15 | 0.000 | 23.80 | 0.000 |
3 The Colour - Magnitude Diagram
The final catalogue contains 1649 stars, of which 1144 have , , and magnitudes, 1182 have at least and magnitudes, and 1611 have at least and magnitudes. The pixel positions of all objects were transformed to equatorial coordinates using software written by P. Montegriffo at the Bologna Observatory, and using the Guide Star Catalogue 2 (GSC2) as reference frame; residuals of the transformation between the two systems (as deduced from the stars in common) are of 0.14 arcsec in right ascension and 0.10 arcsec in declination. Tables containing the photometry, the pixel and equatorial coordinates will be available in electronic form through the BDA222 http://obswww.unige.ch/webda/webda.html (Base Des Amas, Mermilliod 1995).
The resulting CMDs are shown in Fig. 2: the cluster sequences are very well delineated, with a main sequence (MS) extending from and or at the turn-off (TO) point down to 23 or 23.5, for about 4 - 5 magnitudes. The subgiant and red giant branches (SGB, RGB) are also visible, even if suffering more from field contamination (the Galactic disc), which appears like a scattered main sequence, positioned mostly on the red side of the cluster MS, and extending to redder colours and to luminosities much brighter than the MS TO of Be 29. The red clump, i.e., the locus of core-He burning stars, is present at and , . Three stars stand up, at , , : as already noted by K94, they seem to represent the brighter part of the RGB, if not its tip.
We also identified stars in common between our sample and K94, and a comparison of the two photometries is shown in Fig. 3: they appear to be in perfect agreement, with average zero point shifts of much less than 0.01 mag in all the three filters.
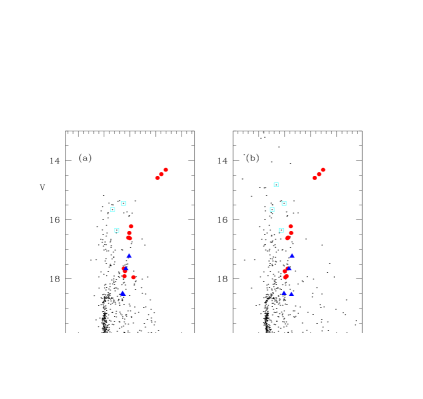
Recently Bragaglia et al. (2004) derived radial velocities to determine membership for a subsample of 20 stars, including the three bright RGB ones: 4 were definitely found to be field objects, 4 have uncertain status, and 12 appear to belong to the cluster RGB and clump. These stars are indicated with different symbols in Fig. 4
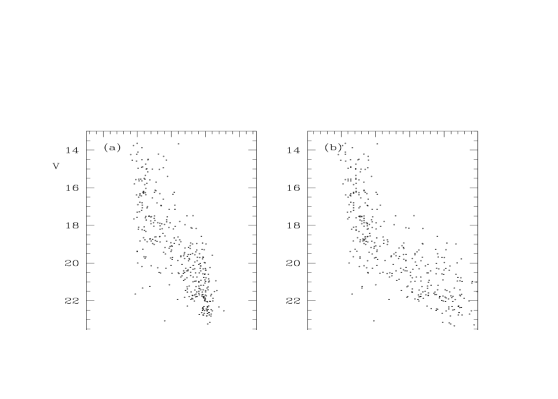
This information is not sufficient to define a clean and safe cluster sample, so to further check on the field fore/background contamination we have plotted the CMDs, selecting stars near the cluster centre or far from it (see Fig. 5): the cluster sequences are even easier to locate, and this will be used in next Section, when selecting the sample of stars to simulate.
To further test the identification of cluster and field components, we have also used the Besançon models for the Galaxy stellar structure (Robin et al. 2003, available at the web site www.obs-besancon.fr/www/modele/modele_ang.html). Results of a query on an area equivalent to our field of view located at l=200, b=8 are shown in Fig. 6, where we have applied our same incompleteness factors. It’s easy to appreciate the similarity of the model to what we have defined as field population in our data. In other words, we are seeing the ”normal” components of the Milky Way, without indications of extra contribution from e.g. the Canis Major galaxy, seen in the background of other OC’s (Bellazzini et al. 2004). On the other hand, our field of view is very small (about 0.011 square degrees) and Be 29 is not near the supposed nucleus of the disrupted satellite (located at galactic coordinates l,b ).

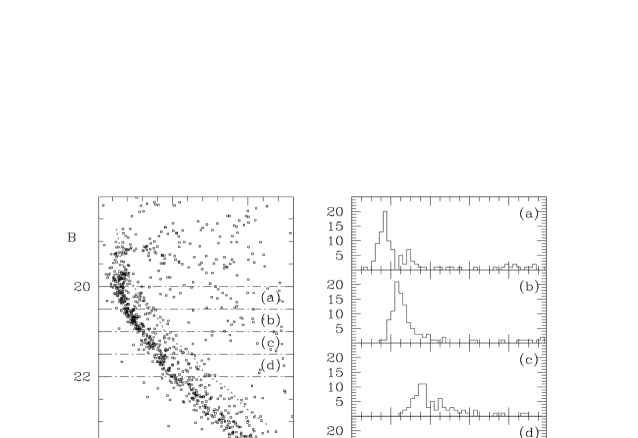
Even if not so evident from Figs. 2 and 5, a population of binary systems is present in Be 29, as in all the other open clusters examined to date. Fig. 7 shows an enlargement of the MS, plotting the CMD, which allows for a better discrimination of the single and binary stars main sequences. The fraction of binary systems will be derived together with the cluster parameters in the next Section.

4 Cluster parameters
Age, distance and reddening of Be 29 have been derived with the same procedure applied to all the clusters of our project (see Andreuzzi et al. 2004, Kalirai & Tosi 2004 and references therein), namely the synthetic CMD method originally described by Tosi et al. (1991). The best values of the parameters are found by selecting the cases providing synthetic CMDs with morphology, colours, number of stars in the various evolutionary phases and luminosity functions (LFs) in better agreement with the observational ones.
As usual, to test the effect of different input physics on the derived parameters, we have run the simulations with three different types of stellar evolutionary tracks, assuming different prescriptions for the treatment of convection and ranging from no overshooting to high overshooting from convective regions.
Be 29 is known to be rather metal poor (see the Introduction), but to avoid biases in the parameter determinations, we have created the synthetic CMDs adopting, for each type of stellar models, metallicities ranging from solar down to 1/20 of solar. Notice that we consider as solar metallicity tracks those with Z=0.02, because they are the ones calibrated by their authors on the Sun, independently of the circumstance that nowadays the actual solar metallicity is supposed to be lower (see Asplund et al. 2004). We recall that the position of a stellar model in the CMD depends only on its mass, age and metallicity, but the formal effect of metallicity actually includes that of the opacities adopted in the stellar evolution models. Metallicities attributed to clusters via comparison with stellar models or isochrones therefore are always to be taken with caution. This is why we consider only indicative the metallicities obtained with our photometric studies and prefer to use high resolution spectroscopy for a safe determination of the chemical abundances.
The adopted sets of stellar tracks are listed in Table 3, where the corresponding references are also given, as well as the model metallicity and the information on their corresponding overshooting assumptions. The transformations from the theoretical luminosity and effective temperature to the Johnson-Cousins magnitudes and colours have been performed using Bessel, Castelli & Pletz (1998) conversion tables and assuming E(V-I) = 1.25 E(BV) (Dean et al. 1978) for all sets of models. Hence, the different results obtained with different stellar models must be ascribed fully to the models themselves and not to the photometric conversions.
| Set | metallicity | overshooting | Reference |
|---|---|---|---|
| BBC | 0.02 | yes | Bressan et al. 1993 |
| BBC | 0.008 | yes | Fagotto et al. 1994 |
| BBC | 0.004 | yes | Fagotto et al. 1994 |
| FRA | 0.02 | no | Dominguez et al. 1999 |
| FRA | 0.01 | no | Dominguez et al. 1999 |
| FRA | 0.006 | no | Dominguez et al. 1999 |
| FRA | 0.001 | no | Dominguez et al. 1999 |
| FST | 0.02 | =0.02 | Ventura et al. 1998 |
| FST | 0.02 | =0.03 | Ventura et al. 1998 |
| FST | 0.01 | =0.02 | Ventura et al. 1998 |
| FST | 0.01 | =0.03 | Ventura et al. 1998 |
| FST | 0.006 | =0.02 | Ventura et al. 1998 |
| FST | 0.006 | =0.03 | Ventura et al. 1998 |
The synthetic stars are attributed the photometric error derived from the artificial stars tests performed on the actual images. They are retained in (or excluded from) the synthetic CMD according to the photometry completeness factors listed in Table 2. All the synthetic CMDs have been computed either assuming that all the cluster stars are single objects or that a fraction of them are members of binary systems with random mass ratio. We find, as in many other clusters, that a binary fraction around 30% well reproduces the observed distribution along the main sequence. All the synthetic CMDs shown in the figures assume this fraction of binaries.
Membership to the cluster has been proven (Bragaglia et al. 2004) for 12 stars, including the three brightest red giants of the CMD. We have run the simulations both for the CMD corresponding to the whole field covered by our images (using the more external part of the field to estimate back/foreground contamination) and to the inner cluster region, practically unaffected by contamination. The results are absolutely consistent with each other and therefore we present here only the cases corresponding to the inner cleaner region. The examined field has a radius of 2 arcmin from the cluster centre. After removing the stars that, on the basis of the radial velocities and of the external field CMD, appear not to be cluster member, this field contains 553 stars measured in all the , and filters. The corresponding CMDs are shown in Fig. 8 a and b. The synthetic CMDs have therefore been created with this number of objects.
We find that in all cases a solar metallicity must be excluded for Be 29, since all the synthetic CMDs with Z=0.02 are too red and we would need a non physical negative reddening to account for the observed colours. Stellar tracks with metallicity lower than solar can reproduce the observed MS colours, if an appropriate reddening is adopted, but only those with Z = 0.004 – 0.006 are able to reproduce both in and in the colours of the observed RGB. All the other metallicities lead to excessively red RGBs either in one colour or in both. Moreover, metallicities outside the indicated range sometimes lead also to less consistent features in the CMD sequences.
More in detail, the BBC models with Z=0.004, age=3.7 Gyr, E(BV) = 0.12 and (m-M)0=15.60 reproduce quite well both the morphology and the number of objects of the CMD evolutionary sequences (MS, SGB, RGB and clump), as well as their colours, both in and in (see Fig. 8 c and f). The synthetic sequences are slightly tighter than the empirical ones, but this may be due to residual contamination from back-foreground stars (see also the LFs below). This aspect is found also for all the types of examined models.
The FST models with Z=0.006 and moderate overshooting reproduce equally well the data, for age=3.4–3.5 Gyr, E(BV) = 0.10 and (m-M)0=15.80 (see Fig. 8 e and h). They need a slightly younger age than the BBC models because they have a somewhat lower overshooting, and a slightly lower reddening because they are slightly more metal rich. The FST models with same Z=0.006 metallicity but higher overshooting also reproduce the observed colours for an age 3.5–3.8 Gyr and the same E(BV) = 0.10 and (m-M)0=15.80, but the morphology of the upper MS, just below the turn-off point, is rounder than observed.
The BBC models with Z=0.008 reproduce fairly well the CMD morphology and number counts, the best case having age=3.5 Gyr, E(BV) = 0.08 and (m-M)0=15.75. However, their RGBs always turn out to be too red in and we then consider this (formal) metallicity less adequate than Z=0.004. Similarly, the FRA models with Z=0.006 reproduce rather well the cluster CMD and LF, but their RGB in are redder than observed. For these FRA models, the best case assumes age=2.5 Gyr, E(BV) = 0.15 and (m-M)0=15.80 (Fig. 8 d and g). This age is much younger than that of the BBC and FST models because stars of the same mass are fainter than in the overshooting case.
Also the FST tracks with Z=0.01 lead to RGBs too red in . In addition they have too flat subgiant branches and excessive curvature of the upper MS. The FRA models with Z=0.001 have RGB and clump excessively red both in B–V and in and a non satisfactory shape of the turn-off. The FRA models with Z=0.01 also have excessively red RGB and clump and the tendency to over populate them.
The LFs of the best cases for the BBC, FRA and FST models are shown in Fig. 9 (lines) and compared to that of the CMD of Fig. 8a, assumed to be the empirical one (dots). In no case the fit to the data is really good: the models tend to underestimate the number of stars brighter than and to overestimate the number of stars fainter than . We ascribe the first problem to the fact that the synthetic CMDs assume that all the stars of the CMDs of Fig. 8 a and b are actual members of Be29, whilst it may well be that some objects are not, specially on the brighter parts where the field star sequence intersects the cluster sequences. Indeed, the spread around the subgiant and red giant branches does suggest the presence of some residual contamination. This explanation makes the second problem more significant, since contaminating objects may be present also in the fainter regions of the empirical CMD, thus making the intrinsic LF of Be 29 lower than the shown one. We suggest that the discrepancy between synthetic and empirical LF at faint magnitudes be due to evaporation of low mass stars from the cluster.

5 Summary and discussion
From comparison of the observed CMD’s to synthetic ones we obtain the following results:
i) of the three different sets of evolutionary tracks used, the best reproductions come from the BBC and FST ones, i.e. the ones taking overshooting from convective regions into account;
ii) the best solutions are obtained for abundances lower than solar (Z=0.02 is excluded), with formal metallicity [Fe/H] –0.5 or –0.7. This is higher than estimated by K94, and in very good agreement with the results of Bragaglia et al. (2004: [Fe/H] = ) obtained in a completely independent way;
iii) the age of Be 29 is found to be around 3.5 Gyr (best synthetic CMDs provide values from 3.4 to 3.8 Gyr), and this is in reasonable agreement with the value given by K94;
iv) the best reddening value is around 0.1 mag (E(BV) = 0.10 to 0.13), that well compares to the Schlegel et al. (1998) value of 0.093. The strong disagreement with the 0.21 value adopted by K94 explains the different distance moduli;
v) the best solutions for the absolute distance modulus of Be 29 give (m-M)0= 15.6 or 15.8. This puts the cluster at least as far as, or even farther than, Saurer A from the Galactic centre, with RGC = 21.4 or 22.6 kpc, thus reinforcing its place of most distant in the still scarce family of very far and old open clusters known in the Milky Way.
Be 29 is then an old, relatively metal-poor, distant open cluster. This makes it nicely consistent with what is expected from simple chemical evolution arguments, predicting that old stars are more metal poor than younger stars formed in the same place and that the metallicity of coeval objects decreases with increasing distance from the Galactic centre. The precise and detailed metal abundance of Be 29, derived from high resolution spectroscopy and fine abundance analysis, would be very valuable in defining the metallicity gradient along the entire disc.
The conclusion that Be 29 appears as a well behaved object in the framework of Galactic chemical evolution is challenged by a recent suggestion that this cluster actually is not of truly Galactic origin, but is somehow connected to the interaction between the Galaxy and its merging satellite Canis Major. Frinchaboy et al. (2004) suggest that the old and far open clusters, specially those located in the two Galactic quadrants towards the anticentre, lie along a string-like configuration, and follow quite accurately the distribution of M stars defining the Galactic anticentre stellar structure (GASS). The coincidence exists both in position (see their fig. 1) and in the l-vGSR plane (their fig. 2), where vGSR is the radial velocity corrected to the Galactic centre. They lack velocity information on Be 29, but we have it (Bragaglia et al. 2004), and it puts the cluster right in the GASS alignment. If Be 29 was really born in the dwarf galaxy Canis Major, or formed by the interaction of the satellite gas with the Milky Way gaseous disc component, its study may be useful to characterize the star formation history of disturbed regions of our Galaxy.
Our current data don’t allow us to discriminate between the Galactic or external origin of Be 29. The circumstance that its CMD doesn’t show evidence of contaminants other than the normal Galactic disc stars predicted by the Besançon models seems to suggest that no striking components are present in that region. However, our field of view is likely to be too small to detect this kind of features. We are thus left with the intriguing question of whether or not the consistency of the properties of Be 29 with the Galactic age-metallicity relation and metallicity gradient should be taken as a confirmation of standard Galactic evolution theories.
ACKNOWLEDGEMENTS
This work is based on observations collected at the European Southern Observatory, Chile. We warmly thank P. Montegriffo for his expert assistance with the data reduction and the use of his software, and M. Bellazzini for useful discussions. We thank Franca D’Antona and Paolo Ventura for providing their stellar evolution models prior to publication. The bulk of the numerical code for CMD simulations was originally provided by Laura Greggio. L.D.F. has been funded by a contract at the Osservatorio Astronomico di Bologna. This work was partly supported by MURST-Cofin98, under the project “Stellar Evolution” and MIUR-Cofin2000 under the project ”Stellar observables of cosmological relevance”. This research has made use of the Simbad database, operated at CDS, Strasbourg, France and of the BDA database, maintained by J.C. Mermilliod.
References
- [1] Andreuzzi, G., Bragaglia, A., Tosi, M., & Marconi, G. 2004, MNRAS, 348, 297
- [2] Asplund, M., Grevesse, N., Sauval, A.J., Allende Prieto, C., & Kiselman D. 2004, A&A, 417, 751
- [3] Bellazzini. M., Ibata, R., Monaco, L., Martin, N., Irwin, M.J., & Lewis, G.F. 2004, MNRAS, in press (astro-ph/0311119)
- [4] Bessel, M.S., Castelli, F.,& Plez, B. 1998, A&A, 337, 321
- [5] Bragaglia, A., & Tosi, M. 2003, MNRAS, 343, 306
- [6] Bragaglia, A., et al. 2001, AJ, 121, 327
- [7] Bragaglia, A., Held, E.V., & Tosi, M. 2004, A&A, submitted
- [8] Bressan, A., Fagotto, F., Bertelli, G., & Chiosi, C. 1993, A&AS, 100, 647
- [9] Burstein, D., & Heiles, C. 1982, AJ, 87, 1165
- [10] Cardelli, J.A., Clayton, G.C.,& Mathis, J.S. 1984, ApJ, 345, 245
- [11] Carraro, G., & Baume, G. 2003, MNRAS, 346, 18
- [12] Carraro, G., Ng, Y.K., & Portinari, L. 1998, MNRAS, 296, 1045
- [13] Carretta, E., Bragaglia, A., Gratton, R.G., & Tosi, M. 2004, A&A, in press (astro-ph/0404298)
- [14] Davis, L.E. 1994, A Reference Guide to the IRAF/DAOPHOT Package, IRAF Programming Group, NOAO, Tucson
- [15] Dean, J.F., Warren, P.R., & Cousins, A.W.J. 1978, MNRAS, 183, 569
- [16] Di Fabrizio, L., Bragaglia, A., Tosi, M., & Marconi, G. 2001, MNRAS, 328, 795
- [17] Diolaiti, E., Bendinelli, O., Bonaccini, D., Close, L., Currie, D., & Parmeggiani, G. 2000, A&AS, 147, 335
- [18] Dominguez, I., Chieffi, A., Limongi, M., & Straniero, O. 1999, ApJ, 524, 226
- [19] Dutra, C.M., & Bica, E. 2000, A&A, 359, 347
- [20] Fagotto, F., Bressan, A., Bertelli, G., & Chiosi, C. 1994, A&AS, 105, 29
- [21] Friel, E.D. 1995, ARA&A, 33, 381
- [22] Friel E.D., Janes K.A., Tavarez M., Scott J., Katsanis R., Lotz J., Hong L., & Miller N., 2002, AJ, 124, 2693
- [23] Frinchaboy, P.M., & Phelps, R.L. 2002, AJ, 123, 2552
- [24] Frinchaboy, P.M., Majewski, S.R., Crane, J.D., Reid, I.N., Rocha-Pinto, H.J., Phelps, R.L., Patterson, R.J., & Muñoz, R.R., 2004, ApJ, 602, L21
- [25] Janes, K.A. 1979, ApJS, 39, 135
- [26] Janes, K.A., & Phelps, R.L. 1994, AJ, 108, 1773
- [27] Kalirai, J.S., & Tosi, M. 2004, MNRAS, in press
- [28] Kaluzny, J. 1994, A&AS, 108, 151 (K94)
- [29] Martin, N., Ibata, R.A., Bellazzini, M., Irwin, M.J., Lewis, G.F., & Denhen, W. 2004, MNRAS, 348, 12
- [30] Mermilliod, J.C. 1995, D. Egret, M.A. Albrecht eds, Information and On-Line Data in Astronomy, Kluwer Academic Press (Dordrecht), p. 127
- [31] Noriega-Mendoza, H., & Ruelas-Mayorga, A. 1997, AJ, 113, 722
- [32] Panagia, N. & Tosi, M. 1981, Astron.Astrophys. 96, 306
- [33] Pasquali, A. & Perinotto, M. 1993, Astron.Astrophys. 280, 581
- [34] Robin, A.C., Reylé, C., Derrière S., & Picaud, S. 2003, A&A, 409, 523
- [35] Sarajedini, A. 1994, AJ, 107, 618
- [36] Shaver, P. A., McGee, R. X., Newton, L. M., Danks, A. C., Pottasch, S. R. 1983 MNRAS, 204, 53
- [37] Schlegel, D.J., Finkbeiner, D.P., & Davis, M. 1998, ApJ, 500, 525
- [38] Smartt, S., & Rollerstone, W. 1997, ApJ, 481, L47
- [39] Stetson, P.B. 1987, PASP 99, 191
- [40] Tosi, M., Greggio, L., Marconi, G., & Focardi, P. 1991, AJ, 102, 951
- [41] Twarog, B.A., Ashman, K.M., & Anthony-Twarog, B. 1997, AJ, 114, 2556
- [42] Ventura, P., Zeppieri, A., Mazzitelli, I, & D’Antona, F. 1998, A&A, 334, 953